Please cite this article as:A. Darvishi and H. Hassanpour, A Geometric View of Similarity Measures in Data Mining,International Journal of Engineering (IJE), TRANSACTIONS C: Aspects Vol. 28, No. 12, (December 2015) 1728-1737
International Journal of Engineering
J o u r n a l H o m e p a g e : w w w . i j e . i rA Geometric View of Similarity Measures in Data Mining
A. Darvishi, H. Hassanpour*
Faculty of Computer Engineering, University of Shahrood, Shahrood, Iran
P A P E R I N F O
Paper history: Received 08October 2015
Received in revised form 02December 2015 Accepted 24December 2015
Keywords: Data Mining Feature Extraction Similarity Measures Geometric View
A B S T R A C T
The main objective of data mining is to acquire information from a set of data for prospect applications using a measure. The concerning issue is that one often has to deal with large scale data. Several dimensionality reduction techniques like various feature extraction methods have been developed to resolve the issue. However, the geometric view of the applied measure, as an additional consideration, is generally neglected. Since each measure has its own perspective to the data, different interpretations may achieved on data depending on the used measure. While efforts are often focused on adjusting the feature extraction techniques for mining the data, choosing a suitable measure regarding to the nature or general characteristics of the data or application is more appropriate. Given a couple of sequences, a specific measure may consider them as similar while another one may quantify them as dissimilar. The goal of this research is twofold: evincing the role of feature extraction in data mining and revealing the significance of similarity measures geometric attributes in detecting the relationships between data. Differrent similarity measures are also applied to three synthetic datasets and a real set of ECG time series to examine their performance.
doi: 10.5829/idosi.ije.2015.28.12c.05
1. INTRODUCTION1
Data mining is essential in a wide range of applications including machine learning [1], data visualization [2], classification [3], and clustering [4]. Analyzing data to discover similar patterns, unfamiliar events, or relationship between data is the undertaken task in data mining [5]. As a case in point, examining electrocardiogram (ECG) signals to clarify the difference between normal and abnormal activities of a patient in medicine [6]. One concerning issue is the undesirable excessive running time in dealing with lengthy time series [7].
Dimensionality reduction techniques like feature extraction approaches are solutions to enhance both the accuracy and the speed. There are various types of feature extractions methods in the literatures such as singular value decomposition (SVD), the discrete fourier transform (DFT), and the discrete wavelet transform (DWT) [7-9]. Pattern recognition and machine learning systems are highly influenced by the quality of the derived values of the raw data in the
1*Corresponding Author’s Email: [email protected] (H.
Hassanpour)
feature extraction approach from preprocessing phase. There is another fundamental issue in performance of the desired tasks, choosing an appropriate similarity measure.
vectors (R1,R2,…,Rn) located on the surface of a sphere are evaluated as the same similar to the origin due to taking merely the location of points into account. An intuitive understanding of this concept can be seen in Figure 1. This is the perspective of the Euclidean which may not be suitable in some applications.
This study aims to emphasis the importance of similarity measures role in data mining. It is argued that according to the type of data, a proper measure should be chosen to reveal the relationship between samples more precisely. However, the majority of applications, such as sorting the agricultural products, appeal speed in addition to the accuracy [11, 12]. Therefore, the time consumption should be regularly considered. To enhance the speed, reduction in the dimensionality is carried out by feature extractions which may develop the precision as well.
The rest of the paper is organized as follows. First, a set of similarity measures geometry are investigated by drawing their structures of region classifications in section 2. Section 3 summarizes two regular feature extraction approaches which are used in the experiments, the Piecewise Aggregate Approximation (PAA) and the Discrete Wavelet Transform (DWT). Then, the measures performance are evaluated in the clustering problem of three synthetic datasets- CBF (Cylinder, Bell, and Funnel), SCC (Synthetic Control Charts), and MCW (Multi Component Waves) and one real-world case study of ECG. In section 4, the attained results are discussed. Finally, section 5 offers some conclusions and possible future research.
2. THE GEOMETRY OF MEASURES
This section attempts to present an intuition behind the similarity measures geometry. The shapes of clustering data preferred by various measures are depicted. A number of methods have been introduced to measure the similarity between time series or discrete signals [10, 13-17], each of which has a different view on the data due to their geometric attributes. Given two sequences, X = {x1,…,xn} and Y = {y1,…,yn}, their
distance/similarity can be defined by the three group of measures categorized in the Table 1. Details on these measures can be found in literatures [18-20]. Each of the functions implies a different interpretation on data. The various geometric sights of the above mentioned measures are illustrated using plots of the classification regions sketched as follows.
R r
R1 Z
X
Y
R3 Rn R2
Figure 1.Vectors with the same Euclidian distance in a three-dimensional coordination.
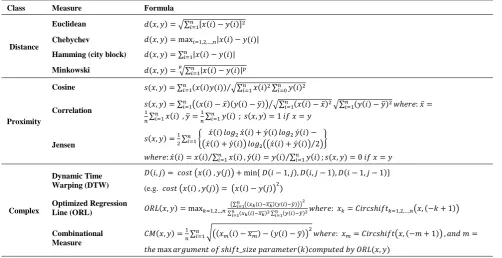
TABLE 1. Examples Of Exiting Similarity/Distance Measures
Class Measure Formula
Distance
Euclidean ( ) √∑ [ ( ) ( )]
Chebychev ( ) | ( ) ( )|
Hamming (city block) ( ) ∑ | ( ) ( )|
Minkowski ( ) √∑ | ( ) ( )|
Proximity
Cosine ( ) ∑ ( ( ) ( )) ⁄√∑ ( ) ∑ ( )
Correlation ( ) ∑ (( ( ) ̅)( ( ) ̅)) ⁄√∑ ( ( ) ̅) √∑ ( ( ) ̅) ̅
∑ ( ) ̅ ∑ ( ) ( )
Jensen ( ) ∑ {
́( ) ́( ) ́( ) ́( )
( ́( ) ́( )) (( ́( ) ́( )) ⁄ )}
́( ) ( ) ∑⁄ ( ) ́( ) ( ) ∑⁄ ( ) ( )
Complex
Dynamic Time Warping (DTW)
( ) ( ( ) ( )) { ( ) ( ) ( )}
(e.g. ( ( ) ( )) ( ( ) ( )))
Optimized Regression
Line (ORL) ( )
(∑ (( ( ) ̅̅̅̅)( ( ) ̅)))
∑ ( ( ) ̅̅̅̅) ∑ ( ( ) ̅) ( ( ))
Combinational Measure
( ) ∑ √(( ( ) ̅̅̅̅) ( ( ) ̅)) ( ( ))
a. The measures perspective is simply drawn by considering only two features and computing the distance/proximity of points in the space using a selected measure from a reference point such as R= [x0,y0]. As a metaphor, standing on the origin, the
world around through the eye of the selected measure would look like the corresponding constructed structure. The lines of the constant contour in the plots of Figure 2 show the type of geometric construct that suits the focus of the quest for structure. For example, it can be seen from Figure 2. (a,b) that the Euclidean and the Chebychev distances favor circular and square shapes of data cluster, respectively.
b. The measures preferred shapes of geometry can be represented by constructing points with a certain distance or proximity from the origin (e.g. R= [x0,y0,z0]) in space. It is quite a decent illustration for
such a basic concept that if the above measures are employed as an excavating tool in a mine of a 3D-space data, the extracted minerals of information clusters would be in similar shapes of the measures corresponding structure in Figure 3. At a glance on the expressive plots, a meaningful difference can be assumed between measures perception of space. In addition, regarding the plots of each measure in Figures 2 and 3, these differences become more obvious as the dimension grows. Thus, the more quantity of features in a dataset, the higher the divergence of measures perception.
(e) (d)
(c) (b)
(a)
(k) (j)
(i) (h)
(g) (f)
Figure 2. Geometry of the measures in Table 1 by sketching the distance of points in 2-D space from [0 0] using: a. Euclidean, b. Chebychev, c. Hamming (city block) d. Murkowski (p=3) e. Murkowski (p=8) f. Cosine from [-0.5 0.95], g. Correlation from [1 0], h. Jensen from [1 1], i. DTW from [0 0], j. ORL from [1 0], k. Combinational Measure from [0 0].
(a) (b) (c) (d) (e) (f)
(g) (h) (i) (j) (k) (l)
3. EVALUATION
As mentioned earlier, a measure perspective diverges significantly from that of other measures as dimensions raise. In order to gain an insight into the various perceptions in higher dimensions, different datasets are applied each of which with different shapes per each class. Also, clustering problem is supposed to be a suitable criterion for assessing similarity measures geometric view as it is directly influenced by the perspicuity of the applied measures on the test data [21]. To this end, three synthetic datasets are used: CBF (Cylinder, Bell, and Funnel), SCC (Synthetic Control Charts), and MCW (Multi Component Waves) where each instance is a time series with the length of 128, 60, and 189 samples, respectively. Examples of these datasets are shown in Figure 4. These synthetic data generated by some random processes has been generally utilized for evaluating the proposed algorithms or assessing the process quality specification of a production [18, 22, 23].
At first, a clustering problem is conducted on the raw data, the actual data with no feature extractions involved, in time domain. This examination is repeated for each selected measure using the nearest-neighbor approach. The concerning issue is that the computational complexity should be generally considered, the amount of time consumed by the algorithm to accomplish a procedure in detecting the relationship between samples directly from the raw data. So, in the next step, the effects of feature extraction are evaluated in the similar clustering problem. The extracted vectors of time series usually improve both the
accuracy and the speed with a reduction in the dimensionality.
Several preprocessing techniques have been proposed for extracting features from the time series [24-27]. Among them, two regular ones are selected: Piecewise Aggregate Approximation (PAA) and Discrete Wavelet Transform (DWT). The total cost of time is also calculated for all experiments to study the reached speed up. The running time of the feature based methods has two components (i.e. before the algorithm stopped): (1) the time taken by the preprocessing method to extract the approximated features of the time series and (2) the time to measure the distance/similarity (i.e. d(x,y) or s(x,y)) of the whole dataset with the 10 representatives of each class and assigning the test sample to the nearest one.
3. 1. PAA This method reduces the dimensionality of a signal by a simple averaging approach. A sequence of length n such as X=x1,x2,…,xn is transformed to an
approximated vector of length N (1≤N≤n) such as
̅ ̅ ̅ ̅ using the following equation:
(1)
i n N i n N j j i x n N x 1 ) 1 (By setting N to 1 and n this method simply represents the mean and the identical of the original sequence respectively. Generally, it generates a piecewise constant approximation of the original sequence, so it was called as Piecewise Aggregate Approximation [28]. A simple vector and a CBF time series with their PAA approximation are shown in Figure 5.
a.6. Downward shift a.5. Upward shift
a.4. Decreasing trend a.3. Increasing trend a.2. Cyclic a.1. Normal c.3. Funnel c.2. Bell c.1. Cylinder b.3. (5,10,45) b.2. (3,9,20) b.1. (1,13,32)
Figure 4.Three synthetic datasets for similarity measures evaluation: a. SCC. b. MCW=( )[ ( ) ( )
( )] c. CBF; Cylinder ( ) [ ]( ) ( ); Bell ( ) [ ]( ) ( ) ( ) ( );
Funnel ( ) [ ]( ) ( ) ( ) ( ). ( ) [16,32]; b [32,96] ;
( ); [ ]( ) {
(a) (b) (c)
Figure 5. Examples of applying the PAA technique: a) Original vector (X=(-1,-2,-1,0,2,1,1,0)), b) Reduced representation vector( ̅ ( mean(-1,-2), mean(-1,0), mean(2,1), mean(1,0))=(-1.5,-0.5,1.5,0.5)) c) A Cylinder sample from CBF data and its approximation.
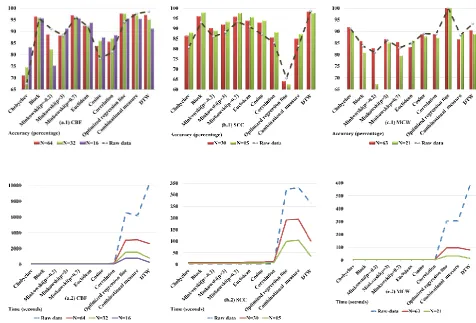
Figure 6. Comparison of the selected similarity measures (1. Accuracy, 2. Running time) performance in clustering problem using PAA technique on: a) 10000 test samples of CBF (N=64, 32, 16), b) 600 test samples of SCC (N=30, 15), c). 3000 test samples of MCW (N=63, 21).
The clustering experiment on the datasets are conducted by applying the PAA technique with different adjustments on the dimension reduction, the N parameter in (1). The performances of selected measures are presented in the Figure 6.
According to the experiment on the raw data of CBF, the best accuracy was achieved by the most complex measure, the DTW. Since the time complexity
of DTW is O (n2) [29], the speed is significantly improved by reducing the dimensionality. However, its accuracy seems to be sensitive to these change. As it can be seen, the performances of simple measures like the city block and also the ORL are enhanced in comparison with that of the experiment on raw-data.
Applying the PAA technique on the SCC data has revealed interesting results. All selected distance and
0 1 2 3 4 5 6 7 8 9
-2 0 2
0.5 1 1.5 2 2.5 3 3.5 4 4.5
-2 0 2
proximity measures present an enhancement in accuracy at decreasing the size from 30 to 15. Even the combined measure, which utilizes the properties of the both types, shows an improvement. Regarding the charts in Figure 6(b.1), considerable achievements in these kinds of measures were attained in comparison with the experiment on raw data, while DTW and ORL outcomes are slightly inferior. Dealing with the PAA approximated MCW, majority of the measures decline not only in the running time, but also in their accuracy. The ORL is an exception which performs perfectly same as on the raw data.
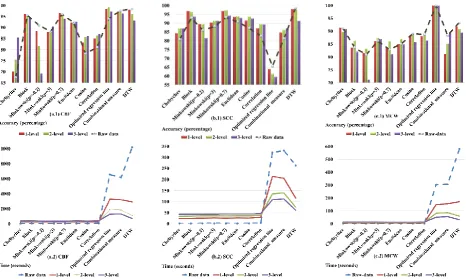
3. 2. DWT Discrete Wavelet Transform (DWT)
approximates a signal by weighted sum of wavelet functions. It is similar to the Fourier transform where a signal is decomposed into a weighted sum of sinusoids [30]. Though, it considers both frequency and location in time for estimation. The same clustering experiments on the datasets are performed by using DWT. A comparison of the performance of different measures in clustering DWT coefficients of the datasets is presented in Figure 7.There is a growth in the ORL performance in CBF dataset applying the wavelet transform, the best accuracy has gained by the ORL using 2-level DWT.
Also, there are some slight changes in the accuracy of the distance measures. Dimensionality reduction using the DWT on the SCC has made a moderate increase in the accuracy of the measures except the ORL and the DTW. There is a dramatic fall in the running time of the DTW which can be considered as an asset while its accuracy declines to some extent. The performances of the measures on the MCW dataset clustering show minor alterations applying the DWT while the ORL is still steady towards this dataset.
3. 3. An Example of Real–World Application - ECG Dataset In this experiment, a dataset of 890 recorded electrocardiogram time series has been used, named the ECG Five Days [31]. It comprises 23 training data and 861 test data with the length of 136 samples. Figure 8 shows instances of the two classes ECG time series.
As it can be seen from above plots, the objects from two different classes are totally alike, and it is even difficult for an inexperienced individual to make a distinction between them. Figure 9 presents the performance of different measures in this classification problem using the nearest neighbor approach.
Figure 8. Two classes ECG time series
Figure 9. Performance comparison of the selected similarity measures (1. Accuracy, 2. Running time) performance in ECG classification problem using: a) three different levels of DWT, and b) PAA technique on: (N=68, 34, 17)
On this dataset, the most of the measures accuracy hardly reaches 80%, even the robust Dynamic Time Wrapping. However, the ORL algorithm gains 98.95%. According to the classes, some sort of translations involved in signals like amplitude-scale, time-shift, and phase-delay are the most distinctive attributes. Therefore, it can be claimed that the ORL excel is due to being invariant against these kind of transformations.
4. DISCUSSION
The main contribution of this paper is to demonstrate that the more sophisticated preprocessing procedures and the measuring algorithm do not necessarily guarantee the optimum performance in data analysis. Decide on an appropriate measure along with a proper dimensionality reduction technique should be considered based on the nature of the data in specific
(a.1) (b.1)
(a.2)
application. For a given dataset, the efficiency of clustering algorithm depends not only on the reliability of the approximated features in the reduced dimensionality space, but also on the similarity measure geometry nevertheless.
Most researches have focused on modifying the dimensionality reduction techniques that offer better derived values of their datasets. However, they usually choose an arbitrary measure of similarity. In contrast, the obtained results in pervious section show that the role of the selected measure is more significant than the selected features. As a case in point, it can be seen from Figure 6(b.1) that the majority of the measures accuracy improve in clustering the SCC using PAA. However, the amounts of the enhanced accuracies remain proportional against each other in comparison with the previously gained results on the raw data. In other words, it is of course accurate that dimensionality reduction techniques would eventually improve the performance, but the most promising assumption is that the more the geometry of the measure cope with the nature of data, the better the overall performance. The general trends of measures accuracy using feature extractions follow their achievements on the raw data (Figures 6, 7, and 9), it has made no surprising changes in the measures accuracy against each other. It can be claimed that the outcomes are more sensitive to the applied measure rather than the applied dimensionality reduction technique. Therefore, decision on which measure to utilize should be ahead of feature extraction method.
The best gained accuracy in: CBF is achieved by ORL using 2-level wavelet transform (99.23%). For SCC, it is attained by DTW applied to the raw-data (98.66%), and MCW is perfectly clustered by ORL in the whole experiments (100%). The ORL method for the ECG dataset has also attained a better performance than the traditional methods on the raw-data (98.95%). Although the running time of the complex measures is enhanced by feature extractions methods, their accuracy fluctuate from data to data. In contrast, the speed of clustering using simple measures has been slightly degraded by applying extraction methods, while their achieved accuracy improved in the most cases (refer to Figure 7b).
There are many circumstances that it would be preferred to lose some accuracy for a better running time such as in sorting and grading tons of agricultural and food products. The impact of dimensionality reduction techniques would be more obvious in such situations. The algorithms have been implemented in MATLAB. All experiments are performed on a PC running Windows 7, a 2.4 GHz Intel® Core™2 Duo CPU, 2 GB of DDR2 SDRAM memory, and a 200 GB SATA-150 hard drive. The consumed times of best achievers are 1903.9, 263.54, 302.81 seconds for CBF, SCC, and MCW, respectively. Though significant
speedup can be attained by sacrificing a few percent of accuracy. For instance, using: the Minkowski (p=0.7) with the PAA (N=64) for CBF, 14.35X speedup is attained by only sacrificing 2.24% of accuracy (96.96%, 132.66secs), 59.22 times improvement in speed is achieved by Block with PAA (N=15) losing just 0.83% of accuracy in SCC (97.83%, 4.45secs), and the speed increases 38.62 times for MCW using Chebychev with DWT (1-level) while accuracy decreases 9.5% (91.5%, 7.84secs). These enormous enhancement in time consumption would be definitely tempting to not prefer the sophisticated measures in many situations because the optimal performance would be frequently a demand of speed rather than the high precision.
5. CONCLUSIONS
This article concludes that the suggested method for an optimum data mining is a technique that searches for the most proper similarity measure depending on the type of data or application, then performs dimensionality reduction on the data to gain a better accuracy and speed. In the most researches, a traditional measure has been chosen and some overrated attempts focused on adjusting feature selection. Nevertheless, the regardless designated measure has a greater impact on the overall consequence. To investigate this view, clustering problem using the nearest-neighbor approach, which is straightly subjective to the perspicuity of the applied measures, has been conducted on three synthetic datasets and a real one. The gained outcomes show that, while the features based approach improve the performance of similarity measures in clustering the datasets, the results seems to be more sensitive to the measures interpretation of data since the amount of enhancements trends are also proportional to the results on raw data.
To put it in a nutshell, the measure geometric sight should cope the data nature. For the next steps, a proper feature extraction method can enhance both the accuracy and speed. Hence, it is highly beneficial to devise a mathematical or signal processing tool which can offer an insight to geometric attributes of measures and data in higher dimensions. It would certainly assist data mining community for choosing a proper measure and dimensionality reduction technique based on the nature of application or data.
6. REFERENCES
2. Chanthaweethip, W. and Guha, S., "Temporal data mining and visualization for treatment outcome prediction in hiv patients", Procedia Computer Science, Vol. 13, No., (2012), 68-79. 3. Nejad, S.K., Seifi, F., Ahmadi, H. and Seifi, N., "Applying data
mining in prediction and classification of urban traffic", in Computer Science and Information Engineering, WRI World Congress on,. Vol. 3, (2009), 674-678.
4. Grigoras, G. and Scarlatache, F., "An assessment of the renewable energy potential using a clustering based data mining method. Case study in romania", Energy, Vol. 81, (2015), 416-429.
5. Hand, D.J., Mannila, H. and Smyth, P., "Principles of data mining, MIT press, (2001).
6. Lin, H.-Y., Liang, S.-Y., Ho, Y.-L., Lin, Y.-H. and Ma, H.-P., "Discrete-wavelet-transform-based noise removal and feature extraction for ecg signals", IRBM, Vol. 35, No. 6, (2014), 351-361.
7. Verleysen, M. and François, D., The curse of dimensionality in data mining and time series prediction, in Computational intelligence and bioinspired systems,Springer. (2005), 758-770.
8. Hassanpour, H., Mesbah, M. and Boashash, B., "Time-frequency feature extraction of newborn eeg seizure using svd-based techniques", EURASIP Journal on Applied Signal Processing, (2004), 2544-2554.
9. Mörchen, F., Time series feature extraction for data mining using DWT and DFT. Univ, (2003)
10. Darvishi, A., "Translation invariant approach for measuring similarity of signals", Journal of Advances in Computer Research, Vol. 1, No. 1, (2010), 19-27.
11. Zareiforoush, H., Minaei, S., Alizadeh, M.R. and Banakar, A., "Potential applications of computer vision in quality inspection of rice: A review", Food Engineering Reviews, (2015), 1-25. 12. de Araújo, S.A., Pessota, J.H. and Kim, H.Y., "Beans quality
inspection using correlation-based granulometry", Engineering Applications of Artificial Intelligence, Vol. 40, (2015), 84-94. 13. Wang, J.-S. and Chiang, J.-C., "A cluster validity measure with
outlier detection for support vector clustering", Systems, Man, and Cybernetics, Part B: Cybernetics, IEEE Transactions on, Vol. 38, No. 1, (2008), 78-89.
14. Park, D.-h., Lee, S.H., Song, E.-H. and Ahn, D., Similarity computation of fuzzy membership function pairs with similarity measure, in Advanced intelligent computing theories and applications. With aspects of artificial intelligence. Springer (2007), 485-492.
15. Hassanpour, H. and Mesbah, M., "Neonatal eeg seizure detection using spike signatures in the time-frequency domain", in Signal Processing and Its Applications. Proceedings. Seventh International Symposium on, IEEE. Vol. 2, (2003), 41-44.
16. Agrawal, R., Faloutsos, C. and Swami, A., "Efficient similarity search in sequence databases, Springer, (1993).
17. Hamidzadeh, J., Monsefi, R. and Yazdi, H.S., "Ddc: Distance-based decision classifier", Neural Computing and Applications, Vol. 21, No. 7, (2012), 1697-1707.
18. Hassanpour, H., Darvishi, A. and Khalili, A., "A regression-based approach for measuring similarity in discrete signals", International Journal of Electronics, Vol. 98, No. 9, (2011), 1141-1156.
19. Pedrycz, W., "Knowledge-based clustering: From data to information granules, John Wiley & Sons, (2005).
20. Keogh, E. and Ratanamahatana, C.A., "Exact indexing of dynamic time warping", Knowledge and information systems, Vol. 7, No. 3, (2005), 358-386.
21. Liao, T.W., "Clustering of time series data—a survey", Pattern recognition, Vol. 38, No. 11, (2005), 1857-1874.
22. Saito, N. and Coifman, R.R., "Local feature extraction and its applications using a library of bases", World Scientific, (1994), 25-32
23. Ghiasabadi, A., Noorossana, R. and Saghaei, A., "Identifying change point of a non-random pattern on control chart using artificial neural networks", The International Journal of Advanced Manufacturing Technology, Vol. 67, No. 5-8, (2013), 1623-1630.
24. Keogh, E., Chakrabarti, K., Pazzani, M. and Mehrotra, S., "Locally adaptive dimensionality reduction for indexing large time series databases", ACM SIGMOD Record, Vol. 30, No. 2, (2001), 151-162.
25. Agrawal, R., Gehrke, J., Gunopulos, D. and Raghavan, P., "Automatic subspace clustering of high dimensional data for data mining applications, ACM, Vol. 27, (1998).
26. Wang, Q. and Megalooikonomou, V., "A dimensionality reduction technique for efficient time series similarity analysis", Information Systems, Vol. 33, No. 1, (2008), 115-132.
27. Indyk, P., "Dimensionality reduction techniques for proximity problems", (2000), 247-268.
28. Keogh, E.J. and Pazzani, M.J., A simple dimensionality reduction technique for fast similarity search in large time series databases, in Knowledge discovery and data mining. Current issues and new applicationsSpringer.(2000), 122-133.
29. Rakthanmanon, Q.Z.G.B.T. and Keogh, E., "A novel approximation to dynamic time warping allows anytime clustering of massive time series datasets", (2012).
30. Mallat, S., "A wavelet tour of signal p rocessing, Academic P Ress, New York, Vol. 628,(1998), 573-585.
A Geometric View of Similarity Measures in Data Mining
A. Darvishi, H. Hassanpour
Faculty of Computer Engineering, University of Shahrood, Shahrood, Iran
P A P E R I N F O
Paper history: Received 08 October 2015
Received in revised form 02 December 2015 Accepted 24 December 2015
Keywords: Data Mining Feature Extraction Similarity Measures Geometric View
ديكچ ه
هعومجم زا رایعم کی طسوت تاعلاطا ذخا ،یواک هداد یلصا دوصقم لکشم .تسا رظندروم یاهدربراک یارب اه هداد زا ییا
کینکت .تسا گرزب سایقم رد اه هداد اب ییورایور ،هدمع شور دننامه یددعتم داعبا شهاک یاه
جارختسا نوگانوگ یاه
هدش هئارا لضعم نیا لح یارب هصخشم .دنا
هدیدان یلک روطب رثوم یلماع ناونع هب هتفر راکب رایعم یسدنه دید ،لاح نیا اب
هدش هتفرگ هداد هب تبسن ار دوخب صوصخم زادنا مشچ رایعم ره هک ییاجنآ زا .تسا ریسفت تسا نکمم ،تس اراد اه
هداد هب تبسن یتوافتم جارختسا یور رب بلغا نیققحم تامادقا هک یلاح رد .دنک هئارا اه
یواک هداد یارب رتهب هصخشم
یم رظن هب ،تسا هدش فوطعم هتسیاش یدربراک تایصوصخ ای و هداد تیهام یانبم رب بسانم یرایعم باختنا دسر
.دشاب رت
یب ار هلابند ود نامه رگید یرایعم هک یلاحرد ،دریگب رظن رد هباشم ار ینامز یرس ود تسا نکمم صاخ رایعم کی تهابش
ت نیا فده .دنادب تایصوصخ تیمها زاربا و یواک هداد رد هصخشم جارختسا شقن نداد ناشن :دروم ود لماش قیقح
یدنب سلاک رد فلتخم تهابش یاهرایعم ییاراک نینچمه .تساه هداد نیب طابترا صیخشت رد تهابش یاهرایعم یسدنه
یرس زا یعقاو هداد هعومجم کی و یعونصم هداد هعومجم هس ررب بلق راون ینامز یاه
هدش یس تسا .
![Figure 3. The geometry of the measures from Table 1 by constructing the points in a 3-D space having the distance: lower than 2 from [0 0 0] using a](https://thumb-us.123doks.com/thumbv2/123dok_us/221769.2016701/3.595.60.538.551.698/figure-geometry-measures-table-constructing-points-having-distance.webp)
![Figure 4.Three synthetic datasets for similarity measures evaluation: a. SCC. b. MCW=( )[ ( ) ( ( )] c](https://thumb-us.123doks.com/thumbv2/123dok_us/221769.2016701/4.595.60.536.520.672/figure-synthetic-datasets-similarity-measures-evaluation-scc-mcw.webp)