during ulcerative colitis
Alexandra Adamczyk, … , Jost Langhorst, Astrid M.
Westendorf
JCI Insight.
2017;
2(8)
:e90585.
https://doi.org/10.1172/jci.insight.90585
.
G protein–coupled receptor 15 (GPR15) was recently highlighted as a colon-homing
receptor for murine and human CD4
+T cells. The aim of this study was to explore the
functional phenotype of human GPR15
+CD4
+T cells, focusing on Tregs and effector T cells
(Teffs), and to determine whether GPR15 is the driver for the migration of T cells to the colon
during ulcerative colitis (UC). In the peripheral blood, GPR15 was expressed on Tregs and
Teffs; both GPR15
+T cell subsets produced less IFN-
g
and IL-4 but more IL-17 after
stimulation and showed a higher migration activity compared with GPR15
–CD4
+T cells. In
UC patients, GPR15 expression was increased on Tregs in the peripheral blood but not on
Teffs. Interestingly, the expression of GPR15 was significantly enhanced on colonic T cells
of UC patients in noninflamed biopsies but not in inflamed biopsies. The differential
expression of GPR15 in UC patients was accompanied by a significant reduction of
bacterial immunoregulatory metabolites in the feces. In conclusion, GPR15 expression on
CD4
+T cells is altered in UC patients, which may have implications for the development of
therapeutic approaches to target T cell trafficking to the colon.
Research Article
Gastroenterology
Immunology
Find the latest version:
Conflict of interest: The authors have declared that no conflict of interest exists.
Submitted: September 7, 2016 Accepted: March 14, 2017 Published: April 20, 2017 Reference information:
JCI Insight. 2017;2(8):e90585. https:// doi.org/10.1172/jci.insight.90585.
Differential expression of GPR15 on T cells
during ulcerative colitis
Alexandra Adamczyk,1 Daniel Gageik,1 Annika Frede,1 Eva Pastille,1 Wiebke Hansen,1 Andreas Rueffer,2 Jan Buer,1 Jürgen Büning,3 Jost Langhorst,4 and Astrid M. Westendorf1
1Institute of Medical Microbiology, University Hospital Essen, University of Duisburg-Essen, Essen, Germany. 2Enterosan, Labor L+S, Bad Bocklet-Großenbrach, Germany. 3Department of Internal Medicine I, University Hospital of Schleswig-Holstein, Lübeck, Germany. 4Center of Integrative Gastroenterology, Kliniken Essen-Mitte, Essen, Germany.
Introduction
The colonic intestine consists of a multitude of different microorganisms, which coevolved in a symbiotic relationship with the gastrointestinal immune system. With their function to digest and ferment nutrition, the microbiota contributes to its host metabolism and interferes with the host intestinal immune system (1, 2). A delicate balance between the composition of the microbiota, with its metabolites, and the host immune response is necessary for the gut mucosal homeostasis. If this symbiotic relationship is disrupted, intestinal inflammation, as it is seen in ulcerative colitis (UC), can occur. UC is characterized by a relaps-ing-remitting state of chronic inflammation of the colon. The immunological nature of the disease arises from the observation that UC is characterized by a massive infiltration of T cells into the mucosa (3, 4). Importantly, not only effector T cells (Teffs), but also Tregs, are more common in actively inflamed than in uninflamed UC mucosa, reflecting forced administration of these cells to the site of inflammation (5–7).
Although the trafficking of T cells from the circulation into the small intestine has been well described and is associated with the expression of α4β7 and CCR9, the trafficking of T cells into the colon was only recently discovered to be dependent on the expression of G protein–coupled receptor 15 (GPR15) (8–14). GPR15 is an orphan G protein–linked receptor and an HIV coreceptor with homology to other known lymphocyte-trafficking receptors, but its ligand is unknown so far (15, 16). Interestingly, it was shown that in mice the expression of GPR15 and its function as a migration molecule is restricted to Tregs, whereas in humans GPR15 was shown to be expressed on Tregs, Teffs, and memory T cells (12, 13). No difference in the suppressive capacity in vitro and in vivo was observed for murine GPR15+ and GPR15–CD4+ Tregs
(12). However, whether GPR15 expression alters the function of human CD4+ T cells or whether GPR15
expression is stable in an inflammatory environment is hitherto not clear. In the present study, we analyzed the frequency and the function of GPR15+CD4+ T cells in the peripheral blood and the colonic lamina
propria of healthy controls and UC patients.
Results
GPR15 is mainly expressed on CD4+ T cells. First, we investigated the expression of GPR15 on different cell
types in the peripheral blood of healthy donors. As expected from former human and mouse studies, GPR15
G protein–coupled receptor 15 (GPR15) was recently highlighted as a colon-homing receptor for
murine and human CD4+ T cells. The aim of this study was to explore the functional phenotype of
human GPR15+CD4+ T cells, focusing on Tregs and effector T cells (Teffs), and to determine whether
GPR15 is the driver for the migration of T cells to the colon during ulcerative colitis (UC). In the
peripheral blood, GPR15 was expressed on Tregs and Teffs; both GPR15+ T cell subsets produced less
IFN-γ and IL-4 but more IL-17 after stimulation and showed a higher migration activity compared
with GPR15–CD4+ T cells. In UC patients, GPR15 expression was increased on Tregs in the peripheral
blood but not on Teffs. Interestingly, the expression of GPR15 was significantly enhanced on colonic T cells of UC patients in noninflamed biopsies but not in inflamed biopsies. The differential expression of GPR15 in UC patients was accompanied by a significant reduction of bacterial
immunoregulatory metabolites in the feces. In conclusion, GPR15 expression on CD4+ T cells is
was mainly expressed on CD4+ T cells and was expressed to a lower extent on CD8+ T cells. However, nearly
no expression of GPR15 was detected on B cells, macrophages, and dendritic cells (Figure 1A). To investi-gate whether GPR15 expression alters the functional properties of human lymphocytes, CD4+ T cells from
the peripheral blood of healthy donors were sorted into GPR15+ and GPR15– T cells, respectively, and
stim-ulated in vitro. Although there was no difference in the proliferation of GPR15+ and GPR15–CD4+ T cells
(Figure 1B), the production of the Th1/Th2-associated cytokines IFN-γ and IL-4 was significantly decreased in the supernatant of stimulated GPR15+CD4+ T cells compared with GPR15–CD4+ T cells (Figure 1C).
In contrast, GPR15+CD4+ T cells produced significantly more IL-17 than their GPR15– counterparts. Due
to the differential cytokine production, we further focused on the CD4+ T cell subsets that express GPR15.
Interestingly, the frequency of GPR15+ cells in the peripheral blood of healthy donors was higher in the
CD4+ Treg subset than in the CD4+ Teff subset (Figure 1D). To analyze if the differential cytokine profile is
restricted to GPR15-expressing Tregs or Teffs, we compared both subsets and identified that the enhanced IL-17 and diminished Th1/Th2 secretion is a more general characteristic of GPR15-expressing CD4+ T cells
and is not unique for one specific T cell subset (Figure 1E).
GPR15 expression is upregulated on CD4+ Tregs in the peripheral blood of UC patients and enhanced in the
noninflamed colons of UC patients. Tregs have previously been described to suppress effector T cell activity in the inflamed mucosa of patients with inflammatory bowel disease (IBD), and their potential func-tional relevance has been suggested by clinical pilot studies using adoptive transfer of expanded Tregs in patients with IBD in vivo (17). Of note, GPR15 was recently described as a homing receptor of Tregs for the murine colon (12). Therefore, we examined the expression of GPR15 in the peripheral blood of patients suffering from UC. We detected a higher percentage of GPR15+CD4+ T cells in patients with
UC compared with healthy controls (Figure 2A). Interestingly, the enhanced GPR15 expression was predominant within the Treg compartment and not within the CD4+ Teff subset (Figure 2B). As
GPR15-expressing CD4+ T cells from healthy individuals show an enhanced IL-17 secretion, we analyzed the
cytokine profile of GPR15+ and GPR15–CD4+ T cells from UC patients. In line with the results from
healthy individuals, GPR15+ CD4+ T cells isolated from the blood of UC patients showed the trend of
producing less IFN-γ and IL-4 but significantly enhanced IL-17 (Figure 2C). Hence, the secretion of IL-17 seems to be very specific for GPR15-expressing CD4+ T cells.
In the subsequent experiments, we addressed the question whether the enhanced expression of GPR15 on Tregs in the peripheral blood of UC patients favors the migration of Tregs to the colon. First, we deter-mined the migration activity of GPR15+ versus GPR15–CD4+ T cells in vitro. GPR15+ and GPR15–CD4+
T cells from the peripheral blood of healthy donors were isolated by cell sorting, and an in vitro Transwell migration assay toward stromal cell–derived factor-1 (SDF-1), the standard chemokine for leukocyte migra-tion assays, was performed. Both GPR15– and GPR15+CD4+ T cells migrated through the Transwell in
response to SDF-1, but the migration activity of GPR15+CD4+ T cells was significantly higher (Figure
3A). Importantly, the migration activity of GPR15+FoxP3– T cells as well as GPR15+FoxP3+ Tregs was
enhanced compared with the GPR15– counterparts (Figure 3B).
Detailed analysis revealed that CXCR4, the receptor of SDF-1, was expressed at a significantly higher level on GPR15+ compared with GPR15–CD4+ T cells, proposing a more general enhanced migration
capacity of GPR15+CD4+ T cells (Figure 3C). As a consequence, we addressed the expression of SDF-1 in
biopsies from noninflamed and inflamed colons of patients suffering from UC. Of note, SDF-1 expression was significantly increased in the inflamed compared with the noninflamed colon (Figure 3D).
In a next step, we analyzed whether the increased expression of GPR15 on Tregs in the peripheral blood as well as the enhanced migration capacity of GPR15+ cells lead to the migration of GPR15+ T cells to the
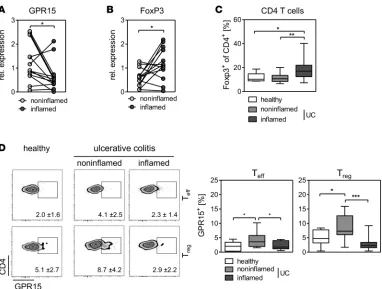
colons of UC patients. Interestingly, quantitative PCR analysis revealed that the expression of GPR15 was significantly higher in the noninflamed colon compared with the inflamed colon (Figure 4A). In contrast, the FoxP3+ expression was significantly elevated in the inflamed tissue (Figure 4B). This was also
con-firmed on cellular level, as we identified an increased percentage of FoxP3+CD4+ T cells in the inflamed
colonic tissue (Figure 4C). Of note, no differences in the expression of GATA-3, Tbet, and RORc were detected between inflamed and noninflamed colonic tissue (Supplemental Figure 1; supplemental material available online with this article; https://doi.org/10.1172/jci.insight.90585DS1). Focusing on the expres-sion of GPR15 on T cells in colonic biopsies, we observed differences in the percentages of GPR15+FoxP3+
Tregs as well as GPR15+FoxP3– Teffs. Compared with biopsies from healthy individuals, we detected an
Figure 1. GPR15 is mainly expressed on CD4+ T cells in healthy PBMCs. (A and D) PBMCs from healthy donors were isolated and stained for GPR15 expression on different cell populations: (A) CD4+ T cells, CD8+ T cells, B cells (CD19+ cells); macrophages (Mph; CD14+CD11b+), conventional dendritic
cells (cDCs; CD11c+CD123–), and plasmacytoid DCs (pDCs; CD11c–CD123+BDCA-2+) and (D) Teffs (FoxP3–) and Tregs (FoxP3+). Representative plots are
shown for each cell population, with mean expression ± SD; n = 12–15. GPR15 expression is summarized as median (horizontal lines), 25th to 75th percentile (extension of boxes), and range (error bars). (B and C) GPR15+ and GPR15–CD4+ T cells were sorted from PBMCs of healthy blood donors and
labeled with cell proliferation dye eFluor 670 and stimulated for 3 days. (B) Proliferation of GPR15+ and GPR15–CD4+ T cells was measured by the loss of
the eFluor dye. (E) CD25hiCD127loGPR15+ and GPR15–CD4+ Tregs and CD25–CD127hiGPR15+ and GPR15–CD4+ effector T cells (Teffs) were sorted from PBMCs
of healthy blood donors and stimulated for 3 days. (C and E) Content of secreted cytokines (IFN-γ, IL-4, and IL-17) in the supernatant was determined by Luminex technology. The amount of secreted cytokines was normalized to 104 cells. Data represent mean ± SEM; 7–12 samples. Statistical analysis
was diminished in the inflamed colon (Figure 4D). Similar results were also found for FoxP3–CD4+
Teffs, yet the percentage of GPR15 was much low-er compared with FoxP3+ T cells (Figure 4D). In
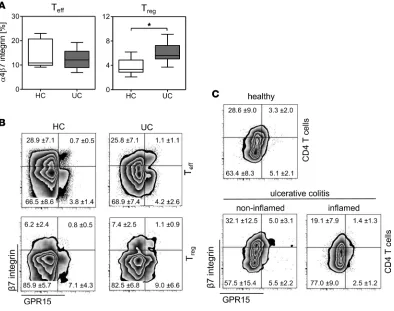
summary, these results imply that GPR15 guides the Tregs to the colons of UC patients. Additional-ly, they imply that the expression of GPR15 might be downregulated after binding to the potential ligand or within the inflamed environment or that GPR15 is not an exclusive master regulator for the migration of Tregs into the inflamed colon. A former study in a humanized mouse model by Fischer and colleagues (18) suggested that α4β7 integ-rin is crucial for homing of Tregs from UC patients into the colon. Well in line with their results, we detect-ed an increasdetect-ed expression of α4β7 integrin on Tregs from peripheral blood mononuclear cells (PBMCs) of UC patients (Figure 5A), similar to our results obtained for GPR15 expression (Figure 2B). Subsequently, we analyzed the coexpression of GPR15 and β7 integrin on CD4+ T cells in PBMCs and colonic tissues
of healthy individuals and UC patients. To our surprise, the majority of Teffs and Tregs in the peripheral blood did not coexpress GPR15 and β7 integrin, independent of the health status (Figure 5B and Supple-mental Figure 2A). Instead, GPR15 and α4β7 integrin were independently expressed on the majority of Teffs and Tregs, and this lack of coexpression was also detectable in the colonic biopsies of healthy indi-viduals and UC patients (Figure 5C). Interestingly, similar to the expression of GPR15 in colonic biopsies, the expression of α4β7 integrin alone was significantly increased on Tregs in the noninflamed biopsies of UC patients compared with biopsies from healthy individuals, and this was accompanied by a decreased expression in the inflamed colonic tissues (Supplemental Figure 2B). In summary, our results show that the phenotype of T cells, especially the Tregs, is very heterogeneous, providing evidence that there might be differences in the function and migration among α4β7+ Tregs, GRP15+ Tregs, and α4β7+ GRP15+ Tregs.
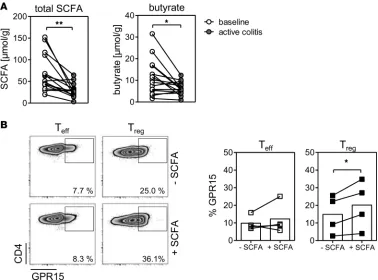
The short-chain fatty acid metabolism is significantly disturbed during UC. The gut microbiota and its metab-olites play an important role in the onset and perturbation of intestinal inflammation (2). Interestingly, short-chain fatty acids (SCFA), such as butyric acid and propionic acid, were shown to modulate T cell differentiation and the expression of GPR15, respectively, and could therefore be involved in dampening intestinal inflammation (12, 18, 19). To gain further insights into whether the downregulation of GPR15 on Tregs could be due to an alteration in the microbiota and its metabolites, we measured the SCFA in fecal samples of UC patients in remission (baseline) and active disease. Overall, total levels of SCFA were sig-nificantly lower in patients with active UC; in particular, the levels of butyrate were dramatically decreased in the feces of active UC patients compared with UC patients in remission (baseline) (Figure 6A). To analyze whether SCFA could be involved in the control of GPR15 expression, we isolated CD4+ Tregs and
CD4+ Teffs from the peripheral blood of healthy donors and stimulated these cells in the presence of SCFA
(butyrate, propionate, and acetate). Although the percentage of GPR15-expressing cells was increased
Figure 2. GPR15 expression is upregulated on CD4+
Tregs in the peripheral blood of ulcerative colitis patients. PBMCs from healthy control donors (HC) and from ulcerative colitis patients (UC) were stained for GPR15 expression on (A) CD4+ T cells and (B) FoxP3+
(Treg) and FoxP3– (Teff) CD4+ T cells. Representative
plots are shown for each cell population, with mean expression ± SD; n = 12–15. GPR15 expression is dem-onstrated as median (horizontal lines), 25th to 75th percentile (extension of boxes), and range (error bars). (C) GPR15+ and GPR15–CD4+ T cells were sorted from
UC patients and stimulated for 3 days, and cytokine secretion of IFN-γ, IL-4, and IL-17 in the supernatant was determined by Luminex technology. The amount of secreted cytokines was normalized to 104 cells. Data
on both CD4+ Teffs and CD4+ Tregs after stimulation,
the strongest enhancement of GPR15 expression was detected within the CD4+ Treg subset (Figure 6B). In
summary, these findings suggest that the gut microbiota and its metabolites, which are strongly altered during UC, play an important role in the control of GPR15 expression in the colon.
Discussion
GPR15 is an orphan G protein–coupled receptor and an HIV coreceptor with homology to other known lymphocyte-trafficking receptors, but, so far, its ligand is unknown (15, 16). Recently, GPR15 was shown to be expressed on murine and human CD4+ T cell subsets
and to be highly involved in their trafficking to the colon (12, 13). We found that GPR15 is expressed on both Tregs and Teffs in the peripheral blood of healthy vol-unteers. In addition, GPR15+CD4+ Teffs and GPR15+
Tregs produced less or no IFN-γ and IL-4 but more IL-17 after stimulation compared with GP15– CD4+ T
cells, raising functional differences between GPR15-expressing and -nonGPR15-expressing CD4+ T cells. Recent
studies show that there are similarities between Tregs and Th17 cells, especially in an inflamed environment (20, 21). Well in line with this, we identified that the dif-ferential cytokine profile of GPR15+CD4+ T cells is not
restricted to healthy individuals but is also detectable in the blood of UC patients, providing evidence that the subset of GPR15+ T cells might have proinflammatory
and antiinflammatory properties, depending on the cell type and the microenvironment.
In contrast to a former study, which stated that GPR15 is mainly expressed on Th2 cells in the colons of UC patients compared with healthy controls (13), we detected no differences in the expression of GPR15 on GATA3+ T cells when we compared inflamed and noninflamed colonic tissue of UC patients. However,
here we compared noninflamed colonic tissues with inflamed colonic tissues from UC patients and not with colonic biopsies from healthy volunteers, which could explain the differences in these results.
Interestingly, we found that, in the GPR15+CD4+ T cell subset, the expression of CXCR4, which, aside
from GPR15, is a coreceptor for HIV (22, 23), is enhanced compared with the that in GPR15–CD4+ T cell
subset. In line with this, GPR15+CD4+ T cells show higher migration activity toward SDF-1 in vitro, as
SDF-1 is the ligand for CXCR4 and is highly expressed in the inflamed colons of UC patients. Of note, GPR15 is markedly upregulated on gut CD4+ T cells in some HIV-1–infected individuals compared with
healthy controls (24), further underlining the importance of GPR15 as a colon-homing molecule.
UC is characterized by massive infiltration of Teffs and Tregs into actively inflamed mucosa (3, 4). We showed that the percentage of GPR15+CD4+ T cells is higher in the peripheral blood of patients with UC
compared with healthy controls and that the enhanced GPR15 expression was restricted to the FoxP3+
Treg compartment. In contrast, the expression of GPR15 was significantly lower in the inflamed colons compared with the noninflamed colons of UC patients, although FoxP3+ expression was significantly
ele-vated in the inflamed tissue. This raises the question of whether GPR15 is not involved in the migration of Tregs into the inflamed colon, a concept favored by Fischer and colleagues. They showed in a humanized mouse model that α4β7 integrin is important for homing of UC Tregs into the colon (18). Interestingly, we detected only a very small population of Tregs that coexpress α4β7 and GRP15 in PBMCs of healthy individuals and UC patients, providing evidence that there might be differences in function and migration among α4β7+ Tregs, GRP15+ Tregs, and α4β7+ GRP15+ Tregs.
Another explanation for the weak GPR15 expression on Tregs in the inflamed colons of UC patients could be the downregulation of GRP15 after binding to the potential ligand or within an
Figure 3. GPR15-expressing cells show higher migration capacity in vitro. (A and
B) GPR15+ and GPR15–CD4+ T cells were sorted from PBMCs of healthy donors. (A) T
cells were used for an in vitro Transwell migration assay with SDF-1 as a chemoattrac-tant. The migration index was determined as the ratio of cell migrated toward SDF-1 and cells migrated toward media alone. Data represent mean ± SEM of 4 individual experiments. (B) Migrated GPR15–CD4+ T cells and GPR15+CD4+ T cells were stained for
FoxP3, and the migration index was calculated for FoxP3– (Teffs) and FoxP3+ (Treg)
CD4+ T cells. Data represent mean ± SEM of 1 of 3 representative experiments. (C)
Expression of CXCR4 on sorted GPR15+ and GPR15–CD4+ T cells was determined by
inflamed environment. A study by Lahl and colleagues gives rise to this conclusion, as they detected GPR15 to be highly expressed on fetal thymic dendritic epidermal T cell precursors and to be down-regulated once these cells reach their site of interest (25).
The gut microbiota and its metabolites play an important role in the onset and perturbation of intesti-nal inflammation in UC. Characterization of the microbial community led to the concept of “dysbiosis,” an imbalance of beneficial and harmful bacteria. Dysbiosis in UC is characterized by an overall reduction in the microbial diversity and reduced abundance of the phylum Firmicutes as well as concurrent increas-es in Bacteroidetincreas-es (26, 27). One important activity of the phylum Firmicutincreas-es is to metabolize indigincreas-estible dietary fiber or mucus components into SCFA (28). We detected a significant reduction of SCFA in the feces of patients with active UC compared with baseline (remission), probably due to the alteration of the gut microbial composition during inflammation. In line with these results, treatment of IBD patients with SCFA was shown to be beneficial for the disease outcome (29). In addition, studies demonstrated that SCFA can induce Treg differentiation and may therefore play an important role in dampening abnormal immune responses (19, 30, 31). We and others showed that T cell activation in the presence of SCFA enhanced the expression of GPR15, preferentially on CD4+ Tregs. Therefore, the diminished production
of SCFA in the inflamed colon could explain the reduced expression of GPR15 on CD4+ Tregs in the
inflamed colons of UC patients. However, in our studies we were not able to discriminate between fecal samples from noninflamed and inflamed regions of patients with active UC. Therefore, we can only specu-late on a connection between SCFA and GPR15 expression in the inflamed colon.
In line with our findings, treatment of mice with a combination of broad-spectrum antibiotics, which also strongly disturb the microbial composition, led to a decreased expression of GPR15 in the colon (12), further suggesting that GPR15 expression can be modulated in vivo depending on the microbial
Figure 4. GPR15 expression is diminished in the inflamed tissue of UC patients. (A and B) Colonic biopsies of UC patients were isolated from mac-roscopically inflamed and noninflamed tissue. Expression of (A) GPR15 and (B) FoxP3 in the colonic tissue was determined by quantitative real-time PCR. n = 13. Statistical analysis was performed by Student’s t test (*P < 0.05). (C and D) Colonic biopsies were taken from heathy individuals and from macroscopically inflamed and noninflamed tissue of UC patients. Lymphocytes were isolated from the colonic tissue and stained for expression of (C) FoxP3 on CD4+ T cells and (D) GPR15 expression on CD4+ FoxP3– (Teffs)or CD4+FoxP3+ (Treg) T cells. Representative plots are shown for each cell
microenvironment. Furthermore, the physiological ligand of GPR15 is hitherto unknown, but identifying this ligand would allow to further elaborate the stability of GPR15 expression and to analyze whether the receptor-ligand binding has an impact on the expression of GPR15.
In conclusion, our studies show that the GPR15 expression on CD4+ T cells is altered in patients
suffer-ing from UC, and we demonstrate the modulation of GPR15 expression by bacterial metabolites. Under-standing the interplay among the microbiota, its metabolites, and the trafficking of T cells to the colon is of high relevance for the maintenance of intestinal homeostasis and for the development of novel therapies that aim at controlling intestinal inflammation. However, one important next step will be to identify the natural ligand of GPR15 in order to better define the physiological role of GPR15 in health and disease.
Methods
Patients and samples
Blood samples. Blood samples were obtained from healthy volunteers (5 male, 10 female; mean age: 37 ± 3.67 years) and from UC patients (Table 1). The diagnosis of UC was established by standard criteria. All blood donors were nonsmokers.
Biopsy specimens. Endoscopic mucosal biopsies were obtained from a total of 27 UC patients and 7 healthy volunteers (Table 1) undergoing colonoscopy. For UC patients, biopsies were taken from macroscopically inflamed or noninflamed tissues. All patients were scored by the Mayo endoscopic activity index (EI) as described previously (32). An EI ≥ 3 was set as standard for active disease. All UC patients were nonsmokers.
Figure 5. No coexpression of GPR15+ and α4β7 integrin on CD4+ T cells. (A) PBMCs from healthy control donors (HC) and from ulcerative colitis patients (UC) were stained for (A) expression of α4β7 integrin on CD25hiCD127lo (Treg) and CD25–CD127hi (Teff) CD4+ T cells and (B) coexpression of GPR15 and β7
integrin on Foxp3+ (Treg) and Foxp3– (Teff) CD4+ T cells. (A) α4β7 integrin expression is demonstrated as median (horizontal lines), 25th to 75th percentile
(extension of boxes), and range (error bars); n = 8. Statistical analysis was performed by Student’s t test (*P < 0.05). (B) Representative plots are shown for each cell population, with mean expression ± SD; n = 8. (C) Lymphocytes were isolated from the colonic tissue and stained for expression of GPR15 and
Isolation of PBMCs and colonic lymphocytes
Blood samples from UC patients and healthy donors were collected in NH4-Heparin Monovette tubes (Sarstedt). To isolate PBMCs, blood was centrifuged with Bicoll density gradient (Biochrom AG). Isolated cells were washed with PBS containing 2 mM EDTA and 2% fetal calf serum (PAA Laboratories) and stored in cell culture medium containing 10% fetal calf serum and 10% DMSO (Carl Roth GmbH) in liquid nitrogen. Colonic biopsies were obtained from healthy volunteers and UC patients undergoing colo-noscopy, and lymphocytes were isolated directly. Therefore, biopsies were smashed through a 70-μm cell strainer and washed with IMDM, after which cells were analyzed by flow cytometry.
Antibodies and flow cytometry
PBMCs and colonic lymphocytes were stained with fluorochrome-labeled anti-human CD4 (RPA-T4; ebioscience), GPR15 (FAB3654; R&D Systems), CD8 (RPA-T8; ebioscience), CD19 (HIB19; ebioscience), CD11b (ICRF44; BD), CD14 (M5E2, BD), CD11c (11C1; BioLegend), CD123 (6H6; ebioscience), BDCA2 (201A; ebioscience) α4 integrin (9F10, BioLegend), and β7 integrin (FIB504, BioLegend). Fixable Viability Dye (ebioscience) was used to stain for dead cells. Intracellular detection of FoxP3 was performed using the FoxP3 staining kit (ebioscience) and anti-human FoxP3 antibody (PCH101, ebioscience). Cells were analyzed by flow cytometry on a FACS Canto using DIVA software (both from BD Bioscience).
Proliferation assay
GPR15+ and GPR15–CD4+ T cells were sorted from PBMCs of buffy coats from healthy donors using
a FACSAria II cell sorter (BD). 0.7 × 10⁵ to 1 × 10⁵ cells (depending on the blood donor) were labeled
with cell proliferation dye eFluor 670 (ebioscience) and cultured in the presence of the Treg Suppres-sion Inspector (Miltenyi Biotec) for 3 days. All cells were cultured in IMDM with GlutaMAX (Invit-rogen) supplemented with 10% heat-inactivated fetal calf serum (PAA Laboratories), 25 mM HEPES
(Biochrom), 100 U/ml penicillin (Sigma-Aldrich), and 0.1 mg/ml streptomycin (Sigma-Aldrich). Pro-liferation was assessed by the loss of the fluorescent dye and measured by flow cytometry on a FACS Canto using DIVA software. Supernatant was collected for the detection of secreted cytokines.
Cytokine detection
GPR15+ and GPR15–CD4+ T cells were sorted from PBMCs of UC patients and healthy volunteers;
CD25hiCD127loGPR15+ or GPR15–CD4+ Tregs, CD25–CD127hiGPR15+ or GPR15–CD4+ Teffs were sorted
from PBMCs of buffy coats from healthy donors using a FACSAria II cell sorter. 1 × 10⁴ to 10 × 104 cells
(depending on the blood donor) were cultured in the presence of the Treg Suppression Inspector for 3 days. Supernatant was collected, and cytokine production was quantified using the polystyrene bead-based Luminex Assay (R&D Systems) and was performed according to the manufacturer’s instructions. The assay was run on a Luminex 200 instrument (Luminex Corporation).
In vitro migration assay
Sorted CD4+GPR15– and CD4+GPR15+ T cells of healthy blood donors were subjected to a migration
assay using Transwell chambers (Corning). SDF-1 (50 ng/ml; R&D Systems) was diluted in cell culture media and added to the bottom chamber of the Transwell plates. 5 × 10⁵ GPR15– cells or GPR15+ cells,
respectively, were added to the upper Transwell insert and incubated for 4 hours at 37°C, after which the cells were collected from the lower chamber and counted. The migration index was determined as the ratio of migrated cells toward SDF-1 in comparison to cell migrated to media alone. Migrated GPR15–CD4+ T
cells and GPR15+CD4+ T cells were stained for FoxP3, and the migration index was calculated for FoxP3–
and FoxP3+CD4+ T cells, respectively.
RNA isolation and quantitative real-time PCR
RNA was obtained from colon biopsies using the RNeasy Fibrous Tissue Kit (Qiagen). Following DNase digestion (Qiagen), cDNA was synthesized with M-MLV Reverse Transcriptase (Promega) and OligodT mixed with Random Hexamer primers (Invitrogen). Real-time RT-PCR was performed using the SYBR Green PCR kit (Fermentas/Thermo Fisher Scientific) and specific primers for GPR15 (5′ CCATTGT-GTGGCCAGTCGTA; 3′ GAAGAGTAGGCAACCCCAGC), FoxP3 (5′ GAACGCCATCCGCCA-CAACCTGA; 3′ CCCTGCCCCCACCACCTCTGC), CXCR4 (5′ GCCTTATCCTGCCTGGTATTGTC; 3′ GCGAAGAAAGCCAGGATGAGGAT), SDF-1 (5′ GTGAGGCCAGGGCAGAGTGAGACC; 3′
CTTTTGCGGGGCCATGGAGACAGT), GATA3 (5′ GCATCCAGACCAGAAACCGAAAAA; 3′
GCATGTGGCTGGAGTGGCTGAAG), Tbet (5′ GATGTTTGTGGACGTGGTCTTG; 3′ CTTTCCA-CACTGCACCCACTT), RORc (5′ CTGGGCATGTCCCGAGATG; 3′ GAGGGGTCTTGACCACTGG), and RPS9 (5′ CGCAGGCGCAGACGGTGGAAGC; 3′ CGAAGGGTCTCCGCGGGGTCACAT) on an ABI PRISM cycler (Applied Biosystems, Life Technologies). Relative RNA levels were determined with included standard curves for each individual gene and further normalization to the housekeeping gene RPS9.
Table 1. Sociodemographic characteristics of the study sample
PBMCs (n = 14) Colonic biopsies
(healthy volunteers) (n = 8) (UC patients) (n = 27)Colonic biopsies Fecal samples (n = 16)
Age: mean ± SD (yr) 35.40 ± 14.97 47.38 ± 14.00 43.87 ± 16.94 43.19 ± 10.90
Sex: f/m 8/6 6/2 13/14 10/6
Ulcerative colitis 14 0 27 16
Time since diagnosis:
mean ± SD, yr 5.79 ± 7.90 – 9.94 ± 8.73 11.69 ± 8.83 Medication (n)
5-ASAA 6 – 19 18
CorticosteroidsB 2 – 4 0
ThiopurineC 2 – 5 0
BiologicsD 3 – 2 0
Measurement of fecal SCFA levels
Fecal samples from UC patients (Table 1) were analyzed for SCFA by gas chromatography. For this, feces were suspended in saline solution. After homogenization and centrifugation, the supernatants were intensely mixed with saline and diethyl ether and spiked with methylacrylate. After freezing of the mixture for at least 6 hours at –25°C, the organic phase was isolated and analyzed. This was performed with a Shi-madzu GC-2010 Plus gas chromatograph fitted with a 25 m × 0.20 mm i. d. PEG column (BP 21, SEG) and a flame ionization detector. Ultra-high-purity helium was used as carrier gas.
Induction of GPR15 by SCFA in vitro
Tregs and Teffs were purified from PBMCs of healthy blood donors using the CD4+ CD25+ Regulatory T Cell
Isolation Kit (Miltenyi Biotec) according to the manufacturer’s instructions. Isolated cells were stimulated with Treg Suppression Inspector beads (Miltenyi Biotec) in the presence or absence of a mixture of SCFA (0.25 mM butyrate, 1 mM propionate, 0.5 mM acetate; all from Carl Roth) and cultured for 3 days. The expression of GPR15 on stimulated cells was assessed by flow cytometry on a FACS Canto using DIVA software.
Statistics
All results are expressed as mean ± SEM. Differences between 2 groups were assessed by 2-tailed Stu-dent’s t test. For multiple comparison analysis, statistical analysis was performed using 1-way ANOVA fol-lowed by Tukey’s post-hoc multiple comparison test. Data analysis was performed with Prism 5.0 software (GraphPad). Statistical significance was set at the level of P < 0.05.
Study approval
Informed consent was obtained from all patients. Ethical approval was provided by the Medical Faculty of the University of Luebeck (02-073,03-043) for UC blood samples and by the Faculty of the University of Duisburg-Essen (15-6183-BO) for the biopsy specimens, respectively. Buffy coats of healthy adult blood donors were obtained from the Institute of Transfusion Medicine and approved by the internal review board of the University Hospital Essen.
Author contributions
AA and DG designed, planned, and performed the experiments and analyzed data. AF, EP, and AR per-formed the experiments and analyzed data. AA, JB, and WH were involved in the discussion of data and drafting of the manuscript. JB and JL provided samples and discussed data. AMW initiated, organized, and designed the study; wrote the paper; and completed the manuscript.
Acknowledgments
The authors acknowledge Christian Fehring, Mechthild Hemmler-Roloff, and Witold Bartosik for excellent technical assistance. We are thankful to Daniela Catrini for the critical reading of the manuscript. This work was supported by funding from the Deutsche Forschungsgemeinschaft (GRK1949/1 to WH, JB, and AMW).
Address correspondence to: Astrid M. Westendorf, Infection Immunology, Institute of Medical Microbiol-ogy, University Hospital Essen, Hufelandstr. 55, 45122 Essen, Germany. Phone: 492017231826; E-mail: astrid.westendorf@uk-essen.de.
1. Belkaid Y, Hand TW. Role of the microbiota in immunity and inflammation. Cell. 2014;157(1):121–141.
2. Round JL, Mazmanian SK. The gut microbiota shapes intestinal immune responses during health and disease. Nat Rev Immu-nol. 2009;9(5):313–323.
3. Wadwa M, et al. IL-10 downregulates CXCR3 expression on Th1 cells and interferes with their migration to intestinal inflam-matory sites. Mucosal Immunol. 2016;9(5):1263–1277.
4. Buckner JH. Mechanisms of impaired regulation by CD4(+)CD25(+)FOXP3(+) regulatory T cells in human autoimmune dis-eases. Nat Rev Immunol. 2010;10(12):849–859.
5. Makita S, et al. CD4+CD25bright T cells in human intestinal lamina propria as regulatory cells. J Immunol. 2004;173(5):3119–3130. 6. Maul J, et al. Peripheral and intestinal regulatory CD4+ CD25(high) T cells in inflammatory bowel disease. Gastroenterology.
2005;128(7):1868–1878.
8. Berlin C, et al. Alpha 4 beta 7 integrin mediates lymphocyte binding to the mucosal vascular addressin MAdCAM-1. Cell. 1993;74(1):185–195.
9. Papadakis KA, et al. The role of thymus-expressed chemokine and its receptor CCR9 on lymphocytes in the regional specializa-tion of the mucosal immune system. J Immunol. 2000;165(9):5069–5076.
10. Stenstad H, et al. Gut-associated lymphoid tissue-primed CD4+ T cells display CCR9-dependent and -independent homing to the small intestine. Blood. 2006;107(9):3447–3454.
11. Agace W. Generation of gut-homing T cells and their localization to the small intestinal mucosa. Immunol Lett. 2010;128(1):21–23. 12. Kim SV, et al. GPR15-mediated homing controls immune homeostasis in the large intestine mucosa. Science.
2013;340(6139):1456–1459.
13. Nguyen LP, et al. Role and species-specific expression of colon T cell homing receptor GPR15 in colitis. Nat Immunol. 2015;16(2):207–213.
14. Habtezion A, Nguyen LP, Hadeiba H, Butcher EC. Leukocyte trafficking to the small intestine and colon. Gastroenterology. 2016;150(2):340–354.
15. Joost P, Methner A. Phylogenetic analysis of 277 human G-protein-coupled receptors as a tool for the prediction of orphan receptor ligands. Genome Biol. 2002;3(11):RESEARCH0063.
16. Deng HK, Unutmaz D, KewalRamani VN, Littman DR. Expression cloning of new receptors used by simian and human immunodeficiency viruses. Nature. 1997;388(6639):296–300.
17. Desreumaux P, et al. Safety and efficacy of antigen-specific regulatory T-cell therapy for patients with refractory Crohn’s dis-ease. Gastroenterology. 2012;143(5):1207–17.e1.
18. Fischer A, et al. Differential effects of α4β7 and GPR15 on homing of effector and regulatory T cells from patients with UC to the inflamed gut in vivo. Gut. 2016;65(10):1642–1664.
19. Smith PM, et al. The microbial metabolites, short-chain fatty acids, regulate colonic Treg cell homeostasis. Science. 2013;341(6145):569–573.
20. Yang BH, et al. Foxp3(+) T cells expressing RORγt represent a stable regulatory T-cell effector lineage with enhanced suppres-sive capacity during intestinal inflammation. Mucosal Immunol. 2016;9(2):444–457.
21. Beriou G, et al. IL-17-producing human peripheral regulatory T cells retain suppressive function. Blood. 2009;113(18):4240–4249.
22. Deng H, et al. Identification of a major co-receptor for primary isolates of HIV-1. Nature. 1996;381(6584):661–666. 23. Blaak H, Boers PH, Gruters RA, Schuitemaker H, van der Ende ME, Osterhaus AD. CCR5, GPR15, and CXCR6 are major
coreceptors of human immunodeficiency virus type 2 variants isolated from individuals with and without plasma viremia. J Virol. 2005;79(3):1686–1700.
24. Kiene M, et al. Toll-like receptor 3 signalling up-regulates expression of the HIV co-receptor G-protein coupled receptor 15 on human CD4+ T cells. PLoS One. 2014;9(2):e88195.
25. Lahl K, Sweere J, Pan J, Butcher E. Orphan chemoattractant receptor GPR15 mediates dendritic epidermal T-cell recruitment to the skin. Eur J Immunol. 2014;44(9):2577–2581.
26. Walker AW, et al. High-throughput clone library analysis of the mucosa-associated microbiota reveals dysbiosis and differences between inflamed and non-inflamed regions of the intestine in inflammatory bowel disease. BMC Microbiol. 2011;11:7. 27. Machiels K, et al. A decrease of the butyrate-producing species Roseburia hominis and Faecalibacterium prausnitzii defines
dysbiosis in patients with ulcerative colitis. Gut. 2014;63(8):1275–1283.
28. Duncan SH, Aminov RI, Scott KP, Louis P, Stanton TB, Flint HJ. Proposal of Roseburia faecis sp. nov., Roseburia hominis sp. nov. and Roseburia inulinivorans sp. nov., based on isolates from human faeces. Int J Syst Evol Microbiol. 2006;56(Pt 10):2437–2441.
29. Harig JM, Soergel KH, Komorowski RA, Wood CM. Treatment of diversion colitis with short-chain-fatty acid irrigation. N Engl J Med. 1989;320(1):23–28.
30. Furusawa Y, et al. Commensal microbe-derived butyrate induces the differentiation of colonic regulatory T cells. Nature. 2013;504(7480):446–450.
31. Maslowski KM, et al. Regulation of inflammatory responses by gut microbiota and chemoattractant receptor GPR43. Nature. 2009;461(7268):1282–1286.