Please cite this article as: L. Feng, L. Lin, Comparative Analysis of Image Denoising Methods Based on Wavelet Transform and Threshold Functions, International Journal of Engineering (IJE), TRANSACTIONS B: Applications Vol. 30, No. 2, (February 2017) 199-206
International Journal of Engineering
J o u r n a l H o m e p a g e : w w w . i j e . i r
Comparative Analysis of Image Denoising Methods Based on Wavelet Transform
and Threshold Functions
L. Feng*, L. Lin
Weihai Vocational College, Weihai, P. R. China
P A P E R I N F O
Paper history: Received 21 October 2016
Received in revised form 07 February 2017 Accepted 09 February 2017
Keywords: Image Denoising Wavelet Transform Threshold Function Gaussian Mixture Model
A B S T R A C T
There are many unavoidable noise interferences in image acquisition and transmission. To make it better for subsequent processing, the noise in the image should be removed in advance. There are many kinds of image noises, mainly including salt and pepper noise and Gaussian noise. This paper focuses on the research of the Gaussian noise removal. It introduces many wavelet threshold denoising algorithms which include global threshold denoising, Maxmin threshold denoising, and BayesShrink threshold denoising. We emphatically analyze the strengths and weaknesses of different denoising methods based on different threshold functions. Besides, we make a comparative analysis for these denoising methods. The experimental result shows that the wavelet images denoising algorithm based on Gaussian mixture model is better than that of the global threshold and Maxmin threshold, and also slightly better than BayesShrink threshold.
doi: 10.5829/idosi.ije.2017.30.02b.06
1. INTRODUCTION1
In conventional methods of denoising, the image polluted by noise is filtered by some kind of filter. Though it is simple, certain limitations exist. In particular, the conventional linear filtering method has the contradiction between local image feature protection and noise suppression. Some important works about image denoising were collected, and made it convenient for researchers to choose [1]. Nowadays, the denoising methods can be commonly divided into three categories which include the modulus maxima denoising method, the correlation denoising method, and the wavelet threshold denoising method [2]. Compared to the other two methods, wavelet threshold denoising method proposed by Donoho and Johnstone [3] is simpler to calculate, and the noise can be suppressed to a large extent. At the same time, singular information of the original signal can be preserved well, so it is a simple and effective method. The fundamental task of wavelet denoising is to effectively separate the image wavelet coefficients and the noise wavelet coefficients in the wavelet domain [4]. Yaseen et al. [5] compared image
1*Corresponding Author’s Email:[email protected] (L. Feng)
denoising techniques based on wavelet-transforms. The results showed that, while the threshold level was appropriate, the dual-tree complex wavelet transform (DT-CWT) was better than 2-D DWT.
filtering methods without obviously increasing computational task. In literature [11], Zhu et al. proposed an improved image denoising method based on multi-wavelet transform. This method can choose the appropriate threshold adaptively according to the different subbands, different directions and image decomposition scales. Compared with the wavelet denoising and the traditional Multi-wavelet denoising, it achieves better denoising effect. Om and Biswas [12] proposed an improved image denoising method based on wavelet thresholding. In their method, a threshold as well as neighboring window size for every subband is determined using its lengths. Experimental results show that this method performs better for all noise levels and for all window sizes under consideration for PSNR value and visual quality of the denoised image than Visushrink, NeighShrink and modified NeighShrink for all window sizes and almost all noise levels. Srivastava et al. [13] proposed a new method for image denoising using wavelet, it increases the signal-to-noise ratio (SNR) and the computation is more faster than before. However, the number of scans are limited. In reference [14], the image denoising method using DTCWT and block thresholding scheme was introduced. In literature [15], Bayes shrink (BS) was used in image denoising processing, while the image was decomposed by the discrete wavelet transform (DWT). Although these methods achieve good performance using different threshold functions, there are still some kinds of limitation which need to be solved in the future.
The wavelet threshold denoising method has two important factors, which affect the filtering performance significantly. One is threshold and the other important factor is the selection of the threshold function [16]. To study the effects of different threshold functions on the denoising performance, a comparative analysis for threshold denoising methods based on wavelet transform is presented. Firstly, we introduce the theory and application of the wavelet transform in threshold denoising methods. Then we emphatically analyze the filtering effect of different denoising methods based on different threshold functions. Finally, to test the performance of these methods, several experiments are conducted. By comparison, we can draw the conclusion that the filtering effect by using Gaussian mixture model is better than the global threshold and Maxmin threshold, and it is also slightly better than BayesShrink threshold in subjectively and objectively. Apart from the above methods based on wavelet transform, many methods based on other transforms for image denoising have been proposed in recent years. Ehsaeyan proposed two efficient image denoising methods based on contourlet transform [17] and curvelet transform [18].
The rest of this paper is organized as follows. Section 2 introduces the basic theory of the wavelet denoising method. Section 3 introduces the image threshold denoising methods based on wavelet
transform. Experimental results and performance analysis are presented in Section 4. Conclusions are given finally in Section 5.
2. BASIC PRINCIPLE OF WAVELET DENOISING
2. 1. Wavelet Transform for Images The basic
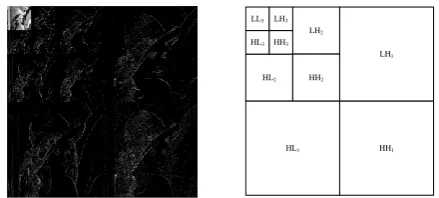
idea of wavelet transform for image analysis is multi-resolution decomposition of the image. The image is divided into different spaces and different frequency sub-images. Figure 1 shows the result of the three level wavelet decomposition of Lena image using wavelet “db1”. In Figure 1, HL3, HL2, and HL1 are horizontal detail coefficients; LH3, LH2, and LH1 are vertical detail coefficients; HH3, HH2, and HH1 are diagonal detail coefficients. Horizontal, vertical and diagonal detail coefficients are collectively referred to as the high-frequency sub-images. LL3 is the low frequency information in the original image, which is the approximate representation of the image.
2. 2. Principle of Wavelet Denoising Wavelet
transform has multi-resolution domain characteristics in time-frequency. Therefore, it can make local analysis in the time-frequency domain and extract local signal singularity feature simultaneously. By using wavelet transform, the noise in the image can be filtered out efficiently and the high frequency information can be preserved well at the same time. In this way, we can obtain the restored image with better image quality from the noisy image.
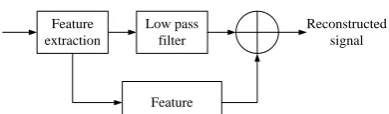
In signal processing, wavelet denoising is a signal filter problem. Though it can be seen as a low-pass filter to a large extent, wavelet denoising can achieve better filtering performance than conventional low-pass filters. The reason is that it can well retain the image characteristics after denoising. Therefore, wavelet denoising actually is an integration of feature extraction and low-pass filter. Its block diagram is shown as Figure 2. The hypothetical model of the image corrupted by Gaussian noise can be expressed as:
, 1,2, ,
i i i
y x n i M, (1)
HL2 LH2
HH2
LH1
HL1 HH1
HL3 HH3
LL3 LH3
Feature extraction
Low pass filter
Reconstructed signal
Feature
Figure 2. The schematic diagram of wavelet denoising
where ni is Gaussian white noise with zero-mean and
variance , xi is desired signal, and yi is observations.
The process of noise removal can be seen as the recovery of xi from the observed value yi. Suppose that the transform matrix of the discrete wavelet transform is W, Equation (2) shows the wavelet decomposition result of Equation (1).
[ ]i [ ]i [ ]i
W y W x W n . (2)
It is known from the characteristics of wavelet transform that the wavelet transform of Gaussian noise is still in Gaussian distribution. It is evenly distributed in various parts of the frequency scale space. Besides, because the signal is band-limited, the wavelet transform coefficients are only concentrated in the finite parts of the frequency scale space. On the contrary, the noise energy is distributed on all the wavelet coefficients. From above analysis, it can be observed that signal energy is only distributed on a small part of the wavelet coefficients. So we can use this property to filter the noise while remaining the image information.
3. IMAGE THRESHOLD DENOISING METHODS BASED ON WAVELET TRANSFORM
Donoho and Johnstone [3] proposed wavelet threshold shrinkage denoising method in 1994. After that, wavelet threshold denoising method has been widely used due to its simple calculation and promising effect. The key step in threshold denoising method based on wavelet transform is to process the decomposed wavelet coefficients by setting a threshold. Then, we get estimated wavelet coefficients. There are two basic problems in this step: threshold determination and the selection of threshold function, which are also the hotspots in this method.
3. 1. The Principle of Wavelet Threshold
Denoising The first wavelet denoising method is
wavelet threshold denoising method, which is a simple and good denoising method. The larger magnitude wavelet coefficients contain the energy of image which are mostly concentrated in high frequency. The energy of noise corresponds to the smaller magnitude wavelet coefficients that are scattered in all the wavelet coefficients. According to this feature, a threshold should be set. If the wavelet coefficient is larger than the threshold, the main component of the wavelet
coefficients is regarded as the useful signal which should be retained. If the wavelet coefficient is smaller than the threshold, the main component of the wavelet coefficients might be polluted by noise which should be eliminated. In this way, it can achieve the purpose of denoising. The key step of wavelet threshold denoising is how to select and process the threshold.
3. 2. Selection of Threshold Function The
different strategies and different estimation methods for the wavelet coefficients are determined by threshold function. The two commonly used threshold functions are hard threshold function and soft threshold function [6]. Suppose that wi j, is the wavelet coefficient, wˆi j, is the wavelet coefficient processed by the threshold function, and is the threshold, these two kinds of threshold function can be expressed as follows.
(1) Hard threshold function
The hard threshold function can only retain larger wavelet coefficients and set the smaller wavelet coefficients to zero, which can be given by Equation (3):
, , ,
,
, , ˆ
0, .
i j i j
i j
i j
w w
w
w
(3)
(2) Soft threshold function
The soft threshold can also set the smaller coefficients to zero. But the larger coefficients are constricted to zero, which can be defined as:
, , , ,
,
sign( )( ), , ˆ
0, ,
i j i j i j
i j
i j
w w w
w
w
(4)
where sign() is a sign function. Figure 3 shows the hard threshold function and soft threshold function where the abscissa represents the original wavelet coefficients of signal while Y-axis indicates the wavelet coefficients after thresholding process.
In hard threshold algorithm, the absolute values of the wavelet coefficient which are smaller than the threshold are set to zero, while the absolute values which are larger than the threshold are reserved without any process.
,
ˆi j
w
wi j,
(a)
,
ˆi j
w
, i j
w
(b)
Hard threshold method can well preserve the local features of the image, such as edges, direction information, and so on. This is not easy to achieve in the mathematical treatment because its systolic function is not continuous. At the same time, a lot of artificial noise points will be produced at image edges leading to image distortion, like ringing effect or pseudo-Gibbs effect.
Instead of retaining the wavelet coefficients whose values are larger than the threshold, the soft threshold algorithm makes shrinkage treatment to reduce these coefficients. Since the soft threshold is a continuous function, it can well overcome the shortcomings in hard threshold algorithm. So the processed results are relatively smooth. However, the wavelet coefficients with large absolute values are decreased, which causes some losses of high frequency information.
3. 3.Estimation of Threshold The estimation of
the threshold is another important factor in wavelet threshold denoising method. If the threshold value is too small, the image still has many noises after denoising. If the threshold value is too large, the important features of the image would be filtered out. At present, global threshold and local threshold are two main thresholds used in denoising methods. Compared with global threshold, local threshold is more flexible, because the threshold is determined by surrounding circumstances of the current coefficient.
(1) VisuShrink
For the selection of threshold value, the larger the noise is, the larger the threshold for wavelet coefficients will be. Most threshold selection processes are based on a group of wavelet coefficients. According to the statistical characteristics of this group, Donoho [19] proposed a threshold selection method where a threshold value is calculated. It is proved that the threshold is proportional to the variance of the noise which can be given by Equation (5):
2ln
n m
, (5)
where n is the standard deviation of the noise, and m
is the number of sampling points. In practical application, the standard deviation of the noise is unknown which needs to be estimated. Since the noise is mainly concentrated in the HH1 subband with the smallest scale, HH subband wavelet coefficients can be used to estimate the standard deviation of the noise, which is given in Equation (6):
, , 1
ˆn Median w( j k) / 0.6745, wj k HH
. (6)
(2) Minimax
Minimax is an improvement of global threshold, which adopts fixed threshold to obtain the minimax characteristics in desired process. The denoising signal can be supposed as the estimate of the unknown
regression function. So the Minimax estimate is used to get the optional minimum value among the maximum mean square errors in the worst case. For decomposition level with less sampling points, the threshold is set to zero. In the other words, no threshold process is made. The threshold is calculated as Equation (7), where n is
the standard deviation of the noise, and m is the number of sampling points.
2
0, 32, (0.3936 0.1829log ), 32.
n
m
m m
(7)
(3) BayesShrink threshold
Based on the characteristics of wavelet coefficients in natural image, Chang et al. [20] proposed BayesShrink threshold estimation method in 2000. This method is proposed based on the hypothesis that the wavelet coefficients of the non-noise image are in the generalized Gaussian distribution. In fact, according to statistical observation, most wavelet coefficients in natural images except LL are symmetrically distributed around zero. The peak can be obtained at the location of zero. Therefore, it can be described as generalized Gaussian distribution (GGD) with zero mean. At the same time, BayesShrink method is obtained under Bayes criterion.
In the assumption that wavelet coefficients are in the generalized Gaussian distribution, the appropriate threshold formula can be obtained based on Bayesian estimation criteria, which is expressed as:
2
Bayes=ˆn/ ˆx
, (8)
where ˆn is calculated by Equation (6), and ˆx is estimated using the wavelet coefficients in each subband. ˆx can be obtained by Equations (9) and (10):
2 2
ˆx max(ˆy ˆn,0)
, (9)
2 , 2
, 1
1
ˆy n j k
j k w n
, (10)where 2
n is the size of the subband under consideration.
For the fixed original image, it can be seen that the threshold increases when the noise variance increases. Therefore, it can remove more noise. When the noise variance decreases, the threshold decreases. By this way, it can retain more wavelet coefficients.
3. 4.Wavelet Threshold Denoising Method Based
on Gaussian Mixture Model Numerous studies
sides of zero. Generalized Gaussian distribution is a kind of a priori model which is often used. BayesShrink threshold denoising method is achieved by modeling the wavelet coefficients as generalized Gaussian distribution. Another popular model is Gaussian mixture distribution (GMM). Chipman et al. [21] got the subband adaptive Bayesian shrinkage function by using two normal distributions with zero-means and different variances to model the coefficients of one-dimensional signal.
Hou et al. [22] proposed a Gaussian mixture model which can be adaptive adjustment with different pixels. The model has good spatial adaptability because it can classify the wavelet coefficients and estimate model parameters by classification of information in neighbor window.
(1) Gaussian mixture model for image wavelet coefficients
In Gaussian mixture model, each probability density function of the coefficients is regarded as the sum of two normal distributions with zero-means and different variances. For two dimensional image signals, Equation (11) shows the model of noisy image:
[ , ] [ , ] [ , ]
Y i j X i j N i j , (11)
where Y i j[ , ] represents the wavelet coefficients of the observed noisy image, X i j[ , ] is the wavelet coefficients of original image, and N i j[ , ] is the wavelet coefficients of noise. Based on this analysis, we can get Equation (12):
1 0
2 2
[ , ] ~ [ , ] (0, ) (1 [ , ]) (0, )
X i j P i j N P i j N , (12)
where 2
0
(0, )
N and 2
1
(0, )
N are two normal
distributions with zero-means and different variances
2 1
and 2
0
, and P i j[ , ] is the probability of the smaller variance. Each parameter in coefficients can be adaptively adjusted according to different pixels. (2) Parameter estimation
To get the parameters which can be adaptively adjusted according to different pixels, the wavelet coefficients are classified using BayesShrink threshold
Bayes
in Equation (8). The binary mask M of the subband is defined as Equation (13). According to the corresponding mask values, the coefficients can be divided into two categories:
Bayes
1, [ , ] , [ , ]
0, otherwise.
Y i j
M i j
(13)
Coefficients in the wavelet subbands have local spatial clustering. The statistical properties of a coefficient can be seen as a function of its neighborhood coefficients. The values of 2
1
, 2 0
, X i j[ , ] and P i j[ , ] can be estimated by the classified coefficients in the neighborhood of N i j[ , ]. Since that the coefficient
whose mask value is 1 is relatively large, the proportion of these large coefficients in N i j[ , ] is clearly a simple but effective estimation of P i j[ , ]. P i jˆ[ , ], the estimation of P i j[ , ], can be calculated by Equation (14):
, [ , ] 1
0 0
[ , ] [ , ]
ˆ[ , ]
[ , ] [ , ]
k l N i j M k l N i j
P i j
N i j N i j
, (14)where N i j0[ , ] and N i j1[ , ] are the set of coefficients
whose corresponding mask values are 0 and 1 in the neighborhood, respectively. The estimation of large variance 2
1
can be obtained by the coefficients whose mask values are 1 in N i j[ , ]. Its estimation 1
2
ˆ
is given by Equation (15):
1 1 2 2 , [ , ] 1 1
ˆ max [ , ] ,0
[ , ]k l N i j n Y k l N i j
. (15)Similarly, the estimation of the smaller variance 2 0
can be obtained using the coefficients whose mask values are 0 in N i j[ , ]. The estimated value 2
0
ˆ
can be expressed as: 0 2 2 0 , [ , ] 0 1
ˆ max [ , ] ,0
[ , ]k l N i j n Y k l N i j
. (16)If the noise is Gaussian noise and the wavelet coefficients of the image to be estimated are also Gaussian distribution, the Bayesian estimation technique can be adopted to get the estimator of the signal, which is given in Equation (17):
2 2 2
ˆ [ , ] s [ , ]
s n
X i j Y i j
, (17)
where 2
s
is the variance of signal, and 2
n
is the variance of noise. For the image wavelet coefficients in Gaussian mixture model, we can use Equation (18) to get its estimate.
2 2
1 0
2 2 2 2
1 0
ˆ ˆ
ˆ[ , ] ˆ[ , ] (1 ˆ[ , ]) [ , ]
ˆ ˆn ˆ ˆn
X i j P i j P i j Y i j
. (18)
4. EXPERIMENTAL RESULTS AND ANALYSIS
wavelet transform. In addition, a comprehensive comparison is made to evaluate the denoising algorithms with different threshold functions including global VisuShrink soft threshold method, Maxmin threshold method, BayesShrink threshold method, and GMM.
Tables 1 and 2 show the PSNR values of Lena image and Barbara image filtered by various filtering algorithms at different Gaussian noise intensities. From Table 1 and Table 2, it can be observed that the PSNR are all increased after filtering. Among these algorithms, the denoising method using global threshold has the lowest PSNR after filtering under different noise intensities. The algorithms using Gaussian mixture model and the BayesShrink threshold algorithm have comparatively close filtering effect. But the latter has better denoising effect, which is more obvious in the Barbara image with rich texture details.
To evaluate the subjective effect of these denoising methods, Figures 4 and 5 show the denoising Lena images and Barbara images.
TABLE 1. PSNR values of Lena image filtered by various filtering algorithms at different Gaussian noise intensities
Gaussian noise intensity
Noisy image
Global threshold
Minimax threshold
BayesShrin k threshold
GMM algorithm
0.01 20.05 27.23 27.88 29.24 29.75 0.02 17.21 26.15 26.587 27.74 27.97 0.03 15.57 25.47 25.82 26.82 26.88 0.04 14.48 24.99 25.16 26.18 26.06
TABLE 2. PSNR values of Barbara image filtered by various filtering algorithms at different Gaussian noise intensities
Gaussia n noise intensity
Noisy image
Global threshold
Minimax threshold
BayesShrink threshold
GMM algorithm
0.01 20.13 23.26 24.13 26.04 27.37 0.02 17.31 22.54 22.93 24.40 25.55 0.03 15.72 22.23 22.47 23.58 24.48 0.04 14.60 21.93 22.07 22.98 23.78
(a) (b)
(c) (d)
(e) (f)
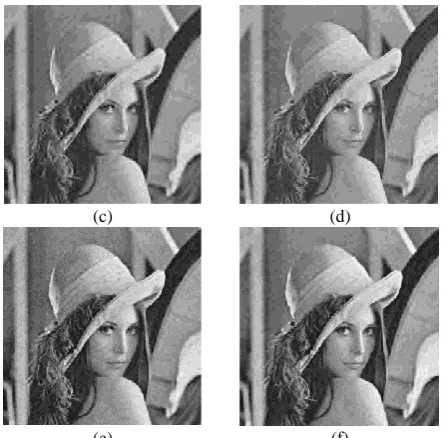
Figure 4. Denoising comparison of Lena images: (a) Original image, (b) Noisy image, (c) Global threshold denoising, (d) Maxmin threshold denoising, (e) BayesShrink threshold denoising, and (f) GMM
(a) (b)
(c) (d)
(e) (f)
Firstly, we add Gaussian noise with zero-mean and intensity 0.02 to the original image, and then filter the noisy image by different denoising methods mentioned above.
From the comparison among the filtering results of different denoising methods using different threshold functions, we can see that the images become blurred after global threshold denoising. The image texture details are well preserved using wavelet denoising method based on Gaussian mixture model.
By comparison, it is observed that the effect using Gaussian mixture model is better than the global threshold and Maxmin threshold, and slightly better than BayesShrink threshold. In the Barbara image which has more texture details, the comparison is more obvious. At last, we would like to point out that for other test images, similar results can be obtained.
5. CONCLUSION
In this paper, a comparative analysis for threshold denoising methods based on wavelet transform is presented. Firstly, we introduce the theory and application of the wavelet transform in threshold denoising methods. Then we emphatically analyze the strengths and weaknesses of different denoising methods based on different threshold functions. Finally, we make comparisons for these methods with different threshold functions in subjectively and objectively. By comparison, we can draw the conclusion that the filtering effect using Gaussian mixture model is better than that of the global threshold and Maxmin threshold, and also slightly better than BayesShrink threshold.
6. REFERENCES
1. Jain, P. and Tyagi, V., "A survey of edge-preserving image denoising methods", Information Systems Frontiers, Vol. 18, No. 1, (2016), 159-170.
2. Sanam, T.F. and Shahnaz, C., "A semisoft thresholding method based on teager energy operation on wavelet packet coefficients for enhancing noisy speech", EURASIP Journal on Audio, Speech, and Music Processing, Vol. 2013, No. 1, (2013), 1-5. 3. Donoho, D.L. and Johnstone, I.M., "Ideal spatial adaptation by
wavelet shrinkage", Biometrika, (1994), 425-455.
4. Anutam, R., "Performance analysis of image denoising with wavelet thresholding methods for different levels of decomposition", International Journal of & its Applications, Vol. 6, No. 3, (2014), 35-46.
5. Yaseen, A.S., Pavlova, O.N., Pavlov, A.N. and Hramov, A.E., "Image denoising with the dual-tree complex wavelet transform", in Saratov Fall Meeting, International Society for Optics and Photonics., (2016), 1-8.
6. Jing-yi, L., Hong, L., Dong, Y. and Yan-sheng, Z., "A new wavelet threshold function and denoising application",
Mathematical Problems in Engineering, Vol. 2016, No. 3, (2016), 1-8.
7. Han, M., Liu, Y., Xi, J. and Guo, W., "Noise smoothing for nonlinear time series using wavelet soft threshold", IEEE Signal Processing Letters, Vol. 14, No. 1, (2007), 62-65.
8. Kou, J.-K., Fu, Y.-L., Wang, L., Zhu, Q., Qu, W.-J., Xu, Z.-L., Yuan, Y.-W., Liu, Y.-W., Li, X.-M. and Zhang, L.-W., "Image denoising based on a new thresholding function", in Computer Science, Technology and Application: Proceedings of the International Conference on Computer Science, Technology and Application (CSTA2016), World Scientific., (2016), 3-8. 9. Xin, W., Yunxiao, W., Xiao, Y. and Yunjie, P., "Image
denoising based on multiwavelet shrinkage and subband enhancement", Journal of Harbin Institute of Technology, Vol. 40, No. 1, (2008), 152-154.
10. Shi, W., Li, J. and Wu, M., "An image denoising method based on multiscale wavelet thresholding and bilateral filtering",
Wuhan University Journal of Natural Sciences, Vol. 15, No. 2, (2010), 148-152.
11. Zhu, B., Wang, H. and Huang, L., "An improved adaptive image denoising method based on multi-wavelet transform", in Computing, Communication, Control, and Management, CCCM'08. ISECS International Colloquium on, IEEE. Vol. 1, (2008), 142-146.
12. Om, H. and Biswas, M., "An improved image denoising method based on wavelet thresholding", Journal of Signal and Information Processing, Vol. 3, No. 1, (2012), 109-116.. 13. Srivastava, M., Anderson, C.L. and Freed, J.H., "A new wavelet
denoising method for selecting decomposition levels and noise thresholds", IEEE Access, Vol. 4, (2016), 3862-3877. 14. Yang, P., Yang, G., Gai, S. and Chen, J., "Block thresholding
image denoising with dual-tree complex wavelet transform",
Journal of Intelligent & Fuzzy Systems, Vol. 30, No. 6, (2016), 3197-3207.
15. Fathima, N.R., Pitchammal, M. and Nisha, S.S., "Comparative study on natural image denoising in dwt and contourlet transform using bayes shrinkage technique", International Research Journal of Engineering and Technology, Vol. 3, No. 4, (2016), 135-147..
16. He, C., Xing, J., Li, J., Yang, Q. and Wang, R., "A new wavelet thresholding function based on hyperbolic tangent function",
Mathematical Problems in Engineering, Vol. 2015, (2015), 1-10..
17. Ehsaeyan, E., "A robust image denoising technique in the contourlet transform domain", International Journal of Engineering-Transactions B: Applications, Vol. 28, No. 11, (2015), 1589-1596.
18. Ehsaeyan, E., "An efficient curvelet framework for denoising images", International Journal of Engineering-Transactions B: Applications, Vol. 29, No. 8, (2016), 1094-1102.
19. Donoho, D.L., "De-noising by soft-thresholding", IEEE Transactions on Information Theory, Vol. 41, No. 3, (1995), 613-627.
20. Chang, S.G., Yu, B. and Vetterli, M., "Adaptive wavelet thresholding for image denoising and compression", IEEE Transactions on image processing, Vol. 9, No. 9, (2000), 1532-1546.
21. Chipman, H.A., Kolacxyk, E. and McCulloch, R.E., "Signal de-noising using adaptive bayesian wavelet shrinkage", in Time-Frequency and Time-Scale Analysis., Proceedings of the IEEE-SP International Symposium on,. (1996), 225-228.
Comparative Analysis of Image Denoising Methods Based on Wavelet Transform
and Threshold Functions
L. Feng, L. Lin
Weihai Vocational College, Weihai, P. R. China
P A P E R I N F O
Paper history: Received 21 October 2016
Received in revised form 07 February 2017 Accepted 09 February 2017
Keywords: Image Denoising Wavelet Transform Threshold Function Gaussian Mixture Model
ديكچ ه
لاخادت ت ون زی غ ری بانتجا لباق یدایز
هت رد هی وصت ری ارب .دراد دوجو لاقتنا و ی
شزادرپ اه ی دعب ی رد ادص و رس ،رتهب
وصت ری اب ار دی یدایز نازیم هب درک فذح
سب عاونا . یرای اهادص زا ی وصت دنترابع اتدمع هک دنراد دوجو ری زا
زیون و کمن
و لفلف زیون سوگ ی ا . نی هلاقم رب ون فذح زی سوگ ،ی .دراد زکرمت رد
ا نی هعلاطم روگلا متی یاه ون فذح زی هک کجوم هناتسآ
ون فذح لماش زی
ناهج هناتسآ ی ون فذح ، زی هناتسآ
Maxmin
ون فذح و ، زی
هناتسآ
BayesShrink
فرعم ی م ی دنوش ام .
اهشور فعض و توق طاقن ادکؤم ی
ون فذح فلتخم زی
باوت ساسا رب ع
هناتسآ اه ی فلتخم ار زجت هی لحت و یم لی مینک .
ا رب هولاع ،نی ام کی زیلانآ اقم هسی یا ارب ی ا نی شور یاه ون فذح یم ماجنا زی میهد اتن . جی برجت ی م ناشن ی روگلا هک دهد متی
ون فذح زی واصت ری سوگ طولخم لدم ساسا رب کجوم ی
ناهج هناتسآ زا رتهب ی
هناتسآ و
Maxmin
نچمه و ، نی مک ی رتهب
هناتسآ زا
BayesShrink
تسا .