VOLUME NO.3(2013),ISSUE NO.09(SEPTEMBER) ISSN 2231-5756
A Monthly Double-Blind Peer Reviewed (Refereed/Juried) Open Access International e-Journal - Included in the International Serial Directories
Indexed & Listed at:
VOLUME NO.3(2013),ISSUE NO.09(SEPTEMBER) ISSN 2231-5756
INTERNATIONAL JOURNAL OF RESEARCH IN COMMERCE, IT & MANAGEMENT
CONTENTS
CONTENTS
CONTENTS
CONTENTS
Sr.
No.
TITLE & NAME OF THE AUTHOR (S)
Page No.
1. ADEQUACY OF KNOWLEDGE AND ATTITUDE TOWARDS INFORMATION TECHNOLOGY OF STUDENT LIBRARY USERS AT SELECTED COLLEGES AND UNIVERSITIES IN CALABARZON, PHILIPPINES
DR. MA. LINDIE D. MASALINTO, DR. MA. CONSUELO M. OBILLO, RUFO S CALIXTRO JR., JOSEFA G. CARRILLO & MA. XENIA Z. BITERA
1
2. MOBILITY IN HETEROGENEOUS WIRELESS NETWORK USING HMAC C. SUGANTHI & DR. C. MANOHARAN
4
3. A STUDY ON CONSUMERS PERCEPTION TOWARDS THE PURCHASE DECISION OF TWO WHEELER MOTORCYCLES IN NELLORE DISTRICT, ANDHRA PRADESH
D.V.RAMANA & DR. PARA SUBBAIAH
9
4. OPTIMIZING THE DE-DUPLICATION FOLIAGE IMAGE ACCESS IN STORAGE SYSTEMS CHITTALA RAMA SATYA & B.VIJAYA KUMAR
15
5. A STUDY ON THE IMPACT OF E TAILERS ON UNORGANISED AND ORGANISED RETAILERS WITH REFERENCE TO ELECTRONIC GOODS KALAVATHY K.S & DR. BINA PANDEY
18
6. A MODERN CLASSIFICATION OF PRICING STRATEGIES OF RETAILERS SREELATA, N. V. NARASIMHAM & DR. M. K. GUPTA
24
7. LEADERSHIP CONCEPT: AN OPINION SURVEY IN A PRIVATE SECTOR AND GOVERNMENT SECTOR DR. E. LOKANADHA REDDY & DR. G HARANATH
30
8. MARKETING MIX: A REVIEW ON THE ‘P’S OF MARKETING M.VASUDEVAN, DR. V. M. SENTHILKUMAR & K.SASIKUMAR
37
9. SECURING A BIOMETRIC TRAIT: A CASE STUDY ON FINGER PRINTS MADHU CHAUHAN & DR. R. P. SAXENA
40
10. INFORMATION AND COMMUNICATION TECHNOLOGY AND THE PERFORMANCE OF SMALL AND MEDIUM ENTERPRISES IN NASARAWA STATE, NIGERIA
UMARU DANLADI MOHAMMED & CHINELO GRACE OBELEAGU-NZELIBE
43
11. RELIABILITY TEST PLANS BASED ON LOG-LOGISTIC DISTRIBUTION R.R.L.KANTAM, B.SRIRAM & A. SUHASINI
49
12. MIGRATION AND SUSTAINABLE DEVELOPMENT DR. H.R.UMA, MADHU G.R. & MAHAMMAD HABEEB
58
13. THE ANTECEDENTS OF BRAND LOYALTY: AN EMPIRICAL STUDY ON AIRTEL CELLULAR SERVICES DR. P. SUJATHA
61
14. STATUS OF BI SOLUTIONS AT SELECTED BRANCHES OF BANKS IN RAJASTHAN DR. AZIMUDDIN KHAN
66
15. A STUDY ON USAGE OF GEOSPATIAL TECHNOLOGIES IN POWER UTILITY VARUN PRAKASH
71
16. AN IMPROVED INVISIBLE WATERMARKING TECHNIQUE FOR IMAGE AUTHENTICATION DASU VAMAN RAVI PRASAD
76
17. ORGANIZATIONAL STRUCTURE, RESPONSIBILITY, MOTIVATION LEVEL AND JOB SATISFACTION OF SELF-FINANCING ENGINEERING COLLEGES BY USING MATHEMATICAL MODELING
RAVI DATT, DR. SUNIL DUTT, DR. SITA RAM & SANTOSH KUMARI
82
18. DESIGN AND IMPLEMENTATION OF A REAL-TIME VEHICLE TRACKING SYSTEM
MAITANMI OLUSOLA STEPHEN, OGUNLERE SAMSON OJO, DR. ADEKUNLE YINKA, GREGORY ONWODI & MALASOWE BRIDGET
86
19. PERFORMANCE EVALUATION OF MANET ROUTING PROTOCOLS WITH SCALABILITY FOR E-MAIL THROUGHPUT TRAFFIC USING OPNET MODELER MANDEEP SINGH & BALWINDER SINGH
93
20. DETAILED INVESTIGATION OF RESIDENTIAL SATISFACTION IN APARTMENT’S MANAGEMENT SERVICE P. BALATHANDAYUTHAM & DR. R. SRITHARAN
98
21. A STUDY ON THE PSYCHOLOGICAL IMPACT OF REDUNDANCY ON SURVIVORS S.SOWJANYA
100
22. A STUDY ON SECURITY THREAT AWARENESS AMONG STUDENTS USING SOCIAL NETWORKING SITES, BY APPLYING DATA MINING TECHNIQUES A.PAPPU RAJAN
103
23. ELECTRONIC REMITTANCE SYSTEM IN INDIA: CHANGING PARADIGMS OF PAYMENT MECHANISMS IN INDIA SAMIR
107
24. E-SATISFACTION AND E-LOYALTY OF CONSUMERS SHOPPING ONLINE R. SATHISH KUMAR
111
25. STUDENTS PERCEPTION TOWARDS e-BANKING: SPECIAL REFERENCE TO KOLLAM DISTRICT IN KERALA NIJAZ NIZAR
114
26. TECHNOLOGICAL DRIFT TOWARDS SMART DEVICES: AN OVERVIEW MUKESH H.V & HALASWAMY D. NAIK
118
27. MOTIVATION AS AN EFFECTIVE TOOL FOR ORGANIZATIONAL DEVELOPMENT IN NIGERIA DR. ABDULSALAM JIBRIL & YUSUF SAJO
121
28. AN UNDERSTANDING OF DUNNING’S OWNERSHIP-LOCATION-INTERNALISATION (OLI) ECLECTIC THEORY OF MULTINATIONAL COMPANIES JABES GABBIS ODHIAMBO KOTIENO
124
29. AUTHORING TOOL: KEY FOR E-LEARNING SYSTEM DEVELOPMENT JAVED WASIM
128
30. ANTECEDENTS AND CONSEQUENCES OF WORK-EXHAUSTION (IT SECTOR) UMAIR NAJAM & FAISAL ABBAS
131
VOLUME NO.3(2013),ISSUE NO.09(SEPTEMBER) ISSN 2231-5756
CHIEF PATRON
CHIEF PATRON
CHIEF PATRON
CHIEF PATRON
PROF. K. K. AGGARWAL
Chairman, Malaviya National Institute of Technology, Jaipur
(An institute of National Importance & fully funded by Ministry of Human Resource Development, Government of India)
Chancellor, K. R. Mangalam University, Gurgaon
Chancellor, Lingaya’s University, Faridabad
Founder Vice-Chancellor (1998-2008), Guru Gobind Singh Indraprastha University, Delhi
Ex. Pro Vice-Chancellor, Guru Jambheshwar University, Hisar
FOUNDER
FOUNDER
FOUNDER
FOUNDER PATRON
PATRON
PATRON
PATRON
LATE SH. RAM BHAJAN AGGARWAL
Former State Minister for Home & Tourism, Government of Haryana
Former Vice-President, Dadri Education Society, Charkhi Dadri
Former President, Chinar Syntex Ltd. (Textile Mills), Bhiwani
CO
CO
CO
CO----ORDINATOR
ORDINATOR
ORDINATOR
ORDINATOR
AMITA
Faculty, Government M. S., Mohali
ADVISORS
ADVISORS
ADVISORS
ADVISORS
DR. PRIYA RANJAN TRIVEDI
Chancellor, The Global Open University, Nagaland
PROF. M. S. SENAM RAJU
Director A. C. D., School of Management Studies, I.G.N.O.U., New Delhi
PROF. M. N. SHARMA
Chairman, M.B.A., Haryana College of Technology & Management, Kaithal
PROF. S. L. MAHANDRU
Principal (Retd.), Maharaja Agrasen College, Jagadhri
EDITOR
EDITOR
EDITOR
EDITOR
PROF. R. K. SHARMA
Professor, Bharti Vidyapeeth University Institute of Management & Research, New Delhi
CO
CO
CO
CO----EDITOR
EDITOR
EDITOR
EDITOR
DR. BHAVET
Faculty, Shree Ram Institute of Business & Management, Urjani
EDITORIAL ADVISORY BOARD
EDITORIAL ADVISORY BOARD
EDITORIAL ADVISORY BOARD
EDITORIAL ADVISORY BOARD
DR. RAJESH MODI
Faculty, Yanbu Industrial College, Kingdom of Saudi Arabia
PROF. SANJIV MITTAL
University School of Management Studies, Guru Gobind Singh I. P. University, Delhi
PROF. ANIL K. SAINI
VOLUME NO.3(2013),ISSUE NO.09(SEPTEMBER) ISSN 2231-5756
INTERNATIONAL JOURNAL OF RESEARCH IN COMMERCE, IT & MANAGEMENT
DR. SAMBHAVNA
Faculty, I.I.T.M., Delhi
DR. MOHENDER KUMAR GUPTA
Associate Professor, P. J. L. N. Government College, Faridabad
DR. SHIVAKUMAR DEENE
Asst. Professor, Dept. of Commerce, School of Business Studies, Central University of Karnataka, Gulbarga
ASSOCIATE EDITORS
ASSOCIATE EDITORS
ASSOCIATE EDITORS
ASSOCIATE EDITORS
PROF. NAWAB ALI KHAN
Department of Commerce, Aligarh Muslim University, Aligarh, U.P.
PROF. ABHAY BANSAL
Head, Department of Information Technology, Amity School of Engineering & Technology, Amity
University, Noida
PROF. A. SURYANARAYANA
Department of Business Management, Osmania University, Hyderabad
DR. SAMBHAV GARG
Faculty, Shree Ram Institute of Business & Management, Urjani
PROF. V. SELVAM
SSL, VIT University, Vellore
DR. PARDEEP AHLAWAT
Associate Professor, Institute of Management Studies & Research, Maharshi Dayanand University, Rohtak
DR. S. TABASSUM SULTANA
Associate Professor, Department of Business Management, Matrusri Institute of P.G. Studies, Hyderabad
SURJEET SINGH
Asst. Professor, Department of Computer Science, G. M. N. (P.G.) College, Ambala Cantt.
TECHNICAL ADVISOR
TECHNICAL ADVISOR
TECHNICAL ADVISOR
TECHNICAL ADVISOR
AMITA
Faculty, Government M. S., Mohali
FINANCIAL ADVISORS
FINANCIAL ADVISORS
FINANCIAL ADVISORS
FINANCIAL ADVISORS
DICKIN GOYAL
Advocate & Tax Adviser, Panchkula
NEENA
Investment Consultant, Chambaghat, Solan, Himachal Pradesh
LEGAL ADVISORS
LEGAL ADVISORS
LEGAL ADVISORS
LEGAL ADVISORS
JITENDER S. CHAHAL
Advocate, Punjab & Haryana High Court, Chandigarh U.T.
CHANDER BHUSHAN SHARMA
Advocate & Consultant, District Courts, Yamunanagar at Jagadhri
SUPERINTENDENT
SUPERINTENDENT
SUPERINTENDENT
SUPERINTENDENT
VOLUME NO.3(2013),ISSUE NO.09(SEPTEMBER) ISSN 2231-5756
CALL FOR
CALL FOR
CALL FOR
CALL FOR MANUSCRIPTS
MANUSCRIPTS
MANUSCRIPTS
MANUSCRIPTS
We invite unpublished novel, original, empirical and high quality research work pertaining to recent developments & practices in the areas of Computer Science & Applications; Commerce; Business; Finance; Marketing; Human Resource Management; General Management; Banking; Economics; Tourism Administration & Management; Education; Law; Library & Information Science; Defence & Strategic Studies; Electronic Science; Corporate Governance; Industrial Relations; and emerging paradigms in allied subjects like Accounting; Accounting Information Systems; Accounting Theory & Practice; Auditing; Behavioral Accounting; Behavioral Economics; Corporate Finance; Cost Accounting; Econometrics; Economic Development; Economic History; Financial Institutions & Markets; Financial Services; Fiscal Policy; Government & Non Profit Accounting; Industrial Organization; International Economics & Trade; International Finance; Macro Economics; Micro Economics; Rural Economics; Co-operation; Demography: Development Planning; Development Studies; Applied Economics; Development Economics; Business Economics; Monetary Policy; Public Policy Economics; Real Estate; Regional Economics; Political Science; Continuing Education; Labour Welfare; Philosophy; Psychology; Sociology; Tax Accounting; Advertising & Promotion Management; Management Information Systems (MIS); Business Law; Public Responsibility & Ethics; Communication; Direct Marketing; E-Commerce; Global Business; Health Care Administration; Labour Relations & Human Resource Management; Marketing Research; Marketing Theory & Applications; Non-Profit Organizations; Office Administration/Management; Operations Research/Statistics; Organizational Behavior & Theory; Organizational Development; Production/Operations; International Relations; Human Rights & Duties; Public Administration; Population Studies; Purchasing/Materials Management; Retailing; Sales/Selling; Services; Small Business Entrepreneurship; Strategic Management Policy; Technology/Innovation; Tourism & Hospitality; Transportation Distribution; Algorithms; Artificial Intelligence; Compilers & Translation; Computer Aided Design (CAD); Computer Aided Manufacturing; Computer Graphics; Computer Organization & Architecture; Database Structures & Systems; Discrete Structures; Internet; Management Information Systems; Modeling & Simulation; Neural Systems/Neural Networks; Numerical Analysis/Scientific Computing; Object Oriented Programming; Operating Systems; Programming Languages; Robotics; Symbolic & Formal Logic; Web Design and emerging paradigms in allied subjects.
Anybody can submit the soft copy of unpublished novel; original; empirical and high quality research work/manuscript anytime in M.S. Word format
after preparing the same as per our GUIDELINES FOR SUBMISSION; at our email address i.e. [email protected] or online by clicking the link online
submission as given on our website (FOR ONLINE SUBMISSION, CLICK HERE).
GUIDELINES FOR SUBMISSION OF MANUSCRIPT
GUIDELINES FOR SUBMISSION OF MANUSCRIPT
GUIDELINES FOR SUBMISSION OF MANUSCRIPT
GUIDELINES FOR SUBMISSION OF MANUSCRIPT
1. COVERING LETTER FOR SUBMISSION:
DATED: _____________ THE EDITOR
IJRCM
Subject: SUBMISSION OF MANUSCRIPT IN THE AREA OF.
(e.g. Finance/Marketing/HRM/General Management/Economics/Psychology/Law/Computer/IT/Engineering/Mathematics/other, please specify)
DEAR SIR/MADAM
Please find my submission of manuscript entitled ‘___________________________________________’ for possible publication in your journals.
I hereby affirm that the contents of this manuscript are original. Furthermore, it has neither been published elsewhere in any language fully or partly, nor is it under review for publication elsewhere.
I affirm that all the author (s) have seen and agreed to the submitted version of the manuscript and their inclusion of name (s) as co-author (s).
Also, if my/our manuscript is accepted, I/We agree to comply with the formalities as given on the website of the journal & you are free to publish our contribution in any of your journals.
NAME OF CORRESPONDING AUTHOR: Designation:
Affiliation with full address, contact numbers & Pin Code: Residential address with Pin Code:
Mobile Number (s): Landline Number (s): E-mail Address: Alternate E-mail Address:
NOTES:
a) The whole manuscript is required to be in ONE MS WORD FILE only (pdf. version is liable to be rejected without any consideration), which will start from the covering letter, inside the manuscript.
b) The sender is required to mentionthe following in the SUBJECT COLUMN of the mail:
New Manuscript for Review in the area of (Finance/Marketing/HRM/General Management/Economics/Psychology/Law/Computer/IT/ Engineering/Mathematics/other, please specify)
c) There is no need to give any text in the body of mail, except the cases where the author wishes to give any specific message w.r.t. to the manuscript. d) The total size of the file containing the manuscript is required to be below 500 KB.
e) Abstract alone will not be considered for review, and the author is required to submit the complete manuscript in the first instance.
f) The journal gives acknowledgement w.r.t. the receipt of every email and in case of non-receipt of acknowledgment from the journal, w.r.t. the submission of manuscript, within two days of submission, the corresponding author is required to demand for the same by sending separate mail to the journal. 2. MANUSCRIPT TITLE: The title of the paper should be in a 12 point Calibri Font. It should be bold typed, centered and fully capitalised.
3. AUTHOR NAME (S) & AFFILIATIONS: The author (s) full name, designation, affiliation (s), address, mobile/landline numbers, and email/alternate email address should be in italic & 11-point Calibri Font. It must be centered underneath the title.
VOLUME NO.3(2013),ISSUE NO.09(SEPTEMBER) ISSN 2231-5756
INTERNATIONAL JOURNAL OF RESEARCH IN COMMERCE, IT & MANAGEMENT
5. KEYWORDS: Abstract must be followed by a list of keywords, subject to the maximum of five. These should be arranged in alphabetic order separated by commas and full stops at the end.
6. MANUSCRIPT: Manuscript must be in BRITISH ENGLISH prepared on a standard A4 size PORTRAIT SETTING PAPER. It must be prepared on a single space and single column with 1” margin set for top, bottom, left and right. It should be typed in 8 point Calibri Font with page numbers at the bottom and centre of every page. It should be free from grammatical, spelling and punctuation errors and must be thoroughly edited.
7. HEADINGS: All the headings should be in a 10 point Calibri Font. These must be bold-faced, aligned left and fully capitalised. Leave a blank line before each heading.
8. SUB-HEADINGS: All the sub-headings should be in a 8 point Calibri Font. These must be bold-faced, aligned left and fully capitalised. 9. MAIN TEXT: The main text should follow the following sequence:
INTRODUCTION REVIEW OF LITERATURE
NEED/IMPORTANCE OF THE STUDY STATEMENT OF THE PROBLEM OBJECTIVES
HYPOTHESES
RESEARCH METHODOLOGY RESULTS & DISCUSSION FINDINGS
RECOMMENDATIONS/SUGGESTIONS CONCLUSIONS
SCOPE FOR FURTHER RESEARCH ACKNOWLEDGMENTS REFERENCES APPENDIX/ANNEXURE
It should be in a 8 point Calibri Font, single spaced and justified. The manuscript should preferably not exceed 5000 WORDS.
10. FIGURES &TABLES: These should be simple, crystal clear, centered, separately numbered & self explained, and titles must be above the table/figure. Sources of data should be mentioned below the table/figure. It should be ensured that the tables/figures are referred to from the main text.
11. EQUATIONS:These should be consecutively numbered in parentheses, horizontally centered with equation number placed at the right.
12. REFERENCES: The list of all references should be alphabetically arranged. The author (s) should mention only the actually utilised references in the preparation of manuscript and they are supposed to follow Harvard Style of Referencing. The author (s) are supposed to follow the references as per the following:
•
All works cited in the text (including sources for tables and figures) should be listed alphabetically.•
Use (ed.) for one editor, and (ed.s) for multiple editors.•
When listing two or more works by one author, use --- (20xx), such as after Kohl (1997), use --- (2001), etc, in chronologically ascending order.•
Indicate (opening and closing) page numbers for articles in journals and for chapters in books.•
The title of books and journals should be in italics. Double quotation marks are used for titles of journal articles, book chapters, dissertations, reports, working papers, unpublished material, etc.•
For titles in a language other than English, provide an English translation in parentheses.•
The location of endnotes within the text should be indicated by superscript numbers.PLEASE USE THE FOLLOWING FOR STYLE AND PUNCTUATION IN REFERENCES: BOOKS
•
Bowersox, Donald J., Closs, David J., (1996), "Logistical Management." Tata McGraw, Hill, New Delhi.•
Hunker, H.L. and A.J. Wright (1963), "Factors of Industrial Location in Ohio" Ohio State University, Nigeria.CONTRIBUTIONS TO BOOKS
•
Sharma T., Kwatra, G. (2008) Effectiveness of Social Advertising: A Study of Selected Campaigns, Corporate Social Responsibility, Edited by David Crowther & Nicholas Capaldi, Ashgate Research Companion to Corporate Social Responsibility, Chapter 15, pp 287-303.JOURNAL AND OTHER ARTICLES
•
Schemenner, R.W., Huber, J.C. and Cook, R.L. (1987), "Geographic Differences and the Location of New Manufacturing Facilities," Journal of Urban Economics, Vol. 21, No. 1, pp. 83-104.CONFERENCE PAPERS
•
Garg, Sambhav (2011): "Business Ethics" Paper presented at the Annual International Conference for the All India Management Association, New Delhi, India, 19–22 June.UNPUBLISHED DISSERTATIONS AND THESES
•
Kumar S. (2011): "Customer Value: A Comparative Study of Rural and Urban Customers," Thesis, Kurukshetra University, Kurukshetra.ONLINE RESOURCES
•
Always indicate the date that the source was accessed, as online resources are frequently updated or removed.WEBSITES
VOLUME NO.3(2013),ISSUE NO.09(SEPTEMBER) ISSN 2231-5756
RELIABILITY TEST PLANS BASED ON LOG-LOGISTIC DISTRIBUTION
R.R.L.KANTAM
PROFESSOR
DEPARTMENT OF STATISTICS
ACHARYANAGARJUNA UNIVERSITY
NAGARJUNA NAGAR
B.SRIRAM
LECTURER
DEPARTMENT OF STATISTICS
A.A.R & B.M.R. DEGREE COLLEGE
VIJAYAWADA
A. SUHASINI
LECTURER
DEPARTMENT OF STATISTICS
S.D.M.SIDDHARTHAMAHILAKALASALA
VIJAYAWADA
ABSTRACT
The well known Log-Logistic Distribution as suggested by Balakrishnan et al.(1987) is considered with a known shape parameter(β = 3). In reliability studies the item that are put to test, to collect the life of the items in order to decide upon accepting or rejecting a submitted lot, are called reliability test plans. For a given producer’s risk, sample size, termination number and waiting time to terminate the test plan are computed. The preferability of the test plan over similar plans existing in the literature are established.
KEYWORDS
Log-Logistic distribution (β = 3), Reliability test plan, Producers risk, Acceptance sample number.
1. INTRODUCTION
life test is an experiment that is conducted to determine whether or not a product needs the specified requirements for average life. Generally in such a test fixed number of products taken as a sample out of a submitted lot of those products. To decide upon acceptance or otherwise of the lot on the basis of the observed life times of sampled test procedure requires a specification of sample size, a terminating rule to arrive at a decision, the criterion that defines, the preferability or otherwise of the lot and above all the risks associated with the decisions. Since exponential distribution the CFR model the central distribution in reliability studies, Epstein (1954) developed reliability test plans for exponential distribution. Truncated live of this type are developed by Sobel & Tischendrof (1959) for exponential distribution. Gupta & Groll (1961) constructed similar sampling plans based gamma life test sample data. Goode & Kao (1961) constructed sampling plans based on Weibull distribution. Kantam & Rosaiah (1998) suggested acceptance sampling plans based on life tests when the failure density model of the products is half-logistic distribution. The reliability test plans based on gamma variate was suggested by Kantam & SriRam (2010).
Kantam et al. (2012) constructed similar reliability test plans for exponentiated exponential distribution.
In this paper we present a different approach to the construction of sampling plans for Log logistic distribution with shape parameter (β = 3) following Braverman (1981, Ch II). By considering the Log logistic distribution (β = 3) as the failure density governing the life times of the product in the submitted lot and
made an attempt to construct the necessary test plan that can be used to decide upon accepting or otherwise of the submitted lot of product. Rosaiah et al.
(2008) suggested similar plans for Inverse Rayleigh distribution, the operating characteristic of such plan are also presented. The necessary theory of the present plans is given in Section 2, the operating characteristics are given in Section 3, and comparative study is presented in Section 4.
2 RELIABILITY TEST PLANS
Let a lot of products of indefinitely large size be submitted for sampling inspection and decision to reject or accept. Let us assume that the probability density function of life of a product is a Log Logistic distribution (β = 3) with scale parameter σ, whose probability density function f(x, σ), cumulative distribution function F(x, σ) are given in equations
(2.1) 0 , 0 ; 1 3 ) ( 2 3 2 >>>> >>>> ++++ ==== σσσσ σσσσ σσσσ
σσσσ x x
x x f (2.2) 0 0, x ; 1 x ) ( 3 3 >>>> >>>> ++++ ==== σσσσ σσσσ σσσσ x x F
Let ‘α’ be the probability of rejecting the submitted lot that is truly good in some sense- known as producer’s risk. Naturally ‘α’ should be as small as possible. We can think of the decision making in two different ways.
(i) Let σo be a specified value of σ representing the mean life of the product and ‘to’ be pre-assigned time at which the life testing experiment of sample
products is designed to be terminated. Hence ‘to’ may be called “Terminating time”. Gupta & Groll (1961) suggested the minimum sample size required is ‘n’
and an acceptance number c, such that if c or less failures occur out of ‘n’, before the time ‘to’, the lot would be accepted with a probability (1- α). This approach
is basically counting number of failures out of n, with in the terminating time ‘to’ and hence the life testing experiment would be stopped as soon as the time ‘to’
VOLUME NO.3(2013),ISSUE NO.09(SEPTEMBER) ISSN 2231-5756
INTERNATIONAL JOURNAL OF RESEARCH IN COMMERCE, IT & MANAGEMENT
is reached or (c+1)st failure is realized whichever is earlier. A typical table of Srinivasa Rao (2001) is reproduced here in order to illustrate by an example and
presented in Table 2.1
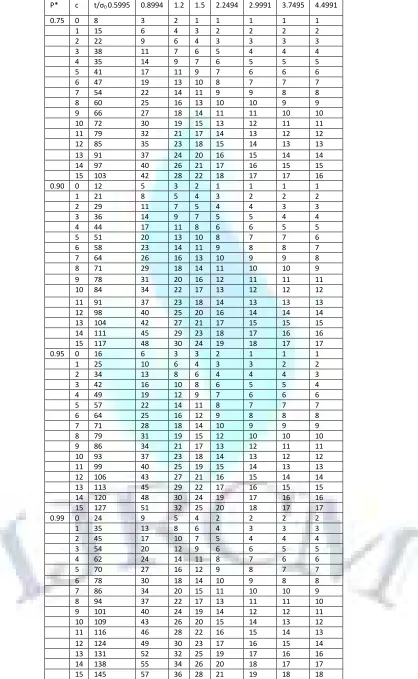
Suppose an experimenter wishes (Gupta & Groll 1961, p.g. 952) to know that the true mean life 1.5σ0 is atleast 5000 hours with probability 0.95 and the
experiment designed to stop at 1000 hours after starting. For an acceptance number c = 2 from the above table the minimum sample size required is the entry
corresponding to c = 2, to/σo = 0.5995 and this is 34. Hence it is suggested that if 34 products are put to test at time “0” with an aim of stopping the test at the
1000th hour, we accept the lot with probability of 0.95, if the number of failures before the 1000th hour is less than or equal to 2. The lot shall be rejected of the
number of failures with in 1000th hour is 3 or more.
(ii) Alternatively one can think of another reliability test plan. Let ‘n’ stand for the number of sampled items to be inspected and ‘r’ be natural number such that
if ‘r’ failures are realized before the termination time ‘to’ the lot would be rejected, that is the experiment is stopped as soon as rth failure is reached or
termination time ‘to’ is reached whichever is earlier and in this sense ‘r’ is called termination number. The sample size naturally depends on cost considerations
and expected waiting time to reach a decision. Large sample sizes may decrease expected waiting time but increase cost of experimentation. As a balance between these two aspects, let us consider the sample size as a multiple of termination number.
We know that the probability of ‘r’ failures out of ‘n’ tested items is given by
where p= F(x, σ) the cumulative distribution function of the log-logistic distribution, hence acceptance probability of lot is
∑
∑
∑
∑
====
====
r-10 i r -n r
(2.3)
q
p
r
n
P
a For specified producer’s risk say α, termination number r, sample size ‘n’ as a multiple of ‘r’ we can write the above equation as(2.4)
1
q
kr-r1 0
αααα
−−−−
====
∑
∑
∑
∑
−−−− ==== r r ip
r
kr
Using the cumulative probability of binomial distribution the above equation can be solved for p. Equating F(x,σ) to p we can get the value of x/ σ corresponding to p, that is x/σ is the solution of
(2.5)
p
1
x
)
;
(
3 3====
++++
====
σσσσ
σσσσ
σσσσ
x
x
F
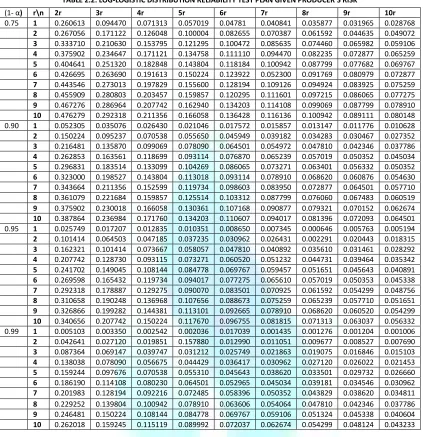
As an example suppose we have to construct a life test sampling plan with an acceptance probability of 0.95 for lots with an acceptable mean life of 1000 hours and termination number 5, sample size 10. From Table 2.2 the entry against r = 5 under the column 2r is 0.241702, since the acceptable mean life is given to be
660 hours. For a log-logistic distribution this implies σ0 = 660. If the termination time is given by ‘t0’ the table value says that t/1.5σ0 = 0.241702, ie., t0 =
660×0.241702= 158.5232=159.
This test plan will be implemented as follows: Select 10 items from the submitted lot and put them to test if the 5th failure is realized before 159th hour of the
test reject the lot, otherwise accept the lot in either case terminating the experiment as soon as the 5th failure is reached or 159th hour of the test time is reached
whichever is earlier. In the case of acceptance the assurance is that the average life of the submitted products is at least 660 hours.
As a comparison of our test plan with that of Srinivasa Rao (2001) for α =0.25, 0.10, 0.05, 0.01. Using the common entries for n, r (=c+1) in both approaches. The termination times for average life are given in Table 2.3.
We have tabulated from the above Equations 2.2, 2.3 the values of x/σ for α =0.25, 0.10, 0.05, 0.01; r=1(1)10, k=2(1)10, in Table 2.2 for log-logistic distribution and these tables can be another reliability test plans. These tables show that for the same α, sample size acceptance number, termination time of second approach is much earlier than in the first approach. Resulting in a considerable saving in the waiting time to come to a decision for any specified value of ‘σ’.
3
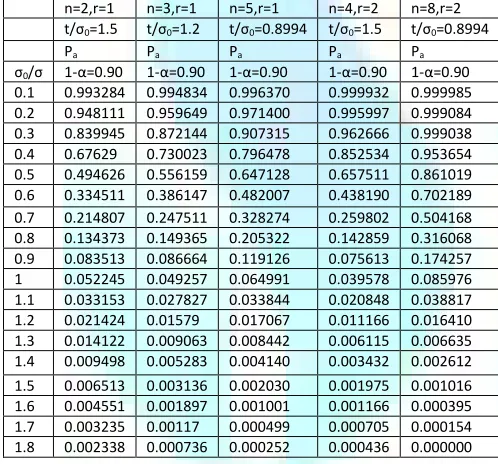
OPERATING CHARACTERISTIC CURVE
If the true but unknown life of the product deviates from the specified life of the product, it should result in a considerable change in the probability of acceptance of the lot based on the sampling plan. Hence the probability of acceptance can be regarded as a function of the deviation of specified average from the true average. This function is called operating characteristic function of the sampling plan, hence the operating characteristic lies between 0 and 1.
Specifically if F (T/σ) is the cumulative distribution function of the life time random variable of the product, σ0 corresponds to specified life, we can write
= , ....(3.1)
where corresponds to true but unknown average life. The ratio σ0/σ in the R.H.S of above equation can be taken as a measure of changes between true and
specified lives. For instance σ0/σ < 1 implies true mean life is more than the declared life leading to more acceptance probability or less failure risk. Similarly
σ0/σ more than 1 implies less acceptance probability or more failure risk. Hence giving a set of hypothetical values say σ0/σ = 0.1(0.1)0.9 we can have the
corresponding acceptance probabilities of acceptance given by Equation (2.3) for a sampling plan forms the O.C. curve of the plan. Here we have selected some
plans and O.C. values of these plans are given in Tables 3.1 to 3.8 and the graph between σ0/σ, the probability of acceptance given by Equation 3.1 for a sampling
plan forms the O.C. curve of the plans and were given by the Figures 1 to 8.
4 COMPARATIVE STUDY
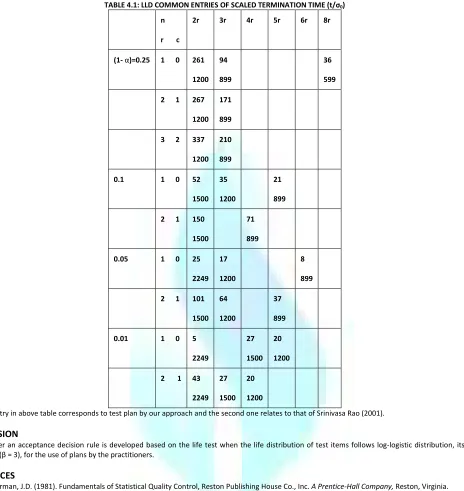
VOLUME NO.3(2013),ISSUE NO.09(SEPTEMBER) ISSN 2231-5756 TABLE 4.1: LLD COMMON ENTRIES OF SCALED TERMINATION TIME (t/σ0)
n r c
2r 3r 4r 5r 6r 8r
(1- α)=0.25 1 0 261 1200
94 899
36 599 2 1 267
1200 171 899 3 2 337
1200 210 899 0.1 1 0 52
1500 35 1200
21 899 2 1 150
1500
71 899 0.05 1 0 25
2249 17 1200
8 899 2 1 101
1500 64 1200
37 899 0.01 1 0 5
2249
27 1500
20 1200 2 1 43
2249 27 1500
20 1200
The first entry in above table corresponds to test plan by our approach and the second one relates to that of Srinivasa Rao (2001).
CONCLUSION
In this paper an acceptance decision rule is developed based on the life test when the life distribution of test items follows log-logistic distribution, its shape parameter (β = 3), for the use of plans by the practitioners.
REFERENCES
1. Braverman, J.D. (1981). Fundamentals of Statistical Quality Control, Reston Publishing House Co., Inc. A Prentice-Hall Company, Reston, Virginia.
2. Epstein, B. & Sobel, M. (1954). Some theorems relevant to life testing from an exponential distribution, Ann.Math.Statist., Vol.25, 373-381.
3. Goode,H.P & Kao,J.H.K. (1961) Sampling plans based on the Weibull distribution, Proceedings of Seventh National Symposium on Reliability and Quality
Control, Philadelphia, Pennsylvania, pp.20-40.
4. Gupta, S.S. & Groll, P.A. (1961). Gamma distribution in acceptance sampling based on life tests, Journal of the American Statistical Association, 56, 942-970.
5. Kantam, R.R.L., & Rosaiah, K. (1998). Half logistic distribution in acceptance sampling based on life tests, IAPQR Transactions, 23(2), 117-125.
6. Kantam, R.R.L., B. SriRam & A. Suhasini (2012). Reliability Test Plans: Exponentiated Exponential Distribution, International Journal of Mathematical
Sciences, Vol.3, Sep 2012.
7. Srinivasa Rao,G. (2001). Some problems of statistical inference with applications in log-logistic distribution. Unpublished Ph.D. Thesis is awarded by
VOLUME NO.3(2013),ISSUE NO.09(SEPTEMBER) ISSN 2231-5756
INTERNATIONAL JOURNAL OF RESEARCH IN COMMERCE, IT & MANAGEMENT
TABLES
TABLE 2.1: LOG LOGISTIC DISTRIBUTION RELIABILITY TEST PLANS GIVES CONSUMERS RISK
P* c t/σ0 0.5995 0.8994 1.2 1.5 2.2494 2.9991 3.7495 4.4991
0.75 0 8 3 2 1 1 1 1 1
1 15 6 4 3 2 2 2 2
2 22 9 6 4 3 3 3 3
3 38 11 7 6 5 4 4 4
4 35 14 9 7 6 5 5 5
5 41 17 11 9 7 6 6 6
6 47 19 13 10 8 7 7 7
7 54 22 14 11 9 9 8 8
8 60 25 16 13 10 10 9 9
9 66 27 18 14 11 11 10 10
10 72 30 19 15 13 12 11 11
11 79 32 21 17 14 13 12 12
12 85 35 23 18 15 14 13 13
13 91 37 24 20 16 15 14 14
14 97 40 26 21 17 16 15 15
15 103 42 28 22 18 17 17 16
0.90 0 12 5 3 2 1 1 1 1
1 21 8 5 4 3 2 2 2
2 29 11 7 5 4 4 3 3
3 36 14 9 7 5 5 4 4
4 44 17 11 8 6 6 5 5
5 51 20 13 10 8 7 7 6
6 58 23 14 11 9 8 8 7
7 64 26 16 13 10 9 9 8
8 71 29 18 14 11 10 10 9
9 78 31 20 16 12 11 11 11
10 84 34 22 17 13 12 12 12
11 91 37 23 18 14 13 13 13
12 98 40 25 20 16 14 14 14
13 104 42 27 21 17 15 15 15
14 111 45 29 23 18 17 16 16
15 117 48 30 24 19 18 17 17
0.95 0 16 6 3 3 2 1 1 1
1 25 10 6 4 3 3 2 2
2 34 13 8 6 4 4 4 3
3 42 16 10 8 6 5 5 4
4 49 19 12 9 7 6 6 6
5 57 22 14 11 8 7 7 7
6 64 25 16 12 9 8 8 8
7 71 28 18 14 10 9 9 9
8 79 31 19 15 12 10 10 10
9 86 34 21 17 13 12 11 11
10 93 37 23 18 14 13 12 12
11 99 40 25 19 15 14 13 13
12 106 43 27 21 16 15 14 14
13 113 45 29 22 17 16 15 15
14 120 48 30 24 19 17 16 16
15 127 51 32 25 20 18 17 17
0.99 0 24 9 5 4 2 2 2 2
1 35 13 8 6 4 3 3 3
2 45 17 10 7 5 4 4 4
3 54 20 12 9 6 6 5 5
4 62 24 14 11 8 7 6 6
5 70 27 16 12 9 8 7 7
6 78 30 18 14 10 9 8 8
7 86 34 20 15 11 10 10 9
8 94 37 22 17 13 11 11 10
9 101 40 24 19 14 12 12 11
10 109 43 26 20 15 14 13 12
11 116 46 28 22 16 15 14 13
12 124 49 30 23 17 16 15 14
13 131 52 32 25 19 17 16 16
14 138 55 34 26 20 18 17 17
VOLUME NO.3(2013),ISSUE NO.09(SEPTEMBER) ISSN 2231-5756 TABLE 2.2: LOG-LOGISTIC DISTRIBUTION RELIABILITY TEST PLAN GIVEN PRODUCER’S RISK
TABLE 3.1: LOG-LOGISTIC DISTRIBUTION O.C. VALUES OF SELECTED RELIABILITY TEST PLANS FOR A GIVEN CONSUMER’S RISK
(1- α) r\n 2r 3r 4r 5r 6r 7r 8r 9r 10r
0.75 1 0.260613 0.094470 0.071313 0.057019 0.04781 0.040841 0.035877 0.031965 0.028768
2 0.267056 0.171122 0.126048 0.100004 0.082655 0.070387 0.061592 0.044635 0.049072
3 0.333710 0.210630 0.153795 0.121295 0.100472 0.085635 0.074460 0.065982 0.059106
4 0.375902 0.234647 0.171121 0.134758 0.111110 0.094470 0.082235 0.072877 0.065259
5 0.404641 0.251320 0.182848 0.143804 0.118184 0.100942 0.087799 0.077682 0.069767
6 0.426695 0.263690 0.191613 0.150224 0.123922 0.052300 0.091769 0.080979 0.072877
7 0.443546 0.273013 0.197829 0.155600 0.128194 0.109126 0.094924 0.083925 0.075259
8 0.455909 0.280803 0.203457 0.159857 0.120295 0.111601 0.097215 0.086065 0.077275
9 0.467276 0.286964 0.207742 0.162940 0.134203 0.114108 0.099069 0.087799 0.078910
10 0.476279 0.292318 0.211356 0.166058 0.136428 0.116136 0.100942 0.089111 0.080148
0.90 1 0.052305 0.035076 0.026430 0.021046 0.017572 0.015857 0.013147 0.011776 0.010628
2 0.150224 0.095237 0.070538 0.055650 0.045949 0.039182 0.034283 0.030467 0.027352
3 0.216481 0.135870 0.099069 0.078090 0.064501 0.054972 0.047810 0.042346 0.037786
4 0.262853 0.163561 0.118699 0.093114 0.076870 0.065239 0.057019 0.050352 0.045034
5 0.296831 0.183514 0.133099 0.104269 0.086065 0.073271 0.063401 0.056332 0.050352
6 0.323000 0.198527 0.143804 0.113018 0.093114 0.078910 0.068620 0.060876 0.054630
7 0.343664 0.211356 0.152599 0.119734 0.098603 0.083950 0.072877 0.064501 0.057710
8 0.361079 0.221684 0.159857 0.125514 0.103312 0.087799 0.076060 0.067483 0.060519
9 0.375902 0.230018 0.166058 0.130361 0.107168 0.090877 0.079321 0.070152 0.062674
10 0.387864 0.236984 0.171760 0.134203 0.110607 0.094017 0.081396 0.072093 0.064501
0.95 1 0.025749 0.017207 0.012835 0.010351 0.008650 0.007345 0.000646 0.005763 0.005194
2 0.101414 0.064503 0.047185 0.037235 0.030962 0.026431 0.002291 0.020443 0.018315
3 0.162321 0.101414 0.073667 0.058057 0.047810 0.040892 0.035610 0.031461 0.028292
4 0.207742 0.128730 0.093115 0.073271 0.060520 0.051232 0.044731 0.039464 0.035342
5 0.241702 0.149045 0.108144 0.084778 0.069767 0.059457 0.051651 0.045643 0.040891
6 0.269598 0.165432 0.119734 0.094017 0.077275 0.065610 0.057019 0.050353 0.045338
7 0.292318 0.178887 0.129275 0.090070 0.083501 0.070925 0.061592 0.054299 0.048756
8 0.310658 0.190248 0.136968 0.107656 0.088673 0.075259 0.065239 0.057710 0.051651
9 0.326866 0.199282 0.144381 0.113101 0.092665 0.078910 0.068620 0.060520 0.054299
10 0.340656 0.207742 0.150224 0.117670 0.096755 0.081815 0.071313 0.063037 0.056332
0.99 1 0.005103 0.003350 0.002542 0.002036 0.017039 0.001435 0.001276 0.001204 0.001006
2 0.042641 0.027120 0.019851 0.157880 0.012990 0.011051 0.009677 0.008527 0.007690
3 0.087364 0.069147 0.039747 0.031212 0.025749 0.021863 0.019075 0.016846 0.015103
4 0.138038 0.078090 0.056675 0.044429 0.036417 0.030962 0.027120 0.026022 0.021453
5 0.159244 0.097676 0.070538 0.055310 0.045643 0.038620 0.033501 0.029732 0.026660
6 0.186190 0.114108 0.080230 0.064501 0.052965 0.045034 0.039181 0.034546 0.030962
7 0.201983 0.128194 0.092216 0.072485 0.058396 0.050352 0.043829 0.038620 0.034811
8 0.229252 0.139804 0.100942 0.078910 0.063606 0.054064 0.047810 0.042346 0.037786
9 0.246481 0.150224 0.108144 0.084778 0.069767 0.059106 0.051324 0.045338 0.040604
10 0.262018 0.159245 0.115119 0.089992 0.072037 0.062674 0.054299 0.048124 0.043233
n=2,r=1 n=3,r=1 n=8,r=1 n=4,r=2 n=6,r=2 n=6;r=3 n=9;r=3
t/σ0=1.2 t/σ0=0.8994 t/σ0=0.5995 t/σ0=1.2 t/σ0=0.8994 t/σ0=1.2 t/σ0=0.8994
Pa Pa Pa Pa Pa Pa Pa
σ0/σ 1-α=0.75 1-α=0.75 1-α=0.75 1-α=0.75 1-α=0.75 1-α=0.75 1-α=0.75
0.1 0.996553 0.997821 0.998278 0.999982 0.999992 1.000000 1.000000
0.2 0.972915 0.982740 0.986317 0.998905 0.999505 0.999951 0.999984
0.3 0.912835 0.943311 0.954656 0.988775 0.994713 0.998400 0.999449
0.4 0.810757 0.872377 0.896227 0.948108 0.973659 0.984333 0.993958
0.5 0.676290 0.770183 0.808471 0.852534 0.916856 0.926653 0.966817
0.6 0.530276 0.645404 0.694953 0.701011 0.809307 0.794636 0.888088
0.7 0.394212 0.512557 0.565301 0.523835 0.656072 0.601939 0.738963
0.8 0.281513 0.386777 0.432940 0.359710 0.483947 0.402688 0.540869
0.9 0.195837 0.278999 0.311258 0.231602 0.325551 0.243057 0.345314
1 0.134373 0.193961 0.209929 0.142859 0.201845 0.136252 0.194123
1.1 0.091829 0.131125 0.133037 0.086011 0.117093 0.072904 0.098012
1.2 0.062940 0.086955 0.079500 0.051277 0.064596 0.038063 0.045507
1.3 0.043468 0.057000 0.045031 0.030552 0.034409 0.019709 0.019883
1.4 0.030334 0.037172 0.024330 0.018372 0.017932 0.010235 0.008343
1.5 0.021424 0.024237 0.012627 0.011166 0.009242 0.005371 0.003419
1.6 0.015325 0.015862 0.006340 0.006884 0.004750 0.002861 0.001387
1.7 0.011104 0.010447 0.003101 0.004311 0.002450 0.001551 0.000562
1.8 0.008149 0.006938 0.001487 0.002743 0.001274 0.000858 0.000230
VOLUME NO.3(2013),ISSUE NO.09(SEPTEMBER) ISSN 2231-5756
INTERNATIONAL JOURNAL OF RESEARCH IN COMMERCE, IT & MANAGEMENT
TABLE 3.2 LOG-LOGISTIC DISTRIBUTION O.C. VALUES OF SELECTED RELIABILITY TEST PLANS FOR A GIVEN PRODUCER’S RISK
n=2,r=1 n=3,r=1 n=8,r=1 n=4,r=2 n=6,r=2 n=6;r=3 n=9;r=3 t/σ0=0.260613 t/σ0=0.09947 t/σ0=0.035877 t/σ0=0.267056 t/σ0=0.171122 t/σ0=0.333710 t/σ0=0.210630
Pa Pa Pa Pa Pa Pa Pa
σ0/σ 1-α=0.75 1-α=0.75 1-α=0.75 1-α=0.75 1-α=0.75 1-α=0.75 1-α=0.75 0.1 0.999965 0.999997 1.000000 1.000000 1.000000 1.000000 1.000000 0.2 0.999717 0.999980 0.999997 1.000000 1.000000 1.000000 1.000000 0.3 0.999045 0.999932 0.999990 0.999998 1.000000 1.000000 1.000000 0.4 0.997738 0.999838 0.999976 0.999991 0.999998 1.000000 1.000000 0.5 0.995589 0.999684 0.999954 0.999966 0.999994 0.999998 1.000000 0.6 0.992397 0.999454 0.999992 0.999900 0.999998 0.999990 0.999999 0.7 0.987967 0.999133 0.999873 0.999749 0.999996 0.999961 0.999997 0.8 0.982118 0.998706 0.999811 0.999448 0.999902 0.999875 0.999991 0.9 0.974684 0.998158 0.999731 0.998895 0.999803 0.999654 0.999975 1 0.965517 0.997475 0.999631 0.997560 0.999632 0.999152 0.999936 1.1 0.954495 0.996641 0.999508 0.996452 0.999353 0.998120 0.999853 1.2 0.941523 0.995642 0.999362 0.994164 0.998920 0.996174 0.999686 1.3 0.926536 0.994464 0.999189 0.990832 0.998272 0.992773 0.999376 1.4 0.909504 0.993092 0.998987 0.986161 0.997359 0.987213 0.998828 1.5 0.890434 0.991512 0.998754 0.979835 0.996032 0.978658 0.997910 1.6 0.869369 0.989711 0.998488 0.971527 0.994251 0.966198 0.996440 1.7 0.846390 0.987676 0.998187 0.960921 0.991880 0.948942 0.994182 1.8 0.821614 0.985393 0.997848 0.947727 0.988794 0.926130 0.990838 1.9 0.795193 0.982850 0.998747 0.931704 0.984852 0.897245 0.986058
TABLE 3.3 LOG-LOGISTIC DISTRIBUTION O.C. VALUES OF SELECTED RELIABILITY TEST PLANS FOR A GIVEN CONSUMER ’S RISK
TABLE 3.4 LOG-LOGISTIC DISTRIBUTION O.C. VALUES OF SELECTED RELIABILITY TEST PLANS FOR A GIVEN PRODUCER’S RISK
n=2,r=1 n=3,r=1 n=5,r=1 n=4,r=2 n=8,r=2
t/σ0=1.5 t/σ0=1.2 t/σ0=0.8994 t/σ0=1.5 t/σ0=0.8994
Pa Pa Pa Pa Pa
σ0/σ 1-α=0.90 1-α=0.90 1-α=0.90 1-α=0.90 1-α=0.90
0.1 0.993284 0.994834 0.996370 0.999932 0.999985
0.2 0.948111 0.959649 0.971400 0.995997 0.999084
0.3 0.839945 0.872144 0.907315 0.962666 0.999038
0.4 0.67629 0.730023 0.796478 0.852534 0.953654
0.5 0.494626 0.556159 0.647128 0.657511 0.861019
0.6 0.334511 0.386147 0.482007 0.438190 0.702189
0.7 0.214807 0.247511 0.328274 0.259802 0.504168
0.8 0.134373 0.149365 0.205322 0.142859 0.316068
0.9 0.083513 0.086664 0.119126 0.075613 0.174257
1 0.052245 0.049257 0.064991 0.039578 0.085976
1.1 0.033153 0.027827 0.033844 0.020848 0.038817
1.2 0.021424 0.01579 0.017067 0.011166 0.016410
1.3 0.014122 0.009063 0.008442 0.006115 0.006635
1.4 0.009498 0.005283 0.004140 0.003432 0.002612
1.5 0.006513 0.003136 0.002030 0.001975 0.001016
1.6 0.004551 0.001897 0.001001 0.001166 0.000395
1.7 0.003235 0.00117 0.000499 0.000705 0.000154
1.8 0.002338 0.000736 0.000252 0.000436 0.000000
n=2,r=1 n=3,r=1 n=5,r=1 n=4,r=2 n=8,r=2 t/σ0=0.052305 t/σ0=0.035076 t/σ0=0.021046 t/σ0=0.150224 t/σ0=0.070538 Pa Pa Pa Pa Pa
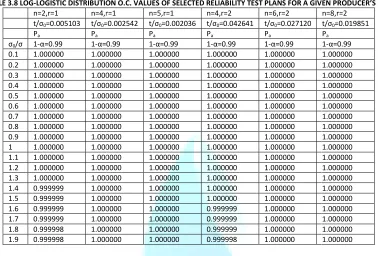
VOLUME NO.3(2013),ISSUE NO.09(SEPTEMBER) ISSN 2231-5756 TABLE 3.5 LOG-LOGISTIC DISTRIBUTION O.C. VALUES OF SELECTED RELIABILITY TEST PLANS FOR A GIVEN CONSUMER ’S RISK
n=2,r=1 n=3,r=1 n=6,r=1 n=4,r=2 n=6,r=2 n=10,r=2 t/σ0=2.2496 t/σ0=1.2 t/σ0=0.8994 t/σ0=1.5 t/σ0=1.2 t/σ0=0.8994 Pa Pa Pa Pa Pa Pa σ0/σ 1-α=0.95 1-α=0.95 1-α=0.95 1-α=0.95 1-α=0.95 1-α=0.95 0.1 0.977613 0.994833 0.995645 0.999782 0.999994 0.999976 0.2 0.840020 0.959648 0.965778 0.988531 0.996288 0.998539 0.3 0.585051 0.872143 0.889834 0.903477 0.964186 0.984930 0.4 0.334661 0.730022 0.761042 0.677225 0.851290 0.929760 0.5 0.170321 0.556139 0.593182 0.388282 0.639060 0.799619 0.6 0.083556 0.386147 0.416547 0.175065 0.392276 0.597436 0.7 0.041566 0.247511 0.262714 0.067431 0.198105 0.376686 0.8 0.021444 0.149360 0.149596 0.024212 0.085164 0.199193 0.9 0.011564 0.086664 0.077840 0.008633 0.032610 0.089457 1 0.006519 0.049250 0.037620 0.003171 0.011650 0.034954 1.1 0.003832 0.027827 0.017194 0.001219 0.004010 0.012237 1.2 0.002339 0.015790 0.007561 0.000493 0.001371 0.003953 1.3 0.001479 0.009060 0.003490 0.000210 0.000400 0.001210 1.4 0.000962 0.005280 0.001381 0.000000 0.000160 0.000359 1.5 0.000643 0.003135 0.000587 0.000000 0.000000 0.000105 1.6 0.000440 0.001897 0.000251 0.000000 0.000000 0.000000 1.7 0.000308 0.001170 0.000109 0.000000 0.000000 0.000000 1.8 0.000220 0.000736 0.000000 0.000000 0.000000 0.000000 1.9 0.000160 0.000471 0.000000 0.000000 0.000000 0.000000
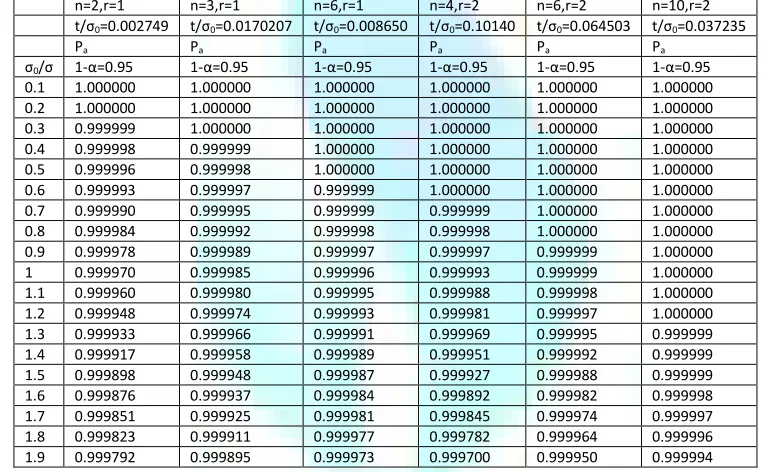
TABLE 3.6 LOG-LOGISTIC DISTRIBUTION O.C. VALUES OF SELECTED RELIABILITY TEST PLANS FOR A GIVEN PRODUCER’S RISK
n=2,r=1 n=3,r=1 n=6,r=1 n=4,r=2 n=6,r=2 n=10,r=2
t/σ0=0.002749 t/σ0=0.0170207 t/σ0=0.008650 t/σ0=0.10140 t/σ0=0.064503 t/σ0=0.037235
Pa Pa Pa Pa Pa Pa
σ0/σ 1-α=0.95 1-α=0.95 1-α=0.95 1-α=0.95 1-α=0.95 1-α=0.95
0.1 1.000000 1.000000 1.000000 1.000000 1.000000 1.000000
0.2 1.000000 1.000000 1.000000 1.000000 1.000000 1.000000
0.3 0.999999 1.000000 1.000000 1.000000 1.000000 1.000000
0.4 0.999998 0.999999 1.000000 1.000000 1.000000 1.000000
0.5 0.999996 0.999998 1.000000 1.000000 1.000000 1.000000
0.6 0.999993 0.999997 0.999999 1.000000 1.000000 1.000000
0.7 0.999990 0.999995 0.999999 0.999999 1.000000 1.000000
0.8 0.999984 0.999992 0.999998 0.999998 1.000000 1.000000
0.9 0.999978 0.999989 0.999997 0.999997 0.999999 1.000000
1 0.999970 0.999985 0.999996 0.999993 0.999999 1.000000
1.1 0.999960 0.999980 0.999995 0.999988 0.999998 1.000000
1.2 0.999948 0.999974 0.999993 0.999981 0.999997 1.000000
1.3 0.999933 0.999966 0.999991 0.999969 0.999995 0.999999
1.4 0.999917 0.999958 0.999989 0.999951 0.999992 0.999999
1.5 0.999898 0.999948 0.999987 0.999927 0.999988 0.999999
1.6 0.999876 0.999937 0.999984 0.999892 0.999982 0.999998
1.7 0.999851 0.999925 0.999981 0.999845 0.999974 0.999997
1.8 0.999823 0.999911 0.999977 0.999782 0.999964 0.999996
1.9 0.999792 0.999895 0.999973 0.999700 0.999950 0.999994
TABLE 3.7 LOG-LOGISTIC DISTRIBUTION O.C. VALUES OF SELECTED RELIABILITY TEST PLANS FOR A GIVEN CONSUMER’S RISK
VOLUME NO.3(2013),ISSUE NO.09(SEPTEMBER
INTERNATIONAL JOURNAL OF RESEARCH IN COMMERCE
TABLE 3.8 LOG-LOGISTIC DISTRIBUTION
n=2,r=1 n=4,r=1
t/σ0=0.005103 t/σ0=0.002542
Pa Pa
σ0/σ 1-α=0.99 1-α=0.99
0.1 1.000000 1.000000
0.2 1.000000 1.000000
0.3 1.000000 1.000000
0.4 1.000000 1.000000
0.5 1.000000 1.000000
0.6 1.000000 1.000000
0.7 1.000000 1.000000
0.8 1.000000 1.000000
0.9 1.000000 1.000000
1 1.000000 1.000000
1.1 1.000000 1.000000
1.2 1.000000 1.000000
1.3 1.000000 1.000000
1.4 0.999999 1.000000
1.5 0.999999 1.000000
1.6 0.999999 1.000000
1.7 0.999999 1.000000
1.8 0.999998 1.000000
1.9 0.999998 1.000000
FIGURES
LOG-LOGISTIC DISTRIBUTION
LOG-LOGISTIC DISTRIBUTION
LOG-LOGISTIC DISTRIBUTION EPTEMBER)
INTERNATIONAL JOURNAL OF RESEARCH IN COMMERCE, IT
LOGISTIC DISTRIBUTION O.C. VALUES OF SELECTED RELIABILITY TEST PLANS FOR A GIVEN PRODUCER’S RISK
n=4,r=1 n=5,r=1 n=4,r=2 n=6,r=2
=0.002542 t/σ0=0.002036 t/σ0=0.042641 t/σ0=0.027120
Pa Pa Pa
α=0.99 1-α=0.99 1-α=0.99 1-α=0.99
1.000000 1.000000 1.000000 1.000000
1.000000 1.000000 1.000000 1.000000
1.000000 1.000000 1.000000 1.000000
1.000000 1.000000 1.000000 1.000000
1.000000 1.000000 1.000000 1.000000
1.000000 1.000000 1.000000 1.000000
1.000000 1.000000 1.000000 1.000000
1.000000 1.000000 1.000000 1.000000
1.000000 1.000000 1.000000 1.000000
1.000000 1.000000 1.000000 1.000000
1.000000 1.000000 1.000000 1.000000
1.000000 1.000000 1.000000 1.000000
1.000000 1.000000 1.000000 1.000000
1.000000 1.000000 1.000000 1.000000
1.000000 1.000000 1.000000 1.000000
1.000000 1.000000 0.999999 1.000000
1.000000 1.000000 0.999999 1.000000
1.000000 1.000000 0.999999 1.000000
1.000000 1.000000 0.999998 1.000000
LOGISTIC DISTRIBUTION O.C. CURVESOF TABLE 3.1 (1-αααα=0.75) FOR A GIVEN CONSUMER’S RISK
LOGISTIC DISTRIBUTION O.C. CURVESOF TABLE 3.2 (1-αααα=0.75) ) FOR A GIVEN PRODUCER’S RISK
DISTRIBUTION O.C. CURVESOF TABLE 3.3 (1-αααα=0.90) FOR A GIVEN CONSUMER’S RISK
0
0.2
0.4
0.6
0.8
1
1.2
0
1
2
Figure 1
0
0.2
0.4
0.6
0.8
1
1.2
0
1
2
Figure 2
-0.2
0
0.2
0.4
0.6
0.8
1
1.2
0
1
2
Figure 3
ISSN 2231-5756
, IT & MANAGEMENT
O.C. VALUES OF SELECTED RELIABILITY TEST PLANS FOR A GIVEN PRODUCER’S RISK n=8,r=2
t/σ0=0.019851
Pa 1-α=0.99 1.000000 1.000000 1.000000 1.000000 1.000000 1.000000 1.000000 1.000000 1.000000 1.000000 1.000000 1.000000 1.000000 1.000000 1.000000 1.000000 1.000000 1.000000 1.000000
=0.75) FOR A GIVEN CONSUMER’S RISK
=0.75) ) FOR A GIVEN PRODUCER’S RISK
VOLUME NO.3(2013),ISSUE NO.09(SEPTEMBER LOG-LOGISTIC DISTRIBUTION
LOG-LOGISTIC DISTRIBUTION
LOG-LOGISTIC DISTRIBUTION
LOG-LOGISTIC DISTRIBUTION
LOG-LOGISTIC DISTRIBUTION
Figure 6
EPTEMBER)LOGISTIC DISTRIBUTION O.C. CURVESOF TABLE 3.4 (1-αααα=0.90) FOR A GIVEN PRODUCER’S RISK
LOGISTIC DISTRIBUTION O.C. CURVESOF TABLE 3.5 (1-αααα=0.95) FOR A GIVEN CONSUMER’S
LOGISTIC DISTRIBUTION O.C. CURVESOF TABLE 3.6 (1-αααα=0.95) FOR A GIVEN PRODUCER’S RISK
LOGISTIC DISTRIBUTION O.C. CURVESOF TABLE 3.7 (1-αααα=0.99) FOR A GIVEN CONSUMER’S RISK FIGURE 7
LOGISTIC DISTRIBUTION O.C. CURVESOF TABLE 3.8 (1-αααα=0.99) FOR A GIVEN PRODUCER’S RISK
0.9965
0.9975
0.9985
0.9995
1.0005
0
1
2
Figure 4
-0.2
0
0.2
0.4
0.6
0.8
1
1.2
0
1
2
Figure 5
0.99965 0.9997 0.99975 0.9998 0.99985 0.9999 0.99995 1 1.00005
0 1 2
Figure 6
Figure 6
-0.2
0
0.2
0.4
0.6
0.8
1
1.2
0
0.5
1
1.5
2
0.9998
0.99985
0.9999
0.99995
1
1.00005
0
1
2
Figure 8
ISSN 2231-5756 =0.90) FOR A GIVEN PRODUCER’S RISK
FOR A GIVEN CONSUMER’S RISK
=0.95) FOR A GIVEN PRODUCER’S RISK
=0.99) FOR A GIVEN CONSUMER’S RISK
VOLUME NO.3(2013),ISSUE NO.09(SEPTEMBER) ISSN 2231-5756
INTERNATIONAL JOURNAL OF RESEARCH IN COMMERCE, IT & MANAGEMENT
REQUEST FOR FEEDBACK
Dear Readers
At the very outset, International Journal of Research in Commerce, IT and Management (IJRCM)
acknowledges & appreciates your efforts in showing interest in our present issue under your kind perusal.
I would like to request you to supply your critical comments and suggestions about the material published
in this issue as well as on the journal as a whole, on our E-mail i.e.
[email protected]
for further
improvements in the interest of research.
If you have any queries please feel free to contact us on our E-mail
.
I am sure that your feedback and deliberations would make future issues better – a result of our joint
effort.
Looking forward an appropriate consideration.
With sincere regards
Thanking you profoundly
Academically yours
Sd/-