R E S E A R C H A R T I C L E
Open Access
Visual contrast sensitivity in patients with
impairment of functional independence after
stroke
Natanael Antonio dos Santos
†and Suellen Marinho Andrade
*†Abstract
Background:Stroke has been considered a serious public health problem in many countries, accounting for complex disorders involving perception, such as visual, cognitive and functional deficits. The impact of stroke on the visual perception of individuals with impairments in functional independence was investigated.
Methods:We measured changes in functional independence and visual function in 40 patients with stroke
(M = 52.3, SD = 0.65) and 10 controls (M = 52.5, SD = 0.66). The patients were divided into four subgroups following the Barthel Index (Group A: 20–35, serious dependence; Group B: 40–55, moderate dependence; Group C: 60–95, mild dependence; and Group D: 100 points, independence). Visual function was evaluated using the Contrast Sensitivity Function (CSF). The contrast threshold was measured using a temporal, two-alternative, forced-choice psychophysical method.
Results:The results show significant differences in CSF between healthy volunteers and patients with stroke (F (1.56) = 151.2, p < 0.001) for all frequencies (F (2.56) = 125.96, p < 0.001). The results also show that patients with low functional independence had lower contrast sensitivity than those with greater functional independence (F (3.56) = 344.82, p < 0.001).
Conclusions:An association exists between CSF and a worsening in the functional potential for performing daily living activities. Our results suggest that the CSF can be used as a diagnostic tool to analyze visual function associated with deficits in functional independence after stroke. These findings should be considered across the continuum of care for these patients.
Keywords:Contrast sensitivity, Stroke, Functional independence, Spatial frequency
Background
Stroke can be defined as a focal neurological deficit of pre-sumed vascular origin that starts suddenly and lasts for at least 24 hours, or until death if the patient dies within 24 hours after the onset of symptoms [1]. Stroke is the main cause of death and disability in many countries, mainly among medium and low-income individuals, accounting for more than 85% of worldwide mortality [2].
Stroke represents the main cause of functional impair-ment in the superior and inferior limbs of the injured patients and negatively affects their performance in the
activities of daily living. In 30 to 60% of cases, the upper limbs continue to be disturbed in function for up to 6 months after the stroke. After this time, only 5 to 20% of patients recover full mobility [3].
In addition to losses in functional capacity, patients may present with deficits in perception, demonstrating psychomotor, cognitive and visual impairment. The main problems with visual function related to vascular lesions are hemianopsy, amaurosis, hemispatial neglect and vis-ual agnosia. Such dysfunctions may reciprocally interact with patients’functional capacity [4].
Visual cognitive neuroscience, through non-invasive imaging techniques such as Contrast Sensitivity Func-tion (CSF), can objectively assess attributes of visual per-ception that are reduced after vascular lesion. The CSF * Correspondence:suellenandrade@gmail.com
†Equal contributors
Laboratório de Percepção, Neurociências e Comportamento, Departamento de Psicologia, Universidade Federal da Paraíba, João Pessoa, Brazil
is a classic instrument that is used as a clinical and the-oretical indicator of vision [5] and has been frequently used to assess and diagnose deficits resulting from changes in the retina [6], visual pathways [7] and even disorders that are not directly related to impairments in the visual system, such as Parkinson’s disease [8], mul-tiple sclerosis [9,10] and schizophrenia [11]. Currently, the CSF has been rarely studied in stroke patients [12], although it has importance as an objective tool because it is easy to apply and can be used as a diagnostic method for visual perceptual disorders and monitoring of the evolutionary process of stroke patients [13].
A lack of self-correction of visual control in order to detect different levels of contrast may cause processing changes in the integration of visual information with other systems, resulting in a decrease in the adaptability of an individual to the basic requirements of daily life [14]. In a study using the Visual Function Quality of Life Questionnaire, Zhao et al. [15] found a strong associ-ation between quality of life and visual function in patients who underwent cataract surgery, demonstrating the impact of loss of visual ability for patients. Analyzing 175 patients with brain damage, Lew et al. [16] found that visual impairment contributed to reduced gains in total (t =−2.25) and motor (t =−2.50) FIM (Functional Independence Measure) scores (p < 0.05) and that visual impairment may be detrimental to functional recovery during the rehabilitation process.
Thus, the objective of this study was to analyze the thresholds of contrast sensitivity in patients after stroke having different levels of functional independence, using low, medium and high spatial frequencies, and to compare their performance with a group of healthy individuals.
Methods
A retrospective, ex post facto study was performed using a repeated measures design. All participants were sub-jected to the same randomly presented spatial frequen-cies. The design was formed by two independent variables (spatial frequencies and group) and one dependent variable (threshold or contrast sensitivity).
Participants
Fifty volunteers participated in this study. These volun-teers were selected for their accessibility and age
(between 40 and 65 years old). Forty of the volunteer patients had suffered a stroke (the Experimental Group, EG, (M = 51.02, SD = 0.65)), and 10 were healthy volun-teers (the Control Group, CG, (M = 52.5, SD = 0.66)). The patients were divided into four subgroups, each with 10 participants, according to their level of func-tional independence, which was determined based on the Barthel Index: Experimental Group A (EGA), 20–35 points, serious dependence; Experimental Group B (EGB), 40–55 points, moderate dependence; Experimen-tal Group C (EGC), 60–95 points, mild dependence; and Experimental Group D (EGD), 100 points, independence [17]. There were 5 women and 5 men in each group (CG, EGA, EGB, EGC, and EGD). Table 1 presents the demographic and clinical data of the participants.
The inclusion criteria adopted in the study included diagnosis of non-recurring unilateral ischemic stroke, acute stage (occurring at least one month after the vascu-lar event), having injuries to the middle cerebral artery and normal or corrected visual acuity. Data were obtained from medical records and Functional Resonance Magnetic Imaging (fMRI). Participants in the Control Group were healthy individuals who were accompanying the patients or working in the institution where the experiment was performed. The pathology diagnosis was performed based on ICD-10 (International Statistical Classification of Dis-eases and Related Health Problems).
Exclusion criteria were hemorrhagic stroke, recurring, ex-tensive cerebral lesion, incapability of completing the inter-view and assessment due to serious aphasia, psychiatric dysfunctions, ocular diseases, unconsciousness or use of drugs that modulate activity of the central nervous system, serious functional independence, with total dependence cor-responding to a score lower than 15 on the Barthel Index.
All participants underwent prior ophthalmologic as-sessment, which included anamnesis and
ophthalmo-logical examination. The examination included:
determination of visual acuity, external examination, an-terior segment biomicroscopy, tonometry, gonioscopy, fundus examination and determination of biometric eye data, such as corneal curvature (keratometry), axial diameter (biometry), corneal thickness (pachymetry) and corneal diameter.
Only participants with visual acuity or corrected acuity, as analyzed by the Snellen chart, and who were not
Table 1 Personal data and neuropsychological assessment (Mean±SD) arranged by group
Group CG EGA EGB EGC EGD Post hoc p
Age 51.7±2.8 51.3±2.2 50.2±1.8 50.6±2.5 52.0±2.6 ns
Education (years) 6.4±2.1 5.7±1.4 6.1±1.9 5.1±2.6 5.3±1.5 ns
Frontal Assessment 17.3±1.3 16.5±0.7 16.1±0.3 16.7±0.4 16.4±0.6 ns
Mini Mental State Examination 29.2±0.2 20.7±1.1 21.8±1.6 24.3±1.2 24.6±1.9 ns
suffering from eye diseases were admitted to the study. This exclusion reduces the possibilty of creating bias in the com-parison, because variables such as degree of stromal hydra-tion, presence of cataracts, glaucoma, or even changes in intraocular pressure can have a very significant effect on visual function and may affect interpretation of the data. There were no changes in the visual field of the partici-pants. The presence of hemineglect was evaluated using the Letter Cancellation Test (p>0.05).
Table 2 presents the average ocular biometric data; based on t-tests, there were no significant differences be-tween healthy subjects and patients.
Functional dependence was assessed based on the Barthel Index. This index measures the level of assist-ance demanded by an individual in 10 items of Activities of Daily Living (ADL), which involve mobility and per-sonal care. The levels of measurement range from complete independence to the need for assistance. Each item of performance is assessed on an ordinal scale, and a specific number of points is marked for each level or classification. Different measures were established for each item, based on clinical judgment and other implicit criteria. Example scores include: 0 (dependent), 5 (need for help or supervision), 10 (partially dependent) and 15 (independent). The latter score is considered only for chair and bed transference or ambulation. In total, there are 100 possible points that define the level of depend-ence of a person (0 – 15 = total dependence; 20 – 35 = serious dependence; 40–55 = moderate dependence; 60–95 = mild dependence; and 100 = independent). This scale, which was developed for assessing the level of de-pendence in elderly patients or those who have serious sequels, for instance stroke, has been used since 1965, and its use is recommended by the World Health Organization (WHO) because it is easy to apply and can be adapted to different cultures [18].
For the Control Group, a Cumulative Illness Research Scale (CIRS) was applied to guarantee the participation of healthy individuals in this group. This scale investi-gates the presence of 14 disease sets (cardiac, vascular, hematological, respiratory, ocular, upper and lower
gastrointestinal tract, hepatic and pancreatic, renal, geni-tourinary, musculoskeletal and integumental, neurologic, endocrine-metabolic, breast and psychiatric), taking into consideration situations in which each set of diseases is absent, mild, moderate, severe or extremely severe, with scores ranging from 0 to 4, respectively [19].
The participants were informed about the study proto-col and the objective of the experiment. Subjects signed informed consent forms according to Resolution n° 196/ 96 of the Brazilian National Health Council (Health Ministry, Brazil), which determines guidelines for re-search involving human beings in compliance with the Declaration of Helsinki. The local Ethics Committee approved this research (Protocol # 249/09).
Equipment and stimuli
The stimuli were set to appear in the center of a 19-inch video monitor (LG) CRT (Cathode Ray Tube) with high resolution (1024 x 768) and a 70-Hz frame rate. Input was controlled by a microcomputer through a video board with VGA and DVI connectors. The voltage lumi-nance of the monitor was expanded from 8 to 14 bits using BITS++ (Cambridge Research Systems, Rochester, Kent, England, 2002), allowing the use of visual stimuli with lower contrast gradations. LightScan software, equipped with OptiCAL Photometry (Cambridge Re-search Systems, Rochester, Kent, England, 2002), was used to measure screen luminance and gamma correct the monitor using 48 index values ranging from 0 to 255 (gamma = 1.8) as a sample. The lowest and highest lumi-nance values of the screen were 0.20 cd/m2and 80.0 cd/ m2(mean luminance = 40.1 cd/m2). The room was 2.5 x 2.0 m in size and was illuminated by a fluorescent 20 W bulb (Philips). The walls of the room were gray, which allowed for better control of the room lightning condi-tions during the experiment. A C++ computer program, developed by the responsible lab, was used to run the experiment (generating the stimuli, controlling stimuli presentation and registering contrast thresholds).
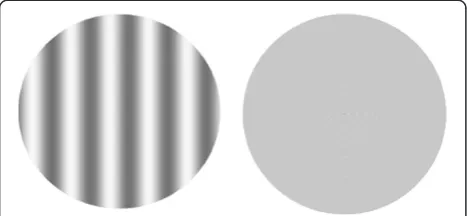
Achromatic and vertical static sine-wave grating stim-uli with spatial frequencies of 0.6, 2.5 and 10.0 cycles per degree (cpd) of visual angle were used in this work (Figure 1).
All of the stimuli had a diameter of approximately 7.2 degrees of visual angle and were designed to be pre-sented in the middle of the monitor at a distance of 150 cm from the observer.
Procedure
Estimates were obtained using the psychophysical method of forced choice between two temporal alterna-tives [20]. This method is based on the probability of consecutive correct choices being made by participants; that is, in 100 presentations of a choice between two Table 2 Differences between the means of groups
(Control and Experimental) in relation to axial diameter, corneal diameter, central corneal thickness and
keratometry
Categories Group
t p
Axial Diameter 0.43 0.54
Corneal Diameter 0.21 0.84
Central Corneal Thickness 0.17 1.20
Keratometry 0.49 0.93
stimuli, the spatial frequency (test stimulus) is perceived by the participant in 79% of the presentations. The pro-cedure for measuring the threshold for each frequency was successive presentation of pairs of stimuli, from which the participant had to choose which had the spatial frequency of interest. The other stimulus was al-ways a homogeneous pattern of mean luminance 40.1 cd/m2. The criterion adopted to vary the contrast of each tested spatial frequency was three consecutive correct choices for decreasing by unity and an incorrect choice for increasing by the same unity (20%) [21].
An experimental session began with a brief beep fol-lowed by the presentation of a 2 s stimulus (test or neu-tral) with an inter-stimulus interval of 1 s and presentation of the second stimulus for 2 s, followed by the volunteers’ response. The interval between stimuli pairs and trials was 3 s. A different beep gave feedback to the volunteer for each correct choice. The order of presentation of the stimuli was random.
The participants received the following instructions: “pairs of stimuli, one with clear-dark stripes and another totally gray, will be presented. You must always choose the stimulus that contains the stripes, pressing the but-ton on the left (butbut-ton number 1) of the mouse when the stimulus with stripes is presented first, and the but-ton on the right (butbut-ton number 2) when it is presented in the second place (after the gray stimulus)”. Each ses-sion began with the test stimulus contrast at supra-threshold level, and the experiments began only when the investigator was convinced that the participant understood the directions and responded as instructed.
The experimental session varied in duration (with an average time ranging from 10 to 15 minutes) depending on the correct and incorrect choices made by the volun-teer, until a total of six reversals (or six contrast values, three peaks and three valleys) were obtained. Each one of the points (or frequencies) of the contrast sensitivity curve was estimated at least twice (two experimental sessions), on different days, for each of the participants.
All of the estimates were measured with binocular vision and natural pupil.
Descriptive statistics (Mean and SD) were used to analyze the clinical and demographic groups. A two-tailed Student t-test for paired samples was used to verify differ-ences between the ocular conditions of control subjects and affected individuals. We used Analysis of Variance (ANOVA) to determine whether there were significant dif-ferences between the groups. Simple difdif-ferences between treatments were adjusted using a post hoc Tukey HSD test, and the level of significance was p < 0.05.
Results
After each session, the program produced a result sheet with the experimental results and the contrast values obtained by the reversals. Contrast values for each fre-quency were grouped into spreadsheets by condition, ei-ther Experimental Group (EG) or Control Group (CG), and the mean value was used as an estimate of the con-trast sensitivity to each tested spatial frequency.
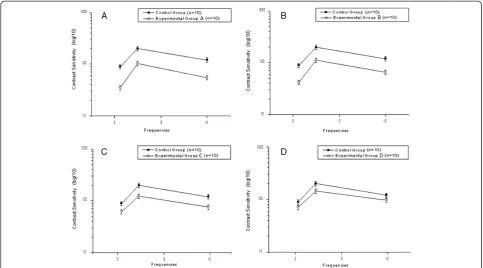
(Figure 2) displays the contrast sensitivity curve for spatial frequencies for each Experimental Group (A, B, C, and D) compared to the Control Group. The contrast threshold can be defined as 1/CSF, i.e., the inverse of the contrast sensitivity curve. Thus, high threshold values indicate low sensitivity and vice versa. The vertical bars in the figure indicate the standard error of the mean with 99% confidence intervals, corrected for sample size using Student’s t-test.
The contrast sensitivity curves present similar profiles. All of the groups obtained a maximum sensitivity of 2.5 cpd spatial frequency, with reductions in the extremes of the curves. The participants in the Control Group were more sensitive than the participants in Experimental Groups A, B, C and D, with spatial frequencies of 2.9; 2.7; 2.4 and 2.1, respectively. These values were calculated as the arithmetic mean of the differences for detecting the stimulus contrast, such as the sinusoidal sine-wave grat-ing, for the three tested frequencies. It was observed that an increase in functional independence, represented by a higher score on the Barthel Index, corresponded to a higher sensitivity in the detection of spatial frequencies when compared to all experimental groups.
The ANOVA showed significant differences between the condition (Experimental or Control Group, F (1.56) = 151.23, p < 0.001), between frequencies (F (2.56) = 125.96, p < 0.001), between functional independ-ence (F (3.56) = 344.82, p < 0.001), and significant inter-actions of frequency versus condition (F (2.56) = 35.67, p < 0.001), frequency versus functional independence (F (3.56) = 52.46, p < 0.001), and frequency versus condition versus functional independence (F (3.56) = 20.37, p < 0.001). The post hoc Tukey HSD showed that patient groups A, B, C and D presented higher contrast
sensitivity for sine-wave grating than the Control Group for all tested frequencies (p < 0.001).
Discussion
The data showed that contrast sensitivity for sine-wave grating was better in the Control Group than in the Ex-perimental Group, suggesting that healthy individuals have mean contrast thresholds that are higher than those of patients who have suffered a stroke. Changes in the CFS after stroke were also verified in a study by Bullens et al. [22], in which contrast sensitivity was analyzed in 16 patients with unilateral ischemic lesions involving posterior visual space. The authors observed that 62% of the patients presented a loss of contrast sensitivity for the orientation of horizontal or vertical stimuli. The authors also observed that visual perception was dis-torted in a qualitatively different way that depended on the anterior-posterior location of the lesion.
The results of this study showed that the maximum contrast sensitivity at photopic levels of luminance oc-curred at the frequency of 2.5 cpd for sine-wave grating in both groups, with a reduction of sensitivity at the extremes of the curves. These results, which were obtained with a luminance of 40.1 cd/m2, when compared to the data found in the literature [23], show that using photopic luminance moves the maximum sensitivity zone to the right of the CSF. The classic definition for a CFS
function is an upside-down“U”-shaped curve, as found in similar studies that used Cartesian visual stimuli [24].
The results suggested differences between the degrees of functional independence and an interaction between fre-quency and functional independence. Overall, these data indicate an association between CSF and a worsening in the functional potential for performing activities of daily living. The results match data obtained by Wolter and Preda [25], who found that patients may present deficits in contrast sensitivity after stroke that can affect their in-dependence for visual perception or adaptation to the en-vironment. These patients generally complain that there is not enough light or that there is too much light in the en-vironment, and this contrast sensitivity can cause pro-blems with glow and the contour detection of objects. This phenomenon is frequently related to functional and neurological compromise, such as difficulty in performing activities of daily living, reading and mobility tasks.
Neuropsychological and psychophysical studies show that stimuli, such as sine-wave gratings, are processed by the primary visual cortex (V1) [26]. Thus, the results obtained show a relationship between the degree of func-tional incapacity resulting from stroke and the comprom-ise of the visual area involved in the processing of such stimuli.
Studies on the attention and detection of spatial fre-quencies suggest that cortical mechanisms are involved
Figure 2Contrast sensitivity to sine-wave gratings.Contrast Sensitivity Curves for Spatial Frequencies of Patients with Functional
in the selection of specialized information for high and low spatial frequencies. However, such processes appear to be related to specific neural operations and are dependent on the affected area and the type of task pre-sented [27,28]. Thus, electrophysiological and neuroima-ging studies involving demands from different locations and types of tasks could contribute to the understanding of the mechanisms of information processing involving injury to the right and left hemispheres.
Unfortunately, our study did not have sufficient power to stratify and analyze patients according to the mechan-isms through which the injuries occurred. Further stud-ies comparing inpatient rehabilitation populations could address this issue.
The CSF is related to age, and aging can cause the onset of degenerative eye diseases. This study did not verify any interaction between these factors that could contribute to a limitation in the analysis and interpret-ation of the data. Considering the limiting effects that some age-related eye diseases pose to patients in their daily activities, future research aiming to analyze the im-pact of stroke in patients with cataracts, glaucoma and macular degeneration, for example, may contribute to the development of effective therapeutic measures. Fol-lowing stroke, the importance of ophthalmic evaluation should be considered during routine care of these patients to prevent complications and reduce the degree of disability.
Conclusions
The data obtained from this study suggest a relationship between stroke and disorders in the detection of spatial frequencies, emphasizing the importance of CSF as a prognostic tool for relevant patients. CSF is associated with the analysis of functional perturbations and the main difficulties found in performing everyday activities.
Competing interests
The authors declare that they have no competing interests.
Authors' contributions
NAS conceived of the study and participated in its coordination and helped to draft the manuscript. SMA participated in the design of the study and performed the statistical analysis and drafted the manuscript. All authors read and approved the final manuscript.
Funding
This paper was funded by National Counsel of Technological and Scientific Development (CNPq), Brazil–Process # 303822/2010-4.
Received: 7 November 2011 Accepted: 23 August 2012 Published: 12 September 2012
References
1. Ikram MA, Seshadri S, Bis JC, Fornage M, DeStefano AL, Aulchenko YS, Debette S, Lumley T, Folsom A, van den Herik E, Bos M, Beiser A, Cushman M, Launer L, Shahar E, Struchalin M, Du Y, Glazer N, Rosamond W, Rivadeneira F, Kelly-Hayes M, Lopez O, Coresh J, Hofman A, DeCarli C, Heckbert S, Koudstaal P, Yang Q, Smith N, Kase C,et al:Genomewide Association Studies of Stroke.N Engl J Med2009,360:1718–28.
2. Hartigan I, O’Connell E, McCarthy G, O'Mahony D:First time stroke survivors' perceptions of their health status and their goals for recovery.
International Journal of Nursing and Midwifery2011,3:22–29. 3. Bovolenta F, Sale P, Dall'Armi V, Clerici P, Franceschini M:Robot-aided
therapy for upper limbs in patients with stroke-related lesions - Brief report of a clinical experience.J Neuroeng Rehabil2011,9:8–18. 4. Umphred D:Neurological Rehabilitation. St. Louis: Mosby; 2006. 5. McKendrick AM, Sampson GP:Low spatial frequency contrast sensitivity
deficits in migraine are not visual pathway selective.Cephalalgia2009,
29:539–549.
6. Owsley C, Jackson GR, Cideciyan AV, Huang Y, Fine SL, Ho AC, Maguire MG, Lolley V, Jacobson SG:Psychophysical evidence for rod vulnerability in age-related macular degeneration.Investig Ophthalmol Vis Sci2000,
41:267–273.
7. Wesner MF, Tan J:Contrast sensitivity in seasonal and nonseasonal depression.J Affect Disord2006,95:19–28.
8. Regan D, Silver R, Murray T:Visual acuity and contrast sensitivity in multiple sclerosis-hidden visual class.Brain1997,100:563–579.
9. Balcer L, Baier ML, Cohen JA, Kooijmans MF, Sandrock AW, Nano-Schiavi ML, Pfohl DC, Mills M, Bowen J, Ford C, Heidenreich FR, Jacobs DA, Markowitz CE, Stuart WH, Ying GS, Galetta SL, Maguire MG, Cutter GR:Contrast letter acuity as a visual component for the multiple sclerosis functional composite.Neurology2003,61:1367–1373.
10. Mestre D, Blin O, Serratrice G, Pailhous J:Spatiotemporal contrast sensitivity differs in normal aging and Parkinson's disease.J. Neurology
1990,40:1710–1714.
11. Keri S, Benedek G:Visual contrast sensitivity alterations in inferred magnocellular pathways and anomalous perceptual experiences in people at high-risk for psychosis.Vis Neurosci2007,24:183–189. 12. Khan S, Leung E, Jay W:Stroke and Visual Rehabilitation.Top Stroke
Rehabil2008,15:27–36.
13. Godefroy O, Bogousslavsky J:The behavioral and cognitive neurology of stroke. Cambridge: Cambridge University Press; 2007.
14. O'Sullivan S, Schmitz T:Fisioterapia: Avaliação e tratamento. São Paulo: Manole; 2010.
15. Zhao J, Sui R, Jia L, Fletcher A, Ellwein L:Visual acuity and quality of life outcomes in patients with cataract in Shunyi County, China.Am J Ophthalmol1998,126:515–23.
16. Lew H, Garvert D, Pogoda T, Hsu P, Devine J, White D, Myers P, Goodrich G:
Auditory and visual impairments in patients with blast related traumatic brain injury: Effect of dual sensory impairment on Functional
Independence Measure.Journal of Rehabilitation Research & Development
2009,46:819–826.
17. Roth D, Haley WE, Clay OJ, Perkins M, Grant JS, Rhodes JD, Wadley VG, Kissela B, Howard G:Race and Gender Differences in 1-Year Outcomes for Community-Dwelling Stroke Survivors With Family Caregivers.Stroke
2011,42:626–631.
18. Mishra N, Shuaib A, Lyden P, Diener HC, Grotta J, Davis S, Davalos A, Ashwood T, Wasiewski W, Lees KR:Stroke Acute Ischemic NXY Treatment I Trialists: Home Time Is Extended in Patients With Ischemic Stroke Who Receive Thrombolytic Therapy - A Validation Study of Home Time as an Outcome Measure.Stroke2011,42:1046–1050.
19. Navega M, Oishi J:Comparação da Qualidade de Vida Relacionada à Saúde entre Mulheres na Pós-menopausa Praticantes de Atividade Física com e sem Osteoporose.Rev Bras Reumatol2007,47:258–64.
20. Wetherill GB, Levitt H:Sequential estimation of points on a psychometric function.Br J Math Stat Psychol1965,48:1–10.
21. Santos NA, Alencar CG, Dias YHN:Contrast sensitivity function of sine-wave gratings in children with acute malnutrition.Psychology & Neuroscience2009,2:11–15.
22. Bulens C, Meerwaldt JD, Wildt GJ, Keemink CJ:Spatial contrast sensitivity in unilateral cerebral ischaemic lesions involving the posterior visual pathway.Brain1989,112:507–20.
23. Adams RJ, Courage ML:Using a single test to measure human contrast sensitivity from early childhood to maturity.Vis Res2002,42:1205–1210. 24. Leguire L, Algaze A, Kashou N, Lewise J, Roger G, Roberts C:Relationship among fMRI, contrast sensitivity and visual acuity.Brain Research2011,
1367:162–169.
25. Wolter M, Preda S:Visual deficits following stroke: maximizing participation in rehabilitation.Topics in Stroke Rehabilitation2006,
26. Gallan J, Braun J, Essen D:Selectivity for Polar, Hyperbolic, and Cartesian Gratings in Macaque Visual Cortex.Science1993,259:100–103. 27. Paquet L, Merlkle P:Global precedence: The effects of exposure duration.
Can J Psychol1984,38:45–53.
28. Gilbert C, Wiesel T:The influence of contextual stimuli on the orientation selectivity of cells in the primary visual cortex of the cat.Vis Res1990,
30:1689–1701.
doi:10.1186/1471-2377-12-90
Cite this article as:dos Santos and Andrade:Visual contrast sensitivity in patients with impairment of functional independence after stroke.BMC Neurology201212:90.
Submit your next manuscript to BioMed Central and take full advantage of:
• Convenient online submission
• Thorough peer review
• No space constraints or color figure charges
• Immediate publication on acceptance
• Inclusion in PubMed, CAS, Scopus and Google Scholar
• Research which is freely available for redistribution