R E S E A R C H
Open Access
Non-invasive algorithm for bowel motility
estimation using a back-propagation neural
network model of bowel sounds
Keo-Sik Kim
1†, Jeong-Hwan Seo
2†and Chul-Gyu Song
1,3** Correspondence: [email protected] 1School of Electronics and Information Engineering, Chonbuk National University, 664-14 1 Ga, Deokjin-dong, Jeonju, Republic of Korea
Full list of author information is available at the end of the article
Abstract
Background:Radiological scoring methods such as colon transit time (CTT) have been widely used for the assessment of bowel motility. However, these radiograph-based methods need cumbersome radiological instruments and their frequent exposure to radiation. Therefore, a non-invasive estimation algorithm of bowel motility, based on a back-propagation neural network (BPNN) model of bowel sounds (BS) obtained by an auscultation, was devised.
Methods:Twelve healthy males (age: 24.8 ± 2.7 years) and 6 patients with spinal cord injury (6 males, age: 55.3 ± 7.1 years) were examined. BS signals generated during the digestive process were recorded from 3 colonic segments (ascending, descending and sigmoid colon), and then, the acoustical features (jitter and shimmer) of the individual BS segment were obtained. Only 6 features (J1, 3, J3, 3, S1, 2, S2, 1, S2, 2, S3, 2), which are
highly correlated to the CTTs measured by the conventional method, were used as the features of the input vector for the BPNN.
Results:As a results, both the jitters and shimmers of the normal subjects were relatively higher than those of the patients, whereas the CTTs of the normal subjects were relatively lower than those of the patients (p< 0.01). Also, throughk-fold cross validation, the correlation coefficient and mean average error between the CTTs measured by a conventional radiograph and the values estimated by our algorithm were 0.89 and 10.6 hours, respectively.
Conclusions:The jitter and shimmer of the BS signals generated during the peristalsis could be clinically useful for the discriminative parameters of bowel motility. Also, the devised algorithm showed good potential for the continuous monitoring and estimation of bowel motility, instead of conventional radiography, and thus, it could be used as a complementary tool for the non-invasive
measurement of bowel motility.
Background
Radiological scoring methods such as the Barr and Blethyn scores [1] and colon transit time (CTT) [2,3], which operate by means of X-rays and magnetic resonance imaging (MRI), have generally been used for the assessment of bowel motility. Among these methods, the CTT described by Metcalf [2] is considered to be the gold-standard. It is simply assessed by measuring the movement of radiopaque markers taken at a fixed time after their ingestion. This test is highly reproducible and most useful in
determining whether constipation symptoms are associated with normal or slow tran-sit. However, these radiograph-based methods need an expensive, cumbersome radiolo-gical instrument and their frequent exposure to radiation.
In an effort to resolve these limitations, assessing bowel motility using bowel sound (BS) signals obtained by means of auscultation has been recently attempted. Tomo-masaet al. [4] and Craineet al.[5,6] presented changes in various features (sound-/ motility-index, sound-to-sound interval, number of events and so on) of bowel sound according to the pathological condition. Yamaguchi et al. [7] showed that the sound index of the gastro-duodenal sound in the diabetes mellitus patients was significantly lower after food intake than in healthy adults. Also, wavelet-based strategies for the signal acquisition, de-noising, automated segmentation, event detection and feature extraction of bowel sounds were proposed [8-11]. Dimoulas et al.[12] implemented an autonomous BS monitoring system utilizing wavelet feature extraction and multi-layer perceptrons (MLP) network classifiers for the pattern classification of BS segments. Besides, the fractal-dimension analysis of BS signals [9,10,13], principal component analysis (PCA) [14], Weiner filtering [15] and hybrid expert system using hierarchical audio pattern recognition [16] have been tried to detect the informative feature of BS and evaluate the bowel motility via an auscultation. These BSs are generated from the movement of the intestinal contents and gas in the lumen of the gastrointestinal tract during peristalsis; therefore, they can be used clinically as useful indicators of bowel motility.
Therefore, the aim of this study is to develop a non-invasive estimation algorithm of bowel motility, based on an artificial neural network (ANN) model of the jitter and shimmer, which were considered as useful features in recent study [17], of the BS sig-nals during the digestive process. Also, we derived an ANN model between the acous-tical features obtained from the BS signals and measured CTT, and finally determined the feasibility of the proposed method.
Methods
Twelve healthy men (age: 24.8 ± 2.7 years, BMI: 23.6 ± 2.7 kg/m2), not taking any medication that might affect their bowel motility, and 6 patients (6 men, age: 55.3 ± 7.1 years, BMI: 24.0 ± 3.5 kg/m2) with delayed gastric emptying due to spinal cord injury were examined. The average number of months after injury was 17.2 ± 28.5 months. Ethical approval for this study was obtained from the Institutional Review Board (IRB) of Chonbuk National University Hospital.
The total CTTs were measured by the strategy described by Metcalf et al. [2]. The subject ingested a radiopaque marker capsule containing 20 markers (Kolomark™, Korea) each day for 3 days. On days 4 and 7, an abdominal X-ray image was obtained. Also, on day 7, the 3-channel BS signals were obtained from the right upper (ascend-ing colon, CH1), left upper (descend(ascend-ing colon, CH2) and left lower quadrants (sigmoid colon, CH3) of the abdomen with the subjects lying on a bed, respectively. Under fast-ing conditions, the subjects took test meals of 200 g at 9:00 AM. After that, the data was recorded for 10 minutes at 9:30 AM (Post1), 1:00 PM (Post4) and 5:00 PM (Post8). The subjects were asked to take no food from 9:30 AM to 5:00 PM.
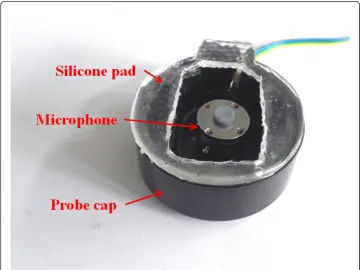
content of the BS signals is known to be energetic mainly between 100 and 500 Hz [11,18], thus the collected BS signals were pre-processed through a 60 Hz notch filter for removing the power noise and 5-600 Hz band-pass filter for reducing the motion artefact noise caused by respiration activation and unwanted noise. After that, the signals were digitized by an A/D converter (USB-6009, National Instruments™, U.S.) at a sampling rate of 8 KHz and resolution of 14 bits. Figure 1 shows the sensor-adaptation set-up of the noncontact-type probe used for recording BS signals.
The statistical analysis was conducted using SPSS (ver. 14, SPSS Inc., U.S.) software. Unpaired T-test was performed to compare the features obtained from the normal subjects with those from the patients. Also, Pearson’s correlation coefficients were obtained to evaluate the relationship between the acoustical features by means of our algorithm and CTT by means of the conventional method. The level of statistical sig-nificance was set as p< 0.05. Finally, k-fold cross-validation was performed to evaluate the performance of our algorithm.
Bowel motility estimation
BS detection and segmentation
Figure 2 shows the procedure used for detecting selectively the BS segments from noisy BS signals and extracting the features, in order to estimate the CTT using the ANN model. First, the recorded BS signals were processed using the modified iterative kurtosis-based detection (mIKD) algorithm, devised in our previous study [17], for the selective detection of BS segments through noise-gating. Significant deviations from kurtosis value can be attributed to the presence of non-Gaussian signals such as the BS, since kurtosis is theoretically zero for Gaussian signals such as back-ground sound
(BGSs) signals [19]. Next, the detected BS signals were divided into the individual BS segments, where an individual BS segment is defined as sounds having duration larger than 20 msec without the period of silence [11].
Feature extraction
The characteristic parameters, viz. the absolute jitter (Jch, t) and shimmer (Sch, t), of each BS segment, were calculated using (1) and (2), respectively;
Jch,t=
1
N−1
N−1
i=1 | 1
Pi −
1
Pi+1|
(1)
Sch,t=
1
N−1
N−1
i=1 |20 log(Ai+1/Ai)| (2)
wherePi,AiandNare the peak-to-peak period and amplitude of each pitch and the number of pitches, whilechandtare the channel number (1 = CH1, 2 = CH2 and 3 = CH3) and time index (1 = Post1, 2 = Post4 and 3 = Post8) when the BSs were recorded, respectively. The jitter is the average absolute difference between consecutive periods, while the shimmer is the average absolute difference between the amplitudes of consecutive periods in decibels [20].
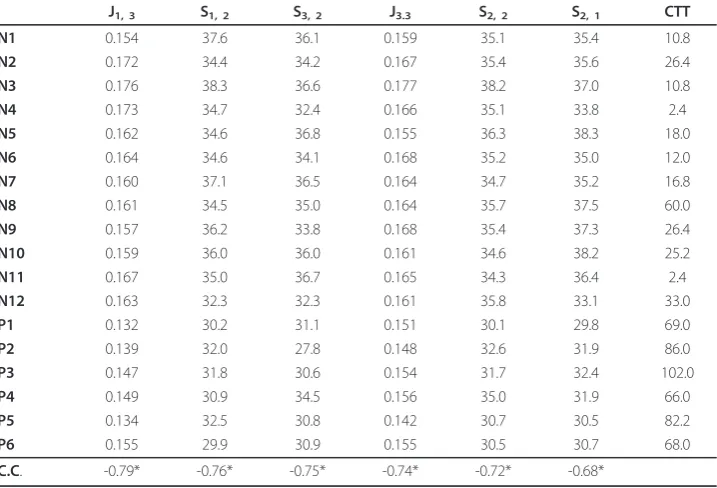
A total of 18 features (theJch, tof 9 andSch, tof 9) per subject were obtained. Among all of these 18 features, the features highly correlated with the measured CTT were selected as the informative one through correlation analysis. As a result, only the top six features (J1, 3, S1, 2, S3, 2, J3, 3, S2, 2, S2, 1) with the high correlation coefficient of 0.65 and over were used as the features of the input vector for the ANN. Table 1 represents the correlation coefficients between the selected features and CTT and theirp-values.
Architecture of the ANN
The estimation of the CTT was performed using a back-propagation neural network (BPNN). The input and output layers of the BPNN consisted of 7 nodes (selected 6
features and 1 bias) and 1 node (estimated CTT, eCTT), respectively. The training of a network by back-propagation involves three stages; the feed forward of the input train-ing pattern, the calculation and back-propagation of the associated error, and the adjustment of the weights. After training, the application of the net involves only the computations of the feed-forward phase [21].
Also, the performance of a BPNN can depend on its structure such as the learning rate and number of hidden nodes. Thus, we determined their practical values which can provide the best performance, i.e. the least error and best correlation between the measured CTT and estimated one. The values of learning rate tested were 0.05, 0.1, 0.2, 0.3 and 0.4 (5 cases), and the values of the number of hidden nodes were 2, 3, 4 and 5 (4 cases).
Results
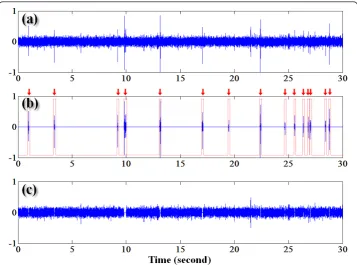
Figure 3 shows (a) the raw signals obtained from healthy subject (31-year-old male, ascending colon at Post1), (b) BS segments detected by the mIKD algorithm and (c) background noise. As shown in the output of the mIKD (in Figure 3b), our algorithm could sensitively separate even the low peaks (e.g. around time 19.5 seconds) although they were hard to be distinguished from BGSs by means of visual or auditory inspec-tion. On the contrary, the high peak (e.g. around 21.5 seconds) was classified as BGS since the kurtosis value of the corresponding segment was almost zero. These results show the performance of the mIKD algorithm used for selectively detecting inherent BS segments, despite the difference in the BGS level and in BSs amplitude and number.
Firstly, in order to determine the availability of the jitter and shimmer used in our algorithm, we compared the values of the selected features obtained from the normal
Table 1 Correlation coefficients (C.C.) between the selected features and measured colon
transit time (CTT) and theirp-values
J1, 3 S1, 2 S3, 2 J3.3 S2, 2 S2, 1 CTT
N1 0.154 37.6 36.1 0.159 35.1 35.4 10.8
N2 0.172 34.4 34.2 0.167 35.4 35.6 26.4
N3 0.176 38.3 36.6 0.177 38.2 37.0 10.8
N4 0.173 34.7 32.4 0.166 35.1 33.8 2.4
N5 0.162 34.6 36.8 0.155 36.3 38.3 18.0
N6 0.164 34.6 34.1 0.168 35.2 35.0 12.0
N7 0.160 37.1 36.5 0.164 34.7 35.2 16.8
N8 0.161 34.5 35.0 0.164 35.7 37.5 60.0
N9 0.157 36.2 33.8 0.168 35.4 37.3 26.4
N10 0.159 36.0 36.0 0.161 34.6 38.2 25.2
N11 0.167 35.0 36.7 0.165 34.3 36.4 2.4
N12 0.163 32.3 32.3 0.161 35.8 33.1 33.0
P1 0.132 30.2 31.1 0.151 30.1 29.8 69.0
P2 0.139 32.0 27.8 0.148 32.6 31.9 86.0
P3 0.147 31.8 30.6 0.154 31.7 32.4 102.0
P4 0.149 30.9 34.5 0.156 35.0 31.9 66.0
P5 0.134 32.5 30.8 0.142 30.7 30.5 82.2
P6 0.155 29.9 30.9 0.155 30.5 30.7 68.0
C.C. -0.79* -0.76* -0.75* -0.74* -0.72* -0.68*
subjects with those of the patients. As a result, both the jitters (J1, 3: 0.164 ± 0.007, J3,
3: 0.165 ± 0.006) and shimmers (S1, 2: 35.4 ± 1.7, S3, 2: 35.0 ± 1.7,S2, 2: 35.5 ± 1.0,S2, 1: 36.1 ± 1.7 dB) of the normal subjects were relatively higher than those of the patients (J1, 3: 0.143 ± 0.009,J3, 3: 0.151 ± 0.005,S1, 2: 31.2 ± 1.0,S3, 2: 30.9 ± 2.1,S2, 2: 31.8 ± 1.8, S2, 1: 31.2 ± 1.0 dB), whereas the CTTs of the normal subjects (20.4 ± 15.8 hours) were relatively lower than those of the patients (78.9 ± 14.0 hours) (p< 0.01).
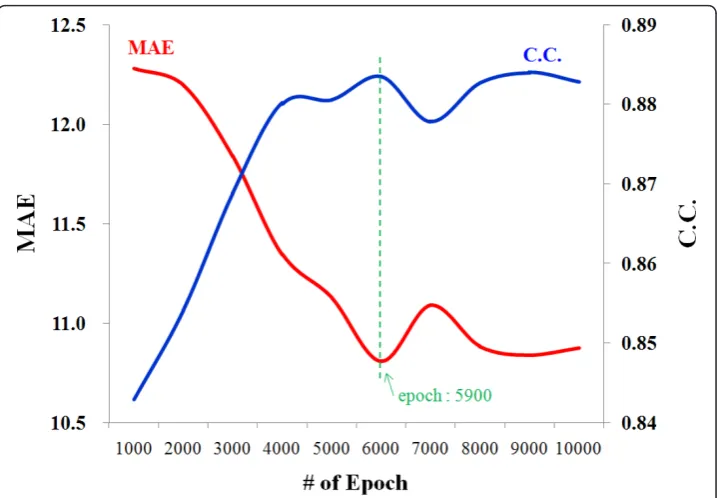
Next, for evaluating the performance of our algorithm, k-fold cross-validation (k= 3) was done using WEKA machine learning software (ver. 3.6. The University of Waikato, New Zealand) [22]. After the random rearrangement of all of 18 feature-datasets, 67% of them (12 feature-datasets) were used for training the BPNN model and the remain-ing 33% (6 feature-datasets) were used for estimatremain-ing the CTT usremain-ing the model trained previously. Consequently, the correlation coefficient, mean average error (MAE) and root mean square error (RMSE) between the measure CTTs and estimated values (eCTT) were 0.89, 10.6 and 14.6 hours at the number of epoch of 5,900, respectively, when applying the learning rate of 0.05 and the number of hidden nodes of 3 to the designed BPNN. Figure 4 shows the changes of the correlation coefficient and MAE of the testing-datasets according to the increase of the number of epoch.
Discussion
Auscultation of the abdomen, one of physical examinations, has been used as a tradi-tional technique for evaluating bowel motility. For the last few decades, there have been various comparative studies on the BSs of normal subjects and those of patients with bowel dysfunction, such as irritable bowel syndrome [5,6,8], Crohn’s disease [6],
diabetes mellitus [7] and obstruction [18], and their results showed significant differ-ences between the features obtained from BS signals according to the pathological con-dition of bowel motility. Also, several researchers recently have developed the de-noising, segmentation and feature extraction strategies of BS signals based on various signal-processing techniques [9-16,19]. However, relatively few studies related to the quantitative estimation of bowel motility have been performed. Therefore, the goal of this study is to show the possibility of the quantitative estimation of the CTT, which has been used for the clinical assessment of bowel motility, by means of an ANN model and acoustical features.
BSs are produced from the movement of the intestinal contents, gas and fluid during peristalsis. Generally, normal ‘very loud’, ‘gurgling’ and‘rumbling’sounds are easily produced by a healthy bowel during an active stage of digestion. On the other hands, hyperactive BSs (’loud’,‘high-pitched’and‘tinkling’sounds) might be caused by diar-rhea or early intestinal obstruction, whereas hypoactive sounds (very diminished or absent sounds) are associated with bowel obstruction, paralytic ileus, torsion of the bowel or peritonitis that indicate diminished peristalsis [23,24]. As considering these differences of sounds, several informative BS-features related to the pathological condi-tion of the gastrointestinal tract have been reported: time-domain features, such as sound-to-sound interval (silence between BSs durations) [5,6,14], number of BSs by time interval [4,6,11,14], sound index (sum of the BSs amplitude) [4,7], median dura-tion [11,14,16] and median acoustic intensity [11,14] of BSs, and frequency-domain ones, such as main frequency of BSs [4,11,14,16,18].
Besides those features mentioned above, jitter and shimmer selected in our approach are measures of the fundamental frequency and amplitude cycle-to-cycle variations, respectively. They can represent the deviation or displacement of some aspect of the
pitches of sounds in frequency- and time-domain, accordingly, they have been success-fully used in a speaker verification, emotion expression, vocal or articular pathologies [20,25-27]. In this study, the jitters and shimmers were significantly different between two groups (p< 0.01) and highly correlated with the CTTs (correlation coefficient from -0.68 to -0.79). These differences were thought to be related to the delayed peri-stalsis caused by the impaired vagus and hypogastric nerves of the SCI patients [28], and this aspect might produce relatively decreased perturbation of the pitches of BSs. Therefore, the jitter and shimmer considered in our method could be employed as a useful clinical parameter for the continuous monitoring of the bowel motility.
In relation to recording-duration issues of our approach, the BS signals were ana-lyzed based on short-term analysis that deals with small-duration samples of the entire activity in fasted humans, coincided with [5-8,18,19], and all of the features were obtained from impulsive BSs due to the management difficulty of subject’s immobiliza-tion during the test and huge data. On the contrary, many researchers believe that the period of BS monitoring should be longer over at least 2 hours since lasting/regularly-sustained (RS) BSs monitored during a full migrating motor complex (MMC) cycle are also associated with bowel motility [4,10-16]. Unfortunately, even though the acoustical features obtained from the short-term recording of 10 minutes set in this study showed its feasibility, this strategy would raise a subject prolific of controversy related to the statistical reliability of the acquired samples. Therefore, in a future study we need to determine the appropriate recording period and to implement additional techniques for RS-BSs treatment as well as impulsive sounds.
Recently, the estimation method based on the regression analysis between the fea-tures obtained from BS signals, such as the jitter and shimmer, and conventional CTT was implemented in [17]. Accordingly, the comparison of the estimation results of the proposed approach by means of the ANN model with those obtained from the pre-vious regression model was performed. When applying 18 feature-datasets used in this study into the regression model, the regression equation between the selected features and measured CTT was obtained as follows;
eCTT= 430.3−1462.9J1,3−5.7S1,2−4.3S3,2+ 261.1J3,3+ 0.8S2,2+ 3.1S2,1 (3)
Also, the correlation coefficient, MAE and RMSE between the CTTs and eCTTs were 0.89, 12.4 and 18.4 hours, respectively. As a result, the estimation errors of the ANN model (MAE of 10.6 and RMSE of 14.6 hours) were relatively lower than those of the regression model, whereas the correlation coefficients of both methods were almost same. Consequently, these results showed that the neural-network-based approach attempted in this study could enhance its performance.
Conclusions
A non-invasive algorithm for the estimation of the CTT based on BPNN model of the jitter and shimmer of the BS signals obtained by auscultation is reported. The correla-tion coefficient and MAE between the CTTs measured by the convencorrela-tional method and the values estimated by our algorithm were 0.89 and 10.6 hours, respectively. The proposed algorithm showed good potential for the non-invasive measurement and con-tinuous monitoring of bowel motility, instead of conventional radiography.
List of Abbreviations
CTT: Colon Transit Time; MRI: Magnetic Resonance Imaging; BS: Bowel Sound; MLP: Multi-Layer Perceptron; ANN: Artificial Neural Network; IRB: Institutional Review Board; mIKD: Modified Iterative Kurtosis-based Detection; BGS: Back-Ground Sound; NF: Notch Filter; BPF: Band Pass Filter; BPNN: Back-Propagation Neural Network; eCTT: Estimated Colon Transit Time; MAE: mean average error; RMSE: root mean square error; MMC: Migrating Motor Complex.
Acknowledgements
This work was supported by the Human Resources Development of the Korea Institute of Energy Technology Evaluation and Planning (KETEP) grant funded by the Korea Government Ministry of Knowledge Economy (No.20104010100660) and supported by the National Research Foundation of Korea Grant funded by the Korean Government(MEST) (NRF-2010-0021864).
Author details
1
School of Electronics and Information Engineering, Chonbuk National University, 664-14 1 Ga, Deokjin-dong, Jeonju, Republic of Korea.2School of Medicine, Department of Rehabilitation Medicine, Chonbuk National University Hospital, 634-18 Geumam-dong, Jeonju, Republic of Korea.3Center for Advanced Image and Information Technology, Chonbuk National University, 664-14 1 Ga, Deokjin-dong, Jeonju, Republic of Korea.
Authors’contributions
KK devised an estimation algorithm for bowel motility and implemented the portable system which consists of pre-processing circuits and data acquisition/analysis software using LabVIEW language. JS contributed to the experimental protocol for clinical assessment of bowel motility and interpretation of the results. CS supervised the project and contributed to the design of the algorithms. All authors read and approved the final manuscript.
Competing interests
The authors declare that they have no competing interests.
Received: 12 April 2011 Accepted: 10 August 2011 Published: 10 August 2011
References
1. Jackson CR, Lee RE, Wylie ABZ, Adams C, Jaffray B:Diagnostic accuracy of the Barr and Blethyn radiological scoring systems for childhood constipation assessed using colonic transit time as the gold standard.Pediatr Radiol2009,
39:664-667.
2. Metcalf AM, Phillips SF, Zinmeister AR, MacCarty RJ, Beart RW, Wolff BG:Simplified assessment of segmental colonic transit.Gastroenterology1987,92:40-47.
3. Emmanuel A, Roy A:Small intestine and colon motility.Medicine2007,35:272-276.
4. Tomomasa T, Morikawa A, Sandler R, Mansy H, Koneko H, Masahiko T, Hyman P, Itoh Z:Gastrointestinal sounds and migrating motor complex in fasted humans.Am J Gastroenterol1999,94:374-381.
5. Craine BL, Silpa ML, O’Toole CJ:Computerized auscultation applied to irritable bowel syndrome.Dig Dis Sci1999,
44:1887-1892.
6. Craine BL, Silpa ML, O’Toole CJ:Enterotachogram analysis to distinguish irritable bowel syndrome from Crohn’s disease.Dig Dis Sci2001,46:1974-1979.
7. Yamaguchi K, Yamaguchi T, Odaka T, Saisho H:Evaluation of gastrointestinal motility by computerized analysis of abdominal auscultation findings.J Gastroenterol Hepatol2006,21:510-514.
8. Hadjileontiadis LJ, Liatsos CN, Mavrogiannis CC, Rokkas TA, Panas SM:Enhancement of bowel sounds by wavelet-based filtering.IEEE Trans Biomed Eng2000,47:876-886.
9. Hadjileontiadis LJ:Wavelet-Based Enhancement of Lung and Bowel Sounds Using Fractal Dimension Thresholding-Part I: Methodology.IEEE Trans Biomed Eng2005,52:1143-1148.
10. Dimoulas C, Kalliris G, Papanikolaou G, Kalampakas A:Long term signal detection, segmentation and summarization using wavelets and fractal dimension: a bioacoustics application in gastrointestinal motility monitoring.Comput Biol Med2007,37:438-462.
11. Ranta R, Dorr VL, Heinrich C, Wolf D, Guillemin F:Digestive activity evaluation by multichannel abdominal sounds analysis.IEEE Trans Biomed Eng2010,57:1507-1519.
12. Dimoulas C, Kalliris G, Papanikolaou G, Petridis V, Kalampakas A:Bowel-sound pattern analysis using wavelets and neural networks with application to long-term, unsupervised, gastrointestinal motility monitoring.Expert Syst Appl
2008,36:26-41.
14. Ranta R, Louis-Dorr V, Heinrich C, Wolf D, Guillemin F:Principal component analysis and interpretation of bowel sounds.Proceeding of the 26th Annual International Conference of the IEEE EMBS2004, 227-230.
15. Dimoulas CA, Kalliris G, Papanikolaou G, Kalampakas A:Novel wavelet domain Weiner filtering de-noising techniques: Application to bowel sounds captured by means of abdominal surface vibrations.Biomed Signal Process Control
2006,1:177-218.
16. Dimoulas CA, Papanikolaou G, Petridis V:Pattern classification and audiovisual content management techniques using hybrid expert systems: A video-assisted bioacoustics application in abdominal sounds pattern analysis. Expert Syst Appl2011,38:13082-13093.
17. Kim KS, Seo JH, Ryu SH, Kim MH, Song CG:Estimation algorithm of the bowel motility based on regression analysis of the jitter and shimmer of bowel sounds.Comput Methods Programs Biomed.
18. Yoshino H, Abe Y, Yoshino T, Oshato K:Clinical application of spectral analysis of bowel sounds in intestinal obstruction.Dis Colon Rectum1990,33:753-757.
19. Rekanos IT, Hadjileontiadis LJ:An iterative kurtosis-based technique for the detection of nonstationary bioacoustic signals.Signal Process2006,86:3787-3795.
20. Farrus M, Hernando J:Using jitter and shimmer in speaker verification.IET signal Process2009,3:247-257. 21. Fausett L:Fundamentals of Neural Networks: Architectures, Algorithms and ApplicationsPrentice-Hall Inc; 1994. 22. Weka 3: Data mining software in java.[http://www.cs.waikato.ac.nz/~ml/weka/].
23. Javis C:Physical Examination and Health AssessmentElsevier; 2008.
24. Baid H:A critical review of auscultating bowel sounds.Br J Nurs2009,18:1125-1129. 25. Baken R, Orlikoff RF:Clinical Measurements of Speech and VoiceThomson Delmar Learning; 2000.
26. Ayadi ME, Kamel MS, Karray F:Survey on speech emotion recognition: Features, classification schemes, and databases.Pattern Recognit2011,44:572-587.
27. Kim KS, Seo JH, Song CG:An acoustical evaluation of knee sound for non-invasive screening and early detection of articular pathology.J Med Syst.
28. Lynch AC, Antony A, Dobbs BR, Frizelle FA:Bowel dysfunction following spinal cord injury.Spinal Cord2001,
39:193-203.
doi:10.1186/1475-925X-10-69
Cite this article as:Kimet al.:Non-invasive algorithm for bowel motility estimation using a back-propagation neural network model of bowel sounds.BioMedical Engineering OnLine201110:69.
Submit your next manuscript to BioMed Central and take full advantage of:
• Convenient online submission
• Thorough peer review
• No space constraints or color figure charges
• Immediate publication on acceptance
• Inclusion in PubMed, CAS, Scopus and Google Scholar
• Research which is freely available for redistribution