S O F T W A R E
Open Access
Using an ensemble of statistical metrics
to quantify large sets of plant transcription
factor binding sites
Parsa Hosseini
1,2,3*, Ivan Ovcharenko
2and Benjamin F Matthews
3Abstract
Background: From initial seed germination through reproduction, plants continuously reprogram their transcriptional repertoire to facilitate growth and development. This dynamic is mediated by a diverse but
inextricably-linked catalog of regulatory proteins called transcription factors (TFs). Statistically quantifying TF binding site (TFBS) abundance in promoters of differentially expressed genes can be used to identify binding site patterns in promoters that are closely related to stress-response. Output from today’s transcriptomic assays necessitates statistically-oriented software to handle large promoter-sequence sets in a computationally tractable fashion.
Results: We present Marina, an open-source software for identifying over-represented TFBSs from amongst large sets of promoter sequences, using an ensemble of 7 statistical metrics and binding-site profiles. Through software
comparison, we show that Marina can identify considerably more over-represented plant TFBSs compared to a popular software alternative.
Conclusions: Marina was used to identify over-represented TFBSs in a two time-point RNA-Seq study exploring the transcriptomic interplay between soybean (Glycine max) and soybean rust (Phakopsora pachyrhizi). Marina identified numerous abundant TFBSs recognized by transcription factors that are associated with defense-response such as WRKY, HY5 and MYB2. Comparing results from Marina to that of a popular software alternative suggests that
regardless of the number of promoter-sequences, Marina is able to identify significantly more over-represented TFBSs.
Background
Definitions and presumptions
We define a list of transcription factor binding sites (TFBSs),t1,t2,. . .,tN, whereti is either a DNA motif,mi
or position weight matrix (PWM), wi. The former is a
variable-length character-string from the four-nucleotide DNA alphabet, while the latter is a two-dimensional matrix of preset weights.
A group, Ga, is a FASTA file populated with
user-provided promoter sequences. LetGa,Ga+1,. . .,GN
rep-resent a list ofN groups such thatN ≥ 2. We define a contingency matrix,ci as a 2×2 matrix, used to model
*Correspondence: [email protected]
1Department of Bioinformatics and Computational Biology, George Mason University, Manassas, Virginia, USA
2Computational Biology Branch, National Center for Biotechnology Information, National Institutes of Health, Bethesda, Maryland, USA Full list of author information is available at the end of the article
tiover-representation acrossGaandGa+1. A set of
statis-tical metrics,S, quantify degree oftiover-representation
givenci.
Transcription factors and binding site representation Plants are constantly surrounded by stimulus, be-they deletorious pathogens or positive stimuli such as light and nutrients. In order for the plant to respond to these signals, plants must utilize regulatory proteins known as transcription factors (TFs) to facilitate transcriptional reprogramming in a dynamic, tissue-dependent manner. These proteins bind to enhancer or promotercis-elements and facilitate the recruitment of RNA polymerase II. This combinatorial binding of TFs facilitates downstream execution of adaptative signals in the face of drought, herbivory, and high salinity. By quantifying binding–sites for these regulatory proteins, inherent transcriptional dynamics and magnitude of over-representation can be inferred.
TFs are classified into families by inherent DNA-binding signatures otherwise known as protein domains. In Ara-bidopsis thaliana, for instance, there are 64 known TF families [1], and it is not uncommon for different TF family members to exhibit relatively similar functional-ity. This redundancy is especially true when it comes to stress-response [2-4].
DNA motifs and PWMs are two models frequently used to define a TFBS. The former is a shortcis-element region presumed to be a TFBS, while the latter models nucleotide propensities of a TFBS in the form of a matrix [5,6]. PWMs have been used across a broad spectrum of plant investigations such as identification of conserved exonic splice-site enhancers inArabidopsis thaliana [7], prediction of potential seed-storage regulatory elements in mustards, grasses and legumes [8], and identification of novel regulatory elements inArabidopsis thaliana[9]. With assays such as ChIP-ChIP and ChIP-Seq, novel reg-ulatory elements can be identified and modeled as a PWM [10].
Implementation
Marina is an operating-system independent GUI software tool built using the Java programming language.
This manuscript builds on the works of Chekmenev et. al [11], Loots et. al [12], and Kel et. al. [13], by implement-ing multiple statistical metrics to identify the maximum number of biologically-sound TFBSs, while accounting for cases when large promoter sets are provided.
To begin analysis with Marina, at least two FASTA files populated with user-provided promoter sequences are required. Each FASTA file is known as a group. A group, for instance, could represent promoter sequences of interest for a particular condition or time point.
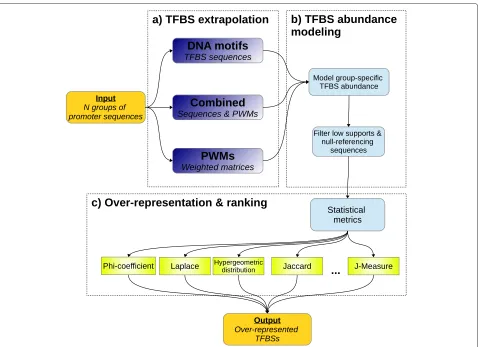
The Marina workflow (Figure 1) is partitioned into three distinct phases. The first phase performs abundance-estimation given a catalog of known TFBS models (Figure 1a). Initial abundance derivation is performed via mapping of the TFBS onto user-provided promoter sequences. Following TFBS mapping, low-quality TFBSs are removed (Figure 1b). Finally, a collection of statisti-cal metrics quantify and rank TFBS over-representation (Figure 1c).
Phase 1: Binding site mapping
In order to effectively quantify TFBS abundance using this tool, TFBS models must be provided. These models are in the form of either DNA motifs or PWMs. Cumulatively, 1,240 TFBS models were mined and utilized through-out this study. Of these models, 1,160 were DNA motifs with the remaining 80 being PWMs; motif-to-PWM ratio of 13:1.
Plant DNA motif and PWM models originated from AthaMap [14], AGRIS [15], PlantCARE [16], TRANSFAC
[17], and JASPAR [18]. DNA motifs and PWMs were stored in either a tab-delimited or FASTA file format, respectively. Due to licensing restrictions, Marina does not come pre-packaged with a catalog of TFBS models, however several PWMs are provided, built from known PDB structures using the 3DTF web-server [19]. Be it PWMs or DNA motifs, a user-friendly schema is provided for importing custom TFBS profiles.
DNA motif and PWM mapping
To efficiently derive over-representation using DNA motifs, Marina scans promoter sequences for any occur-rence of this motif using the Boyer-Moore-Horspool algo-rithm [20]. Due to the short length of many DNA motifs, elements such as ARF1 (TGTCTC) [21] may ubiquitously map throughout a promoter sequence with many map-pings having little biological significance. Though this tool provides the option to filter short-length models be it PWMs or DNA motifs, resultant abundance estimations may seldom be biologically significant simply due to the likelihood of spurious mappings.
Marina maps each PWM onto promoter sequences using a concurrent implementation of the P-MATCH algorithm [11]. P-MATCH calculates a likelihood that a particular candidate promoter region contains a TFBS. By default, Marina uses a probability-cutoff of 0.80; any sub-sequence with a score greater than this cutoff is rendered a potential TFBS.
Alongside DNA motif and PWM extrapolations is a third pseudo-extrapolation known as combined mode. This mode simply performs the two former extrapo-lations back-to-back, merging their results into a sin-gular data-structure. Combined mode capitalizes on the abundance of DNA motifs and probabilistic power of PWMs.
Phase 2: Modeling TFBS over-representation
TFBS abundances across all promoter sequences are modeled using a group-specific acyclic graph. Each graph is organized such that group name is the root-node and each TFBS is a child leaf root-node. Every TFBS node references a list of promoter sequences containing this TFBS.
Figure 1Marina workflow.a)A group is an umbrella-term to represent a set of promoter sequences. In order to run Marina, at least two groups must be provided. In doing so, TFBSs within each group can be contrasted and statistically quantified using TFBSs modeled as either DNA motifs or PWMs. Marina can also run if both these data-structures are provided, hence the name combined.b)Each group is modeled as a uni-directional graph, providing a means of trimming low-abundant promoter-sequences and TFBSs.c)A diverse collection of statistical metrics are used to model and quantify TFBS abundance. Magnitude of TFBS abundance is ranked and the hypergeometric distribution p-value computes significance of TFBS over-representation.
representing abundance of a TFBS within a particular group [22]. A collection of statistical metrics continue where support leaves off, providing a means of deducing TFBS abundance.
Both raw-counts and support serve as viable metrics to initially model TFBS abundance, however there may be cases were a rift between the two measures can appear. For example, suppose a single TFBS mapped only once to a group. Due to such minimal map-ping, raw-count will be small but support would be large. Both low-support and low-count thresholds exist so as to filter corresponding graph nodes. Such graph trimming ensures that high-support and/or high-count TFBS nodes remain as they are more likely of hav-ing correlations to a particular group [23]. A caveat with threshold cutoffs is that low-abundance TFBSs will get discarded.
Phase 3: Deriving over-represented TFBSs using numerous statistical metrics
Given remaining TFBSs nodes, Marina aims to deduce magnitude of over-representation per TFBS, ti by
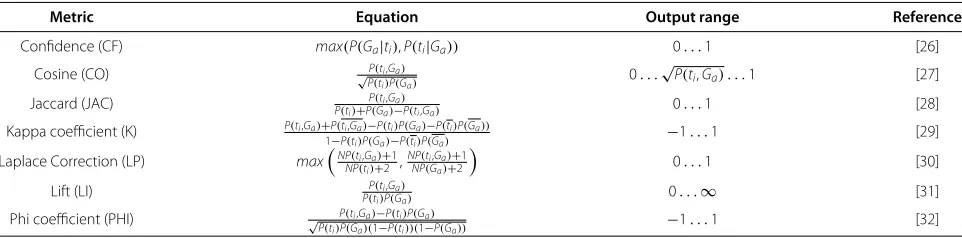
con-trasting its abundance across groups Ga and Ga+1. To facilitate this objective, a collection of 7 knowledge discov-ery metrics,S, are implemented (Table 1). Though a single metric can theoretically suffice, employing the entire set provides a means to appreciate unique features per mea-sure and avoid individual bias. This table is by no means exhaustive as there are well over 20 frequently used met-rics [24,25]. The metmet-rics in this table were selected so that there exists a sound mixture of both well-studied association and correlation measures.
Table 1 Statistical metrics
Metric Equation Output range Reference
Confidence (CF) max(P(Ga|ti),P(ti|Ga)) 0. . .1 [26]
Cosine (CO) √P(ti,Ga)
P(ti)P(Ga) 0. . .
√
P(ti,Ga) . . .1 [27]
Jaccard (JAC) P(ti,Ga)
P(ti)+P(Ga)−P(ti,Ga) 0. . .1 [28] Kappa coefficient (K) P(ti,Ga)+P(ti,Ga)−P(ti)P(Ga)−P(ti)P(Ga))
1−P(ti)P(Ga)−P(ti)P(Ga) −1. . .1 [29] Laplace Correction (LP) maxNP(ti,Ga)+1
NP(ti)+2 , NP(ti,Ga)+1
NP(Ga)+2
0. . .1 [30]
Lift (LI) P(ti,Ga)
P(ti)P(Ga) 0. . .∞ [31]
Phi coefficient (PHI) √ P(ti,Ga)−P(ti)P(Ga)
P(ti)P(Ga)(1−P(ti))(1−P(Ga)) −1. . .1 [32]
Given a group,Ga, and a TFBS,ti, magnitude of TFBS over-representation can be determined using a set of statistical metrics.
candidate as it models TFBS distributions through-out multiple, independent groups (Table 2). Each metric within S processes frequencies within a contin-gency matrix, ci, so as to quantitatively deduce
over-representation of TFBS, ti. Certainly not all metrics
deduce magnitude of TFBS over-representation the same, resulting in difficulties as to which TFBSs are unani-mously most over-represented by all metrics. A solu-tion to bringing uniform over-representasolu-tion agreement across all metrics is to standardize contingency matrix counts using Iterative Proportional Fitting (IPF) [33].
Iterative Proportional Fitting (IPF)
IPF is an algorithm for standardizing counts in a two-dimensional contingency matrix such that matrix row and column marginals are equal to one another (Table 3). Through such adjustment, inherent associations and correlations can be discovered [34]. By perform-ing IPF-standardization, output for all 7 metrics become normalized so as to agree which TFBSs are the most over-represented.
Equations 1 and 2 present an implementation of the IPF algorithm originally outlined by Tan et al. [35]. The for-mer equation adjusts counts,a, such that they are equal on the diagonal axis. The latter equation then subtracts the remainder of the counts from that of the entire matrix sum,N.
ci1,0=ci0,0=a=
N√ci1,1ci0,0
2√ci1,1ci0,0+ √ci1,0ci0,1
(1)
ci0,1=ci1,0= N
2 −a (2)
Table 2 Contingency matrices model TFBS over-representation
Ga Ga
ti ci(0, 0) ci(1, 0) n(ti)
ti ci(0, 1) ci(1, 1) n(ti)
n(Ga) n(Ga) N
TFBS abundance within specific groups can be modeled as a two-dimensional contingency matrix,ci.
Results and discussion
Case study: over-representedGlycine maxTFBSs during a Phakopsora pachyrhizitime-course infection
To evaluate the functionality of this software tool, we utilized a two time-course RNA-Seq study that inves-tigates soybean (Glycine max) transcriptional dynamics upon pathogenesis with soybean rust (SR; Phakopsora pachyrhizi). As outlined in our previous study, suscepti-ble Williams 82 soybean leaves were inoculated with SR and assayed using RNA-Seq 10 days after infection (dai) [36]. An accompanying uninoculated control was also assayed to serve as a baseline condition. In both the con-trol and 10 dai samples, a total of 5,940,995 70bp reads and 5,574,892 40bp reads were respectively sequenced using the Illumina platform (GenomeAnalyzer IIx). Sequenced reads were deposited in NCBI SRA under accessions SRX100854, SRX129967 and SRX100853, SRX129959, respectively.
Per run, quality assessment and control (QA/QC) entailed removal of low quality reads and trimming of low-quality 3’ ends should its quality score be less than 22. Reads were also discarded if they mapped at least once to either the human genome (Hg19) or the JCVI Microbial Resource [37]. Upon QA/QC completion, a total of 5,015,459 control reads and 5,420,745 10 dai reads passed filtering; quality-scores of 27 and 30, respectively. For each time point, reads were mapped with at-most 3 nucleotide mismatches onto the soybean transcriptome build (Glyma 1.0) using BWA [38]. Custom Python scripts inferred differential expression by deriving RPKM [39] andlog2
RPKM10dai
RPKM0dai
per transcript.
Table 3 IPF-standardization yields equal marginals in a contingency matrix
Ga Ga
ti x N/2−x N/2
ti N/2−x x N/2
N/2 N/2 N
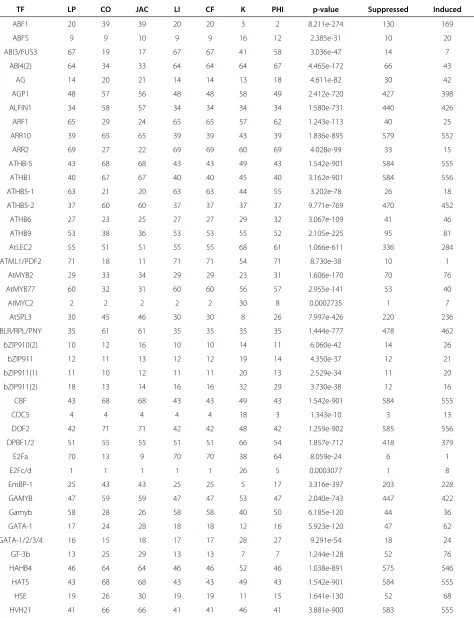
Table 4 Various metrics infer differing magnitudes of TFBS over-representation
Metrics TFBS raw-abundance
TF LP CO JAC LI CF K PHI p-value Suppressed Induced
ABF1 20 39 39 20 20 3 2 8.211e-274 130 169
ABFS 9 9 10 9 9 16 12 2.385e-31 10 20
ABI3/FUS3 67 19 17 67 67 41 58 3.036e-47 14 7
ABI4(2) 64 34 33 64 64 64 67 4.465e-172 66 43
AG 14 20 21 14 14 13 18 4.611e-82 30 42
AGP1 48 57 56 48 48 58 49 2.412e-720 427 398
ALFIN1 34 58 57 34 34 34 34 1.580e-731 440 426
ARF1 65 29 24 65 65 57 62 1.243e-113 40 25
ARR10 39 65 65 39 39 43 39 1.836e-895 579 552
ARR2 69 27 22 69 69 60 69 4.028e-99 33 15
ATHB-5 43 68 68 43 43 49 43 1.542e-901 584 555
ATHB1 40 67 67 40 40 45 40 3.162e-901 584 556
ATHB5-1 63 21 20 63 63 44 55 3.202e-78 26 18
ATHB5-2 37 60 60 37 37 37 37 9.771e-769 470 452
ATHB6 27 23 25 27 27 29 32 3.067e-109 41 46
ATHB9 53 38 36 53 53 55 52 2.105e-225 95 81
AtLEC2 55 51 51 55 55 68 61 1.066e-611 336 284
ATML1/PDF2 71 18 11 71 71 54 71 8.730e-38 10 1
AtMYB2 29 33 34 29 29 23 31 1.606e-170 70 76
AtMYB77 60 32 31 60 60 56 57 2.955e-141 53 40
AtMYC2 2 2 2 2 2 30 8 0.0002735 1 7
AtSPL3 30 45 46 30 30 8 26 7.997e-426 220 236
BLR/RPL/PNY 35 61 61 35 35 35 35 1.444e-777 478 462
bZIP910(2) 10 12 16 10 10 14 11 6.060e-42 14 26
bZIP911 12 11 13 12 12 19 14 4.350e-37 12 21
bZIP911(1) 11 10 12 11 11 20 13 2.529e-34 11 20
bZIP911(2) 18 13 14 16 16 32 29 3.730e-38 12 16
CBF 43 68 68 43 43 49 43 1.542e-901 584 555
CDC5 4 4 4 4 4 18 3 1.343e-10 3 13
DOF2 42 71 71 42 42 48 42 1.259e-902 585 556
DPBF1/2 51 55 55 51 51 66 54 1.857e-712 418 379
E2Fa 70 13 9 70 70 38 64 8.059e-24 6 1
E2Fc/d 1 1 1 1 1 26 5 0.0003077 1 8
EmBP-1 25 43 43 25 25 5 17 3.316e-397 203 228
GAMYB 47 59 59 47 47 53 47 2.040e-743 447 422
Gamyb 58 28 26 58 58 40 50 6.185e-120 44 36
GATA-1 17 24 28 18 18 12 16 5.923e-120 47 62
GATA-1/2/3/4 16 15 18 17 17 28 27 9.291e-54 18 24
GT-3b 13 25 29 13 13 7 7 1.244e-128 52 76
HAHB4 46 64 64 46 46 52 46 1.038e-891 575 546
HAT5 43 68 68 43 43 49 43 1.542e-901 584 555
HSE 19 26 30 19 19 11 15 1.641e-130 52 68
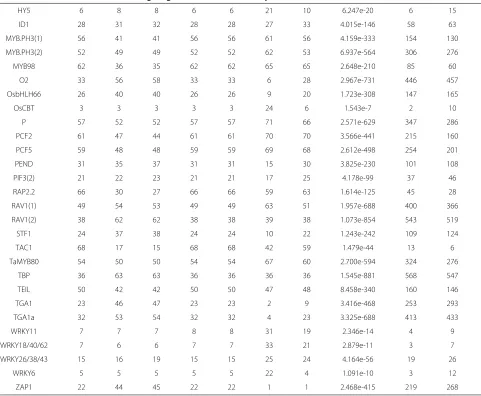
Table 4 Various metrics infer differing magnitudes of TFBS over-representation(Continued)
HY5 6 8 8 6 6 21 10 6.247e-20 6 15
ID1 28 31 32 28 28 27 33 4.015e-146 58 63
MYB.PH3(1) 56 41 41 56 56 61 56 4.159e-333 154 130
MYB.PH3(2) 52 49 49 52 52 62 53 6.937e-564 306 276
MYB98 62 36 35 62 62 65 65 2.648e-210 85 60
O2 33 56 58 33 33 6 28 2.967e-731 446 457
OsbHLH66 26 40 40 26 26 9 20 1.723e-308 147 165
OsCBT 3 3 3 3 3 24 6 1.543e-7 2 10
P 57 52 52 57 57 71 66 2.571e-629 347 286
PCF2 61 47 44 61 61 70 70 3.566e-441 215 160
PCF5 59 48 48 59 59 69 68 2.612e-498 254 201
PEND 31 35 37 31 31 15 30 3.825e-230 101 108
PIF3(2) 21 22 23 21 21 17 25 4.178e-99 37 46
RAP2.2 66 30 27 66 66 59 63 1.614e-125 45 28
RAV1(1) 49 54 53 49 49 63 51 1.957e-688 400 366
RAV1(2) 38 62 62 38 38 39 38 1.073e-854 543 519
STF1 24 37 38 24 24 10 22 1.243e-242 109 124
TAC1 68 17 15 68 68 42 59 1.479e-44 13 6
TaMYB80 54 50 50 54 54 67 60 2.700e-594 324 276
TBP 36 63 63 36 36 36 36 1.545e-881 568 547
TEIL 50 42 42 50 50 47 48 8.458e-340 160 146
TGA1 23 46 47 23 23 2 9 3.416e-468 253 293
TGA1a 32 53 54 32 32 4 23 3.325e-688 413 433
WRKY11 7 7 7 8 8 31 19 2.346e-14 4 9
WRKY18/40/62 7 6 6 7 7 33 21 2.879e-11 3 7
WRKY26/38/43 15 16 19 15 15 25 24 4.164e-56 19 26
WRKY6 5 5 5 5 5 22 4 1.091e-10 3 12
ZAP1 22 44 45 22 22 1 1 2.468e-415 219 268
Promoter sequences from the top 600 induced and top 600 suppressed genes 10 dai were identified and their TFBS abundances quantified using Marina. A catalog of pre-assembled DNA motifs (1,160 motifs) and PWMs (80 matrices) accompanied such groups.
A total of 71 over-represented TFBSs were identified. Of theseNTFBSs, magnitude of over-representation is ranked from 1 toNsuch that the most over-represented are close to 1 while the least over-represented are close toN. Since TFBS models can vary across source-organisms, certain over-represented TFBSs were found multiple times (i.e. GAMYB, bZIP911, and ATHB5). Furthermore, not all metrics rank the same. As a result, manually deducing degree of TFBS over-representation can be a challenging task. IPF-standardization is designed to circumvent such a scenario.
Two gene-sets were then declared to contain the top 600 induced and 600 suppressed differentially expressed genes (DEGs), respectively. Per gene set, the promoter sequence 2.5kb upstream from each genes transcription start site (TSS) was retrieved and appended to a FASTA file. Both FASTA files in-conjunction with 80 plant PWMs and 1,160 plant-specific DNA motifs served as input into Marina.
Marina identified 71 potentially over-represented TFBSs between the control and 10 dai groups (Table 4). As shown in this table, there exists no consensus amongst the various metrics as to which TFBS is truly the most over-represented. There are however some TFBSs that are ranked by all metrics in a relatively uniform manner:
AG, ATHB6, and ABFS. For all other TFBSs, it is diffi-cult to deduce magnitude of over-representation. Such a scenario warrants IPF-standardization as it normalizes metric-ranks to agree in-concert which TFBSs are the most over-represented (Table 5). By visually contrasting this table with that of Table 4, it is clear that unstandard-ized ranks from Laplace Correction (LP), Confidence (CF) and Lift (LI) perfectly equal their IPF-standardized counterpart.
Many over-represented TFBSs have defense or stress-response functions
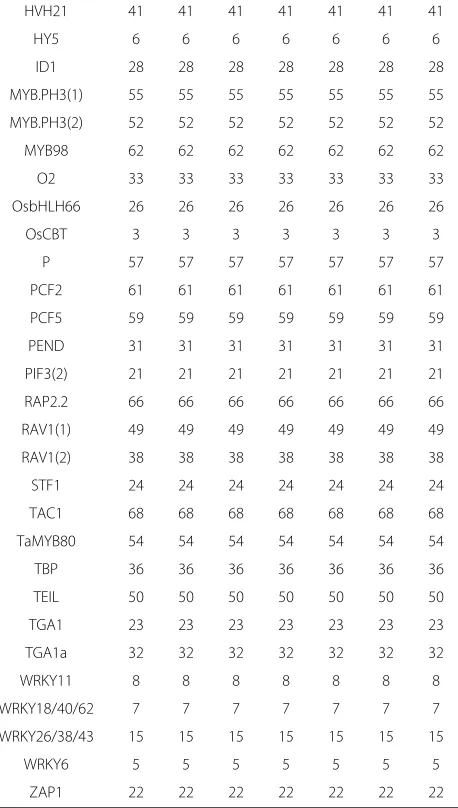
Table 5 IPF-standardized abundances provides agreement amongst all metrics
Metrics
TF LP CO JAC LI CF K PHI
ABF1 20 20 20 20 20 20 20
ABFS 9 9 9 9 9 9 9
ABI3/FUS3 67 67 67 67 67 67 67
ABI4(2) 64 64 64 64 64 64 64
AG 14 14 14 14 14 14 14
AGP1 48 48 48 48 48 48 48
ALFIN1 34 34 34 34 34 34 34
ARF1 65 65 65 65 65 65 65
ARR10 39 39 39 39 39 39 39
ARR2 69 69 69 69 69 69 69
ATHB-5 43 43 43 43 43 43 43
ATHB1 40 40 40 40 40 40 40
ATHB5-1 63 63 63 63 63 63 63
ATHB5-2 37 37 37 37 37 37 37
ATHB6 27 27 27 27 27 27 27
ATHB9 53 53 53 53 53 53 53
AtLEC2 56 56 56 56 56 56 56
ATML1/PDF2 71 71 71 71 71 71 71
AtMYB2 29 29 29 29 29 29 29
AtMYB77 60 60 60 60 60 60 60
AtMYC2 2 2 2 2 2 2 2
AtSPL3 30 30 30 30 30 30 30
BLR/RPL/PNY 35 35 35 35 35 35 35
bZIP910(2) 10 10 10 10 10 10 10
bZIP911 12 12 12 12 12 12 12
bZIP911(1) 11 11 11 11 11 11 11
bZIP911(2) 17 17 17 17 17 17 17
CBF 43 43 43 43 43 43 43
CDC5 4 4 4 4 4 4 4
DOF2 42 42 42 42 42 42 42
DPBF1/2 51 51 51 51 51 51 51
E2Fa 70 70 70 70 70 70 70
E2Fc/d 1 1 1 1 1 1 1
EmBP-1 25 25 25 25 25 25 25
GAMYB 47 47 47 47 47 47 47
Gamyb 58 58 58 58 58 58 58
GATA-1 18 18 18 18 18 18 18
GATA-1/2/3/4 16 16 16 16 16 16 16
GT-3b 13 13 13 13 13 13 13
HAHB4 46 46 46 46 46 46 46
HAT5 43 43 43 43 43 43 43
HSE 19 19 19 19 19 19 19
Table 5 IPF-standardized abundances provides agreement
amongst all metrics(Continued)
HVH21 41 41 41 41 41 41 41
HY5 6 6 6 6 6 6 6
ID1 28 28 28 28 28 28 28
MYB.PH3(1) 55 55 55 55 55 55 55
MYB.PH3(2) 52 52 52 52 52 52 52
MYB98 62 62 62 62 62 62 62
O2 33 33 33 33 33 33 33
OsbHLH66 26 26 26 26 26 26 26
OsCBT 3 3 3 3 3 3 3
P 57 57 57 57 57 57 57
PCF2 61 61 61 61 61 61 61
PCF5 59 59 59 59 59 59 59
PEND 31 31 31 31 31 31 31
PIF3(2) 21 21 21 21 21 21 21
RAP2.2 66 66 66 66 66 66 66
RAV1(1) 49 49 49 49 49 49 49
RAV1(2) 38 38 38 38 38 38 38
STF1 24 24 24 24 24 24 24
TAC1 68 68 68 68 68 68 68
TaMYB80 54 54 54 54 54 54 54
TBP 36 36 36 36 36 36 36
TEIL 50 50 50 50 50 50 50
TGA1 23 23 23 23 23 23 23
TGA1a 32 32 32 32 32 32 32
WRKY11 8 8 8 8 8 8 8
WRKY18/40/62 7 7 7 7 7 7 7
WRKY26/38/43 15 15 15 15 15 15 15
WRKY6 5 5 5 5 5 5 5
ZAP1 22 22 22 22 22 22 22
By having all metrics agree as to magnitude of over-representation per TFBS, the investigator will have an easier time identifying TFBSs of interest. Much like unstandardized ranks (Table 4), standardized ranks also range from 1 toNsuch that ranks in the vicinity of 1 are most over-represented while ranks in the vicinity ofNare least over-represented.
abundances are supported by numerous studies which show that WRKY genes are perceived upon PAMP signals or abiotic stressors [40-43]. WRKY genes drive defense-response by regulating NONEXPRESSOR OF PR1 (NPR1) expression by binding to W-box motifs in the NPR1 pro-moter. NPR1 protein binds with TGA TFs which regulate pathogenesis-response (PR) expression, hence providing a means of positively regulating SA-defense response [44-46].
defense response [47,48]. Through interactions with HY1 and MYC2, HY5 is able to regulate photomorphogenesis, ABA and JA signaling [49,50].
Much like MYC2, AtMYB2 is not only over-represented at 10 dai but also plays a role in ABA-signaling. Microar-ray analyses on Arabidopsis plants with 35S:AtMYC2/ AtMYB2 over-expression constructs revealed induced expression of several ABA-regulated genes [51].
The GT (Trihelix) TF family member, GT-3b, was over-represented at 10 dai. Much is unknown about this TF family let alone GT-3b, however what is known is that many GT members, like HY5, regulate photomor-phogenic signaling [52]. A recent study showed how GT-2a and GT-2b over-expression positively-regulates ABA-signaling [53]. Though an over-expressed GT-3b construct was not part of this recent study, translating findings from GT-2a and GT-2b over to GT-3b could reveal potentially novel insights into whether GT-3b plays a part in ABA and defense-signaling roles.
Strong relationship between degree of TFBS over-representation and IPF-rank
Due to the multi-dimensional nature of unstandardized TFBS ranks (Table 4), dimensionality reduction was per-formed to facilitate rank visualization on a 2D coordinate plane. To carry-out such analysis, Principle Component
Analysis (PCA) followed by bi-variate clustering was exe-cuted using the R library clusplot [54]. All 71 TFBSs were partitioned into 6 discrete clusters and labeled based on their respective IPF-standardized rank (Figure 2). Inter-estingly, there appears to be a strong relationship between the magnitude of TFBS over-representation and IPF-standardized rank. This suggests that IPF-standardization is suitable for deducing magnitude of over-represented TFBSs.
Comparative software analysis
Several actively-used software tools and web-interfaces are available to quantify TFBS over-representation [14,15,18,55-57]. We classified such tools into two classes: software that deduce TFBS over-representation given either 1) one promoter-sequence set or 2) at least two promoter-sequence sets. Marina falls into this latter class and as does a popular software tool, F-MATCH [13]. Both tools require two FASTA files as input such that one file serves as a query sequence-set while the other a baseline control. Degree of over-representation is therefore deduced by statistically contrasting TFBS over-representation across these two groups.
Both software tools were compared using three independent sets of promoter-sequences of vary-ing sizes. Each of these three analyses encompassed
−4 −2 0 2 4
−2
−1
0
1
2
Over−represented TFBS clusters
Component 1 Component 2 1 2 3 4 5 6 7 8 9 10 11 12 13 14 15 16 17 18 19 20 21 22 23 24 25 26 27 28 29 30 31 32 33 34 35 36 37 38 39 40 41 42 43 44 45 46 47 48 49 50 51 52 53 54 55 56 57 58 59 60 61 62 63 64 65 66 67 68 69 70 71 1 2 3 4 5 6
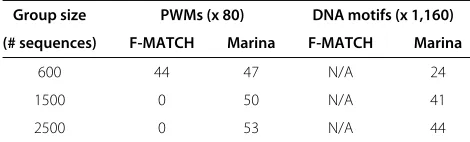
Table 6 Comparing Marina and F-MATCH given catalogs of PWMs and DNA motifs
Group size PWMs (x 80) DNA motifs (x 1,160)
(# sequences) F-MATCH Marina F-MATCH Marina
600 44 47 N/A 24
1500 0 50 N/A 41
2500 0 53 N/A 44
A collection of 80 plant-specific PWMs were supplied to Marina. When group-sizes are relatively small and PWMs are used, both Marina and F-MATCH identify approximately the same number of over-represented TFBSs. However as group-sizes increased, Marina consistently identifies over-represented TFBSs. Marina also accepts DNA motifs if PWMs are not available; F-MATCH does not accept such models.
promoter-sequences of DEGs 10 dai from our prior soy-bean – soysoy-bean rust RNA-Seq study [36]. F-MATCH and Marina identify relatively the same number of over-represented TFBSs when promoter-sequence sets are 600 sequences in size (Table 6). As these promoter sets increase in size, Marina maintains steady consistency as to identification of over-representated TFBSs, while F-MATCH failed to detect any over-represented TFBSs. We believe the reasoning behind why F-MATCH yields 0 over-represented TFBSs while Marina identified almost 50 TFBSs to be attributed towards usage of the bino-mial distribution by F-MATCH, which is known to be sensitive to large test sets. As far as output consistency between the two tools, our only comparison pertains to results obtained with 600 sequences sets. Given the 44 F-MATCH and 47 Marina over-represented TFBSs, 21 TFBSs were shared between the two result-sets. Unlike F-MATCH, we did not include TRANSFAC Professional PWMs in our analysis. We believe by introducing such PWMs, the number of shared TFBSs would certainly increase.
Conclusions
Marina is a operating-system independent software tool to identify over-represented TFBSs across different groups of promoter sequences. We illustrate its usage using an RNA-Seq plant-pathogen study, however pro-moter sequences from any organism can be analyzed using Marina as long as compatible TFBS models are provided. We also show its capability to identify over-represented TFBSs regardless of input size. Given large sets of DEGs, our results show that by contrasting their promoter sequences, TFBSs perceived during defense and stress response were significantly over-represented. Other lesser-known TFBSs joined these ranks, raising questions as to potential candidate TFs affiliated with defense-response.
The underlying algorithms within this tool are guided by a catalog of user-provided TFBS models be-it DNA motifs or PWMs. Thankfully, many regulatory element resources
and databases exist. By contrasting this software tool to a popular alternative, we show that Marina is built for large promoter-sequence sets while being able to identify biologically sound over-representative TFBSs.
Availability and requirements Project name:Marina.
Project home page: http://mason.gmu.edu/∼phossein/ marina/
Operating system(s):Operating-system independent. Programming language:Java version 7+.
Other requirements:None. License:BSD.
Abbreviations
ABA: Abscisic acid; CO: Cosine metric; CF: Confidence metric; DEG: Differentially expressed gene; IPF: Iterative proportional fitting; JA: Jasmonic acid; JAC: Jaccard; K: Cohen’s kappa; LP: Laplace correction; LI: Lift; NPR1: Non-expressor of PR1; PHI: Phi-coefficient; PWM: Position weight matrix; SR: Soybean rust; TF: Transcription factor; TFBS: Transcription factor binding site.
Competing interests
The authors declare that they have no competing interests.
Authors’ contributions
BFM inspired development of Marina. PH wrote the manuscript, implemented the Marina software tool and underlying algorithms. IO guided the
development of PWM extrapolation and over-representation analyses. All authors read, critiqued and approved the final manuscript.
Acknowledgements
We wish to thank the United States Department of Agriculture – Soybean Genomics and Improvement Laboratory (USDA – SGIL) for research funding and support. We also wish to thank Margaret MacDonald, Eric Brewer, Sara Kabir and Leila Taher for their comments on Marina functionality. Our appreciations also go out to Bret Cooper for advice on RNA-Seq quality analysis and correction. This research was supported in part by the Intramural Research Program of the National Institutes of Health, National Library of Medicine.
Author details
1Department of Bioinformatics and Computational Biology, George Mason
University, Manassas, Virginia, USA.2Computational Biology Branch, National Center for Biotechnology Information, National Institutes of Health, Bethesda, Maryland, USA.3Soybean Genomics and Improvement Laboratory, United States Department of Agriculture, Beltsville, Maryland, USA.
Received: 21 December 2012 Accepted: 28 March 2013 Published: 11 April 2013
References
1. Ria ˜no-Pach ´on DM, Ruzicic S, Dreyer I, Mueller-Roeber B:PlnTFDB: an integrative plant transcription factor database.
BMC Bioinformatics2007,8:.
2. Singh K, Foley RC, O ˜nate-S´anchez L:Transcription factors in plant defense and stress responses.Curr Opin Plant Biol2002,5(5):430–436. 3. Dubos C, Stracke R, Grotewold E, Weisshaar B, Martin C, Lepiniec L:
MYB transcription factors in Arabidopsis.Trends Plant Sci2010, 15(10):573–581.
4. Carrasco JL, Ancillo G, Mayda E, Vera P:A novel transcription factor involved in plant defense endowed with protein phosphatase activity.EMBO2003,22:3376–3384.
5. Bulyk ML:Computational prediction of transcription-factor binding site locations.Genome Biol2003,5:.
6. Cartharius K, Frech K, Grote K, Klocke B, Haltmeier M, Klingenhoff A, Frisch M, Bayerlein M, Werner T:MatInspector and beyond: promoter analysis based on transcription factor binding sites.
7. Pertea M, Mount SM, Salzberg SL:A computational survey of candidate exonic splicing enhancer motifs in the model plant Arabidopsis thaliana.BMC Bioinformatics2007,8:159+.
8. Fauteux F, Stromvik M:Seed storage protein gene promoters contain conserved DNA motifs in Brassicaceae, Fabaceae and Poaceae. BMC Plant Biol2009,9:126+.
9. Vandepoele K, Casneuf T, Van de Peer Y:Identification of novel regulatory modules in dicotyledonous plants using expression data and comparative genomics.Genome Biol2007,7(11).
10. Leelavati N, Ovcharenko I:Identifying regulatory elements in eukaryotic genomes.Brief Funct Genomic Proteomic2009, 8(4):215–230.
11. Chekmenev DS, Haid C, Kel AE:P-Match: transcription factor binding site search by combining patterns and weight matrices.
Nucleic Acids Res2005,33:W432–W437.
12. Loots GG, Ovcharenko I, Pachter L, Dubchak I, Rubin EM:rVista for comparative sequence-based discovery of functional transcription factor binding sites.Genome Res2002,12(5):832–839.
13. Kel AE, Voss N, Jauregui R, Kel-Margoulis OV, Wingender E:Beyond microarrays: Finding key transcription factors controlling signal transduction pathways.BMC Bioinformatics2006,7(S-2). 14. B ¨ulow L, Engelmann S, Schindler M, Hehl R:AthaMap, integrating
transcriptional and post-transcriptional data.Nucleic Acids Res2009, 37(Database-Issue):D983–D986.
15. Palaniswamy SK, James S, Sun H, Lamb RS, Davuluri RV, Grotewold E: AGRIS and AtRegNet: A platform to link cis-regulatory elements and transcription factors into regulatory networks.Plant Physiol2006, 140(3):818–829.
16. Rombauts S, Florquin K, Lescot M, c, Rouz´e P, van de Peer, Y:
Computational approaches to identify promoters and cis-regulatory elements in plant genomes.Plant Physiol2003,132(3):1162–1176. 17. Wingender E, Chen X, Fricke E, Geffers R, Hehl R, Liebich I, Krull M, Matys V,
Michael H, Ohnhauser R, Pruss M, Schacherer F, Thiele S, Urbach S: The TRANSFAC system on gene expression regulation.Nucleic Acids Res2001,29:281–283.
18. Sandelin A, Alkema W, Engstrom P, Wasserman WW, Lenhard B:JASPAR: an open-access database for eukaryotic transcription factor binding profiles.Nucleic Acids Res2007,32:D91–D94.
19. Gabdoulline RR, Eckweiler D, Kel AE, Stegmaier P:3DTF: a web server for predicting transcription factor PWMs using 3D structure-based energy calculations.Nucleic Acids Res2012,
40(Web-Server-Issue):180–185.
20. Horspool NR:Practical fast searching in strings.Softw Pract Exp1980, 10(6):501–506.
21. Ulmasov T, Hagen G, Guilfoyle TJ:ARF1, a transcription factor that binds to auxin response elements.Science1997,276:
1865–1868.
22. Ramakrishnan S, Rakesh A:Mining sequential patterns:
generalizations and performance improvements.InProceedings 5th International Conference Extending Database Technology, EDBT. Avignon, France. London: Springer-Verlag; 1996:3–17.
23. Tan PN, Kumar V, Srivastava J:Selecting the right interestingness measure for association patterns.InProceedings of the Eighth ACM SIGKDD International Conference on Knowledge Discovery and Data Mining, KDD ’02. Edmonton, AB , Canada; 2002:32–41.
24. Geng L, Hamilton HJ:Interestingness measures for data mining: a survey.ACM Comput Surv2006,38(3).
25. Steinbach M, Tan PN, Xiong H, Kumar V:Objective measures for association pattern analysis.Contemp Math2007,443:205–226. 26. Agrawal R, Imielinski T, Swami A:Mining association rules between
sets of items in large databases.InACM SIGMOD Intl. Conf. Management of Data. Washington, D.C. New York: ACM; 1993:207–216.
27. Merceron A, Yacef K:Interestingness measures for association rules in educational data.InProceedings of Educational Data Mining 2008: 1st International Conference on Educational Data Mining. Montreal, Quebec; 2008:57–66.
28. Jaccard P:`Etude comparative de la distribution florale dans une portion des Alpes et des Jura.Bull Soci´et´e Vaudoise des Sci Naturelles 1901,37:547–579.
29. Cohen J:A coefficient of agreement for nominal scales.Educ Psychol Meas1960,20:37–46.
30. Good IJ:booktitle=The Estimation of Probabilities: An Essay on Modern Bayesian Methods, Volume 30 of Research Monograph,. Cambridge: M.I.T. Press; 1965.
31. Brin S, Motwani R, Ullman JD, Tsur S:Dynamic itemset counting and implication rules for market basket data.InSIGMOD 1997, Proceedings ACM SIGMOD International Conference on Management of Data. Tucson, Arizona. New York: ACM; 1997:255–264.
32. Cram´er H:Mathematical Methods of Statistics.Princeton mathematical series: Princeton University Press; 1946.
33. Deming WE, Stephan FF:On a least squares adjustment of a sampled frequency table when the expected marginal totals are known. Ann Math Stat1940,11(4):427–444.
34. Mosteller F:Association and estimation in contingency tables. J Am Stat Assoc1968,63(321):1–28.
35. Tan PN, Kumar V, Srivastava J:Selecting the right objective measure for association analysis.Inf Syst2004,29:293–313.
36. Tremblay A, Hosseini P, Alkharouf NW, Li S, Matthews BF:Gene expression in leaves of susceptibleGlycine maxduring infection withPhakopsora pachyrhiziusing next generation sequencing. Sequencing2011:14.
37. Peterson JD, Umayam LA, Dickinson TM, Hickey EK, White O:The comprehensive microbial resource.Nucleic Acids Res2001,29: 123–125.
38. Li H, Durbin R:Fast and accurate short read alignment with Burrows-Wheeler transform.Bioinformatics2009,25(14):1754–1760. 39. Mortazavi A, Williams BA, McCue K, Schaeffer L, Wold B:Mapping and quantifying mammalian transcriptomes by RNA-Seq.Nat Methods 2008,5(7):621–628.
40. Rushton PJ, Somssich IE, Ringler P, Shen QJ:WRKY transcription factors. Trends Plant Sci2010,15(5):247–258.
41. Eulgem T:Dissecting the WRKY web of plant defense regulators. PLoS Pathogy2006,2(11).
42. Eulgem T, Rushton PJ, Robatzek S, Somssich IE:The WRKY superfamily of plant transcription factors.Journal2000,5(5):199–206.
43. Eulgem T, Somssich IE:Networks of WRKY transcription factors in defense signaling.Curr Opin Plant Biol2007,10(4):366–371. 44. Pandey SP, Somssich IE:The role of WRKY transcription factors in
plant immunity.Plant Physiol2009,150(4):1648–1655.
45. Yu D, Chen C, Chen Z:Evidence for an important role of WRKY DNA binding proteins in the regulation of NPR1 gene expression. Plant Cell2001,13(7):1527–1540.
46. Dong X:NPR1, all things considered.Curr Opin Plant Biol2004, 7(5):547–552.
47. Sibout R, Sukumar P, Hettiarachchi C, Holm M, Muday GK, Hardtke CS: Opposite root growth phenotypes of hy5 versus hy5 hyh mutants correlate with increased constitutive auxin signaling.
PLoS Genet2004,2(11).
48. Cluis CP, Mouchel CF, Hardtke CS:The Arabidopsis transcription factor HY5 integrates light and hormone signaling pathways.
Plant2004,38(2):332–347.
49. Prasad BRVP, Kumar SV, Nandi A, Chattopadhyay S:Functional interconnections of HY1 with MYC2 and HY5 in Arabidopsis seedling development.BMC Plant Biol2012,12(37).
50. Boter M, Ru´ız-Rivero O, Abdeen A, Prat S:Conserved MYC transcription factors play a key role in jasmonate signaling both in tomato and Arabidopsis.Journal2004,18(13):1577–1591.
51. Abe H, Urao T, Itom T, Seki M, Shinozaki K, Yamaguchi-Shinozaki K: Arabidopsis AtMYC2 (bHLH) and AtMYB2 (MYB) function as transcriptional activators in abscisic acid signaling.Plant Cell2003, 15:63–78.
52. Kaplan-Levy RN, Brewer PB, Quon T, Smyth DR:The trihelix family of transcription factors - light, stress and development.Trends Plant Sci 2012,17(3):163–171.
53. Xie ZM, Zou HF, Lei G, Wei W, Zhou QY, Niu CF, Liao Y, Tian AG, Ma B, Zhang WK, Zhang JS, Chen SY:Soybean trihelix transcription factors GmGT-2A and GmGT-2B improve plant tolerance to abiotic stresses in transgenic Arabidopsis.PLoS ONE2009,4(9):e6898.
54. Pison G, Struyf A, Rousseeuw PJ:Displaying a clustering with CLUSPLOT.Comput Stat Data Anal1999,30(4):381–392.
sites including their positional preference.PLoS Comput Biology2011, 7(2):e1001070+.
56. Yamamoto YY, Obokata J:ppdb: a plant promoter database. Nucleic Acids Res2008,36(Database issue):D977–D981.
57. Chang WCC, Lee TYY, Huang HDD, Huang HYY, Pan RLL:PlantPAN: Plant promoter analysis navigator, for identifying combinatorial cis-regulatory elements with distance constraint in plant gene groups.BMC Genomics2008,9:561+.
doi:10.1186/1746-4811-9-12
Cite this article as:Hosseiniet al.:Using an ensemble of statistical metrics to quantify large sets of plant transcription factor binding sites.Plant Methods 20139:12.
Submit your next manuscript to BioMed Central and take full advantage of:
• Convenient online submission
• Thorough peer review
• No space constraints or color figure charges
• Immediate publication on acceptance
• Inclusion in PubMed, CAS, Scopus and Google Scholar
• Research which is freely available for redistribution