R E S E A R C H A R T I C L E
Open Access
Outpatient red blood cell transfusion payments
among patients on chronic dialysis
Matthew Gitlin
1*, J Andrew Lee
1, David M Spiegel
2, Jeffrey L Carson
3, Xue Song
4, Brian S Custer
5, Zhun Cao
4,
Katherine A Cappell
4, Helen V Varker
4, Shaowei Wan
1and Akhtar Ashfaq
1Abstract
Background:Payments for red blood cell (RBC) transfusions are separate from US Medicare bundled payments for dialysis-related services and medications. Our objective was to examine the economic burden for payers when chronic dialysis patients receive outpatient RBC transfusions.
Methods:Using Truven Health MarketScanWdata (1/1/02-10/31/10) in this retrospective micro-costing economic analysis, we analyzed data from chronic dialysis patients who underwent at least 1 outpatient RBC transfusion who had at least 6 months of continuous enrollment prior to initial dialysis claim and at least 30 days post-transfusion follow-up. A conceptual model of transfusion-associated resource use based on current literature was employed to estimate outpatient RBC transfusion payments. Total payments per RBC transfusion episode included screening/ monitoring (within 3 days), blood acquisition/administration (within 2 days), and associated complications (within 3 days for acute events; up to 45 days for chronic events).
Results:A total of 3283 patient transfusion episodes were included; 56.4% were men and 40.9% had Medicare supplemental insurance. Mean (standard deviation [SD]) age was 60.9 (15.0) years, and mean Charlson comorbidity index was 4.3 (2.5). During a mean (SD) follow-up of 495 (474) days, patients had a mean of 2.2 (3.8) outpatient RBC transfusion episodes. Mean/median (SD) total payment per RBC transfusion episode was $854/$427 ($2,060) with 72.1% attributable to blood acquisition and administration payments. Complication payments ranged from mean (SD) $213 ($168) for delayed hemolytic transfusion reaction to $19,466 ($15,424) for congestive heart failure. Conclusions:Payments for outpatient RBC transfusion episodes were driven by blood acquisition and
administration payments. While infrequent, transfusion complications increased payments substantially when they occurred.
Keywords:Dialysis, Red blood cell transfusions, Payers, Cost
Background
Anemia is common in end-stage renal disease (ESRD) and results from reduction of erythropoietin production [1]. Prior to the development of pharmacologic treatments for anemia, red blood cell (RBC) transfusions were the mainstay of anemia treatment, and approximately 55% to 60% of dialysis patients received RBC transfusions to avoid severe anemia [2,3]. RBC transfusions are associated with a variety of complications, including hemolytic and non-hemolytic transfusion reactions, infections, transfusion-related acute lung injury (TRALI), transfusion-associated
circulatory overload (TACO), and hyperkalemia [3-10]. In 2009, the rate of RBC transfusion-associated adverse reactions across all disease states was reported as approximately 0.25% [11]. However, the rates of RBC transfusion-related complications may be higher among chronic dialysis patients because of their significant
comorbid disease severity and concerns about patients’
fluid overload. Furthermore, while the overall rates of these complications may be low, their outcomes can be severe (hospitalization or death) and their associated costs are high [12-14].
The use of RBC transfusion as a treatment for anemia declined dramatically after the approval of the first erythropoiesis-stimulating agent (ESA) in 1989 [15,16].
* Correspondence:mgitlin@amgen.com
1Amgen, Inc., One Amgen Center Drive, Thousand Oaks, CA, USA Full list of author information is available at the end of the article
In the 1995 annual report of the United States Renal Data System (USRDS), the reported rate of outpatient RBC transfusion in hemodialysis patients dropped from 16% in 1989 to 2% by 1993 [17]. The overall rate of RBC transfusions (per 1000 patient-years) in the hemodialysis setting decreased by about half from 535.33 in 1992 to 263.65 in 2005 [16]. About 83% to 94% of chronic dialysis patients now use an ESA to treat chronic anemia [18]. With the newly implemented Medicare Prospective Pay-ment System (PPS) for ESRD patients, reimbursePay-ment to providers is capitated to include dialysis and separately billable medications and services (ie, ESAs, iron, dialysis supplies, lab tests) but does not include blood and blood products. Since RBC transfusion use in ESRD patients on dialysis could potentially increase, it is important to understand transfusion-associated payments and out-comes in this patient population.
Incomplete accounting of payments related to RBC transfusion administration may provide misleading infor-mation to policy makers determining reimbursement policy in a healthcare system such as Medicare. The pur-pose of this retrospective claims analysis study was to use a micro-costing approach to examine the economic burden for payers when chronic dialysis patients receive outpatient RBC transfusions. This study will assist in quantifying the economic impact to payers of RBC transfusions as they are tracked within many of the PPS surveillance programs and will inform future studies examining RBC transfusion and associated payments in Medicare claims data.
Methods
Data sources
The Truven Health MarketScanW Commercial Claims
and Encounter and Medicare Supplemental and Coord-ination of Benefits Databases were used for this study. These databases are constructed from privately insured paid medical and prescription drug claims. The Market-Scan Commercial Database contains the inpatient, out-patient, and outpatient prescription drug experience of approximately 30 million employees and their depen-dents (in 2010) covered under a variety of fee-for-service plans, managed care health plans, and indemnity plans. In addition, the MarketScan Medicare Database contains the healthcare experience of approximately 3.42 million retirees (in 2010) with Medicare supplemental insurance paid for by employers. Medicare-covered portion of payment, employer-paid portion, and patient-paid por-tion are included in this database. The MarketScan Commercial and Medicare Databases provide detailed cost, use, and outcomes data for healthcare services per-formed in both inpatient and outpatient settings. The medical claims are linked to outpatient
prescription-drug claims and person-level enrollment data through the use of unique enrollee identifiers. All personal iden-tifiers were removed.
Transfusion episode inclusion criteria
All analyses in this study were performed at the level of the transfusion episode. Eligible patients were first identified using the following criteria: inclusion in the MarketScan Commercial or Medicare Databases with
≥ 2 claims (to ensure that they were treated for chronic disease) for chronic dialysis ≥ 30 days apart and within 365 days between January 1, 2002, and October 31, 2010 (codes used to identify chronic dialysis claims are listed
in Additional file 1: Table S1); had ≥ 6 months of
con-tinuous enrollment prior to first chronic dialysis claim to
measure baseline clinical characteristics; had ≥ 1
out-patient RBC blood transfusion on or after date of first chronic dialysis claim through January 31, 2011 (codes used to identify RBC blood transfusion claims are listed in Additional file 1: Table S2); had no terminating events (defined as end of continuous enrollment, end of MarketScan data [January 31, 2011], death, or kidney transplant) between first chronic dialysis claim and first
outpatient RBC transfusion; and had ≥ 30 days of
con-tinuous enrollment after the first RBC transfusion to iden-tify and measure subsequent RBC transfusion-related complications. RBC transfusions were identified using revenue codes (UB-04), Current Procedural Terminology (CPT), and Healthcare Common Procedure Coding Sys-tem (HCPCS) codes (codes used to identify transfusion-related complications claims are listed in Additional file 1: Table S3).
Variable definition and time frame
Demographic information was collected on the date of the first chronic dialysis claim. Clinical characteristics were measured during the 180 days prior to the first chronic dialysis claim. Because some patients had multiple RBC transfusion claims within a short time frame, we combined individual claims within 3 days of each other into a transfusion episode, which was the unit of obser-vation for this study. Because pre- and post-transfusion screening and monitoring payments could not be differ-entiated for patients with more than 1 transfusion claim within an episode, we combined screening and monitoring
payments 3 days prior to and 3 days post–transfusion episode. Blood acquisition and administration payments were examined from transfusion episode date to 2 days post–RBC transfusion episode.
With the exception of delayed hemolytic transfusion reactions, all complications were identified up to 0 to 3 days post–RBC transfusion episode. Hemolytic trans-fusion reactions were identified 4 to 45 days post–RBC transfusion episode (Figure 2). If a claim for RBC
transfusion–related complication was linked to ≥ 1
RBC transfusion episode, it was linked to the earliest epi-sode. If a claim for a complication could not be linked to Figure 1Patient selection time frame.
an RBC transfusion episode based on the described time windows, the claim was not included in the analyses.
Micro-costing/component analysis approach
We used a micro-costing approach to measure cost based on the components of resource units and their payment values [19-21]. We included payments for blood acquisition, transfusion administration, RBC transfusion– related lab tests, and transfusion complications [21]. For the base-case analysis, we calculated component payments for (1) RBC transfusion screening and moni-toring, (2) blood acquisition and administration, and (3) transfusion-related complication, which were summed to calculate (4) total payment for each RBC transfusion episode.
We conducted subgroup analyses for (1) patients with an acute bleed or surgery during the 180 days prior to initial dialysis claim, (2) patients with cancer or blood disease during the 180 days prior to initial dialysis claim, and (3) patients who experienced an RBC transfusion-related complication, by type of complication. We also performed sensitivity analyses by excluding cost outliers (RBC transfusion episodes with the top 1% of blood acquisition and administration costs or those with costs equal to $0 were excluded), varying the payment time frames (using both a narrow and broad time window [defined in Figure 2] in identifying and defining payment claims to RBC transfusion episodes), and estimating mean payment per unit of blood based on a blood acqui-sition and administration claim analysis.
Results
Patient sample
From an initial sample of 105,260 patients with ≥ 2
chronic dialysis claims, we had a final sample of 3,283 chronic dialysis patients who met all of the selection
criteria. Requiring 6 months of pre-index data and ≥ 1
outpatient RBC transfusion contributed to the greatest loss of subjects. Among the 3,283 chronic dialysis patients, there were 7,049 outpatient RBC transfusion episodes used in the micro-costing analyses. Mean (standard devi-ation [SD]) patient follow-up was 494.76 (474.19) days.
Patient demographics and clinical characteristics
Patients’ demographic and clinical characteristics are
presented in Table 1. Mean (SD) age was 60.9 (15.0) years, 56.4% of patients were men, and 40.9% of patients had Medicare supplemental insurance. The three most frequent comorbidities were hypertension (93.9%), dia-betes (50.6%), and CHF (35.6%). Hemodialysis was per-formed in 60.8% of patients, peritoneal dialysis in 6.3%, and type of dialysis was unknown in 33.4%. Patients experienced a mean 2.15 transfusion episodes during the follow-up period. Transfusion was administered at
outpatient hospital facilities in 82.0%, ESRD facilities in 9.4%, hospital emergency rooms in 2.6%, and unknown in 6%.
Red blood cell transfusion episode payments
The component and total payments for RBC blood transfusion episodes are presented in Table 2. Mean (SD) total payment per RBC transfusion episode was $854 ($2,060). The median payment was $427 (25th percentile, $53; 75th percentile, $1071), suggesting that payments were not normally distributed. The largest component (72.0%) of the total payment was blood ac-quisition and administration (mean, $615; SD, $1,237; median, $289). Pre- and post-transfusion screening and monitoring component payments represented 22.6% of the total payment (mean, $193; SD, $616; median, $34).
Table 1 Demographic and clinical characteristics
Patients
N = 3,283a
Age, mean years (SD) 60.9 (15.0)
Sex, n male (%) 1,850 (56.4)
Geographic region, n (%)
Northeast 253 (7.7)
North Central 975 (29.7)
South 1,459 (44.4)
West 585 (17.8)
Unknown 11 (0.3)
Payer, n (%)
Commercial 1,941 (59.1)
Medicare 1,342 (40.9)
Deyo Charlson comorbidity index, mean score (SD) 4.32 (2.45)
Comorbid conditions, n (%)
Hypertension 3,084 (93.9)
Diabetes 1,662 (50.6)
CHF 1,167 (35.6)
Acute bleeding 748 (22.8)
Surgery 719 (21.9)
Cancer 680 (20.7)
COPD 460 (14.0)
Hyperkalemia 423 (12.9)
Dialysis modality, n (%)
Hemodialysis 1,997 (60.8)
Peritoneal dialysis 207 (6.3)
Unknown 1,095 (33.4)
Transfusion episodes with≥30 days follow-up, mean number (SD)
2.15 (3.78)
Length of follow-up, mean days (SD) 494.76 (474.19)
a
Chronic dialysis patients with≥1 outpatient red blood cell transfusion episode.
Payments for complications when averaged across all RBC transfusion episodes were relatively low (mean, $75; SD, $1,317; median, $0) but individual episode pay-ments ranged from mean (SD) $213 ($168) for delayed hemolytic transfusion reaction to $19,466 ($15,424) for CHF. When evaluating total payments by primary payer type, the mean payments were similar. Mean payments (median; SD) per RBC blood transfusion episode were $855 ($388; $2,728) and $853 ($457; $1,428) for Medi-care primary and commercial primary, respectively.
Subgroup analyses
We estimated per RBC transfusion episode payments for 3 subgroups (Figure 3). Screening and monitoring costs varied minimally between patients with cancer or blood disease; patients with an acute bleed or surgery; and patients who did not have cancer, blood disease, acute
bleed, or surgery. However, there was significant vari-ation in blood acquisition and administrvari-ation payments. Patients with cancer or blood disease had the highest mean payment (mean, $737; SD, $1,502), followed by patients with neither acute bleed nor cancer (mean, $542; SD, $1,044). Mean total payment per RBC transfu-sion episode was higher than base-case estimates (Table 2) for patients with cancer or blood disease (mean, $969; SD, $1,948) and lower than base-case estimates for patients with an acute bleed or surgery (mean, $733; SD, $1,195).
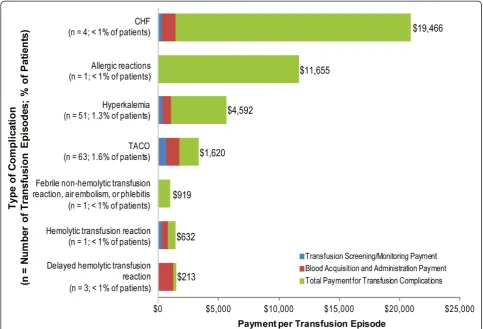
Figure 4 summarizes payments made for various types of transfusion-related complications. Payments for CHF (mean, $19,466) and allergic reactions (mean, $11,655) were the most expensive complication payments. TACO (63 episodes) and hyperkalemia (51 episodes), were the most commonly observed types of complications. Among the RBC transfusion episodes associated with
Table 2 Base-case payment per red blood cell transfusion episode
Payments and Events All patientsa(N= 3,283); All episodes (N = 7,049) Min Max
Mean SD Median 25th percentile 75th percentile
Average payment per episode
All payers
Transfusion screening/monitoring $193 $616 $34 $0 $189 $0 $22,673
Blood acquisition and administration $615 $1,237 $289 $11 $801 $0 $30,962
Transfusion complications $75 $1,317 $0 $0 $0 $0 $61,059
TOTAL screening, transfusion and complication payments
$854 $2,060 $427 $53 $1,065 $0 $74,452
Number of services per episode
Transfusion screening/monitoring 2.87 2.93 2.00 0.09 5.00 0.00 20.00
Blood acquisition and administration 2.04 1.26 2.00 1.00 3.00 1.00 12.83
a
Patients with≥1 outpatient red blood cell transfusion. SD, standard deviation.
hyperkalemia complications, 69.1% of the hyperkalemia events occurred on the same date as the RBC transfu-sion start date.
Sensitivity analyses
We performed sensitivity analyses by excluding cost out-liers, varying time frames (narrow- and broad-window time frames) and reestimating the component and total payments per RBC transfusion episode. As shown in Table 3, relative to base-case estimates, screening and monitoring component payments increased slightly when outliers were excluded (mean, $214; SD, $451) and when we used the broad-window time frame (mean, $225;
SD, $712) but decreased slightly when we used the narrow-window time frame (mean, $172; SD, $598). Blood acquisition and administration payments were higher when outliers were excluded (mean, $696; SD, $701) but similar to the base case estimates when narrowing and broadening the time frame. When using the broad-window time frame, complication payments greatly increased from the base case’s mean (SD) of $75 ($1,317) to a mean of $120 ($1,520). Total payment per RBC transfusion episode was highest when cost outliers were excluded (mean, $971; SD, $1,982) and when we used the broad-window time frame (mean, $931; SD, $2,239) compared to the base-case estimates.
Figure 4Mean red blood cell transfusion payments for patients with complications, by type of complication.Abbreviations: CHF, congestive heart failure; TACO, transfusion-associated circulatory overload.
Table 3 Sensitivity analysis of RBC transfusion episode payments by time frame
Mean payments (SD) Base case Drop top 1% and bottom $0 patients Narrow window Broad window
(N = 7,049) (N = 4,844) (N = 7,049) (N = 7,049)
Screening/monitoring $193 (615) $214 (451) $172 (598) $225 (712)
Acquisition/administration $615 (1,237) $696 (701) $615 (1,237) $615 (1,237)
Complication $75 (1,317) $86 (1,541) $56 (1,149) $120 (1,521)
Total payment per RBC transfusion $854 (2,060) $971 (1,982) $814 (1,940) $931 (2,239)
Finally, we estimated component payments per blood acquisition and administration unit. Per-unit data were available for 340 outpatient RBC transfusion episodes. When these episodes were analyzed, the transfusion screening/monitoring mean (SD) payment was $245 ($425), the blood acquisition and administration mean payment was $433 ($495), and the mean payment for transfusion complications was $153 ($1,915). Per-unit total transfusion episode mean payment was $827 ($2,127).
Discussion
We evaluated 3,283 chronic dialysis patients with at least 1 outpatient setting RBC transfusion episode. Most of the patients had diabetes measured during the pre-index period. In the base case, 72.1% of the total payments were due to blood acquisition and administration, with the remainder of payments attributable to screening and monitoring and, to a lesser extent, transfusion-related complications. Total RBC transfusion payments were higher for patients with cancer or blood disease than those with an acute bleed or in our base-case estimates. Sensitivity analyses suggest that the base-case results were robust. Total payment estimates increased when both the top 1% most expensive episodes and $0 pay-ment episodes were excluded. Paypay-ments became slightly lower when a narrow-window time frame was used and increased slightly with a broad-window time frame. The variations in total payments among all sensitivity ana-lyses were less than 15% different from the base-case total payment estimates. Across all sensitivity analyses, the blood acquisition and administration payments con-sistently were the most expensive component payment.
Under the newly implemented Medicare PPS for ESRD patients, reimbursement is capitated to include dialysis and previously separately billable medications and ser-vices. Payments for blood and blood products are not, however, included in the new PPS bundle. As patients are treated to a lower hemoglobin level, the resulting lower hemoglobin levels could also create a medical necessity for RBC transfusions. The use of transfusions to supple-ment ESA therapy in ESRD patients on dialysis may increase because of economic incentives and clinical necessity. It is, therefore, important to comprehensively examine the transfusion-associated payments made within the chronic dialysis patient population in order to under-stand the economic consequences of the recent changes in reimbursement.
Our results differ somewhat from a recent cost analysis that used an activity-based costing model of RBC trans-fusions in a surgical population (based on observation of real-life activities in four hospitals in the United States and Europe) to identify the costs for each transfusion-related task and resource [21]. Overall, total inpatient
RBC transfusion costs were $522 to $1183 (mean, $761) per unit across the four hospitals (a considerable por-tion of the costs was related to pre-surgical testing for blood type/screening in patients who never received a transfusion) [21]. These results were similar but slightly lower than our mean per-unit payment estimate of $827 (SD, $2,127). Blood acquisition costs in the other study were only 21% to 32% ($154 to $248 in 2008 dollars) of the total RBC transfusion-related costs. We found blood acquisition and administration payments accounted for 50% to70% of total payments, but could not differentiate acquisition and administration payments with certainty in the claims data. Patient testing and administration and monitoring of RBC transfusions and pretransfusion pro-cesses were 24% to 36% of total costs. Managing acute transfusion reactions and hemovigilance contributed to 0% to 2% of costs [21]. The type and level of detail avail-able in the data as well as place of service (inpatient vs outpatient setting) may explain some of the differences in our estimates from those of Shandler et al. Moreover, costs associated with blood acquisition and administra-tion can vary according to the amount (units) and type (eg, leukoreduced or irradiated) of blood.
complication events included in the micro-costing design. We did not have information on patient race/ ethnicity. We were missing type of dialysis in about one third of cases. We did not evaluate inpatient costs because the inpatient claims data were based on diagnosis-related group (DRG) codes and could not be separated out into payment components. The focus of this analysis was on the payer burden of RBC transfu-sions and as a result of payments for inpatient hospital admissions being capitated into DRG payments, there is no ability to estimate the payer burden of inpatient-administered RBC transfusions. The majority (about 85%) of transfusions for dialysis patients occur in the inpatient setting [22], and thus the economic burden of transfu-sions is likely greatest in the inpatient setting, but of con-cern to the inpatient hospital rather than the third party payer, which is beyond the scope of this analysis. The economic burden of inpatient transfusions is likely to be similar to those for outpatient transfusions and the costs associated with complications arising from outpatient transfusions are also likely to be similar, if not greater than outpatient transfusions as a result of patient severity (as demonstrated by the patient being in the inpatient setting). Future analyses should focus on the provider cost burden of both outpatient and inpatient adminis-tered RBC transfusions. Finally, patients in our sample had either commercial insurance or Medicare plus Medicare supplemental insurance as their primary cover-age, and therefore, the results may not be generalizable to patients who are uninsured, are covered only by Medi-care, or have other types of insurance coverage.
Conclusion
This is the first study to examine payments for out-patient RBC transfusions in a population of out-patients undergoing chronic dialysis. Our study shows that pay-ments for outpatient RBC transfusion episodes are pri-marily driven by blood acquisition and administration payments. Additionally, there are travel and other costs to dialysis patients for RBC transfusion episodes and increased risk for allosensitization; these could not be estimated here, but are important costs associated with RBC transfusions. While infrequent, transfusion compli-cations increase payments substantially when they occur.
Better understanding of RBC transfusion episodes’
pay-ments and costs to patient may help inform policy makers when determining the appropriate reimbursement policy for chronic dialysis patients.
Additional file
Additional file 1:Supplementary Material: Inpatient and Outpatient Transfusion Billing Codes.
Abbreviations
CHF: Congestive heart failure; CPT: Current Procedural Terminology; DOPPS: Dialysis Outcomes and Practice Patterns Study; ESA: Erythropoiesis-stimulating agent; ESRD: End-stage renal disease; HCPCS: Healthcare Common Procedure Coding System; PPS: Prospective Payment System; RBC: Red blood cell; SD: Standard deviation; TACO: Transfusion-associated circulatory overload; TRALI: Transfusion-related acute lung injury; USRDS: United States Renal Data System.
Competing interests
Dr. Spiegel has been a consultant, received research funding, and served on the speakers bureau for Amgen, and has served on scientific advisory boards for Amgen and Genzyme. Dr. Carson financial research support from Amgen. Dr. Custer received consulting fees from Amgen for this project. Dr. Song, Dr. Cao, Dr. Cappell, and Ms. Varker are employees of Truven Health, Cambridge, MA, which provides consulting services to clients, including the pharmaceutical industry. Dr. Gitlin, Dr. Lee, Dr. Wan, and Dr. Ashfaq are employees and stockholders of Amgen Inc.
Authors' contributions
MG contributed to the conception of the study, study design, analysis and interpretation of the data; contributed to the writing and revision of the manuscript; and approved the final draft for submission. JAL contributed to the conception of the study, study design, analysis and interpretation of the data; contributed to the writing and revision of the manuscript; and approved the final draft for submission. DMS contributed to the conception of the study, study design, analysis and interpretation of the data; contributed to the writing and revision of the manuscript; and approved the final draft for submission. JLC contributed to the conception of the study, study design, analysis and interpretation of the data; contributed to the writing and revision of the manuscript; and approved the final draft for submission. BSC contributed to the conception of the study, study design, analysis and interpretation of the data; contributed to the writing and revision of the manuscript; and approved the final draft for submission. SW contributed to the conception of the study, study design, analysis and interpretation of the data; contributed to the writing and revision of the manuscript; and approved the final draft for submission. AA contributed to the conception of the study, study design, analysis and interpretation of the data; contributed to the writing and revision of the manuscript; and approved the final draft for submission. XS contributed to acquisition of data and analysis and interpretation of the data, contributed to the writing and revision of the manuscript, and approved the final draft for submission. ZC contributed to acquisition of data and analysis and interpretation of the data, contributed to the writing and revision of the manuscript, and approved the final draft for submission. KAC contributed to acquisition of data and analysis and interpretation of the data, contributed to the writing and revision of the manuscript, and approved the final draft for submission. HVV contributed to the acquisition of the data, contributed to the writing and revision of the manuscript, and approved the final draft for submission.
Acknowledgments
We wish to thank Linda Rice, PhD, of Amgen Inc. and Julia R. Gage, PhD, of Gage Medical Writing, LLC for their editorial assistance and Tracy Johnson, BA, of Complete Healthcare Communications, Inc. on behalf of Amgen for post-submission editing assistance. This study was funded by Amgen Inc.
Author details 1
Amgen, Inc., One Amgen Center Drive, Thousand Oaks, CA, USA.2University of Colorado, Denver, CO, USA.3UMDNJ-Robert Wood Johnson Medical School, New Brunswick, NJ, USA.4Truven Health Analytics, Cambridge, MA, USA.5Blood Systems Research Institute, San Francisco, CA, USA.
Received: 21 March 2012 Accepted: 28 October 2012 Published: 2 November 2012
References
1. Sargent JA, Acchiardo SR:Iron requirements in hemodialysis.Blood Purif
2004,22(1):112–123.
3. Eschbach JW, Adamson JW:Anemia of end-stage renal disease (ESRD).
Kidney Int1985,28(1):1–5.
4. Beauregard P, Blajchman MA:Hemolytic and pseudo-hemolytic transfusion reactions: an overview of the hemolytic transfusion reactions and the clinical conditions that mimic them.Transfus Med Rev1994, 8(3):184–199.
5. Despotis GJ, Zhang L, Lublin DM:Transfusion risks and transfusion-related pro-inflammatory responses.Hematol Oncol Clin North Am2007, 21(1):147–161.
6. Dodd RY, Notari EP, Stramer SL:Current prevalence and incidence of infectious disease markers and estimated window-period risk in the American Red Cross blood donor population.Transfusion (Paris)2002, 42(8):975–979.
7. Eder AF, Chambers LA:Noninfectious complications of blood transfusion.
Arch Pathol Lab Med2007,131(5):708–718.
8. Gilliss BM, Looney MR, Gropper MA:Reducing noninfectious risks of blood transfusion.Anesthesiology2011,115(3):635–649.
9. Simon GE, Bove JR:The potassium load from blood transfusion.Postgrad Med1971,49(6):61–64.
10. Vella JP, O’Neill D, Atkins N, Donohoe JF, Walshe JJ:Sensitization to human leukocyte antigen before and after the introduction of erythropoietin.
Nephrol Dial Transplant1998,13(8):2027–2032.
11. The 2009 National Blood Collection and Utilization Survey Report. Washington, DC: US Department of Health and Human Services, Office of the Assistant Secretary for Health; 2011.
12. Allain JP, Stramer SL, Carneiro-Proietti AB, Martins ML, da Silva SN L, Ribeiro M, Proietti FA, Reesink HW:Transfusion-transmitted infectious diseases.
Biologicals2009,37(2):71–77.
13. Healthcare Cost and Utilization Project (HCUP):HCUP Nationwide Inpatient Sample (NIS). Rockville, MD: Agency for Healthcare Research and Quality; 2007–2009.
14. Kumar A:Perioperative management of anemia: limits of blood transfusion and alternatives to it.Cleve Clin J Med2009,76(Suppl 4):S112–S118. 15. Goodnough LT, Strasburg D, Riddell J, Verbrugge D, Wish J:Has
recombinant human erythropoietin therapy minimized red-cell transfusions in hemodialysis patients?Clin Nephrol1994,41(5):303–307. 16. Ibrahim HN, Ishani A, Foley RN, Guo H, Liu J, Collins AJ:Temporal trends in
red blood transfusion among US dialysis patients, 1992–2005.
Am J Kidney Dis2008,52(6):1115–1121.
17. US Renal Data System:USRDS 1995 Annual Data Report. Bethesda, MD: The National Institutes of Health, National Institute of Diabetes and Digestive and Kidney Diseases; 1995.
18. Pisoni RL, Bragg-Gresham JL, Young EW, Akizawa T, Asano Y, Locatelli F, Bommer J, Cruz JM, Kerr PG, Mendelssohn DC,et al:Anemia management and outcomes from 12 countries in the Dialysis Outcomes and Practice Patterns Study (DOPPS).Am J Kidney Dis2004,44(1):94–111.
19. Drummond MF, O’Brien B, Stoddart GL, Torrance GW:Methods for the economic-evaluation of health care programmes. New York, NY: Oxford University Press; 1997.
20. Gold MR, Siegel JE, Russell LB, Weinstein MC:Cost-Effectiveness in Health and Medicine. New York, NY: Oxford University Press; 1996.
21.r Shander A, Hofmann A, Ozawa S, Theusinger OM, Gombotz H, Spahn DR: Activity-based costs of blood transfusions in surgical patients at four hospitals.Transfusion (Paris)2010,50(4):753–765.
22. Lawler EV, Bradbury BD, Fonda JR, Gaziano JM, Gagnon DR:Transfusion burden among patients with chronic kidney disease and anemia.
Clin J Am Soc Nephrol2010,5(4):667–672.
doi:10.1186/1471-2369-13-145
Cite this article as:Gitlinet al.:Outpatient red blood cell transfusion payments among patients on chronic dialysis.BMC Nephrology2012
13:145.
Submit your next manuscript to BioMed Central and take full advantage of:
• Convenient online submission
• Thorough peer review
• No space constraints or color figure charges
• Immediate publication on acceptance
• Inclusion in PubMed, CAS, Scopus and Google Scholar
• Research which is freely available for redistribution