R E S E A R C H A R T I C L E
Open Access
Statistical evaluation of adding multiple risk
factors improves Framingham stroke risk
score
Xiao-Hua Zhou
1,2*, Xiaonan Wang
3, Ashlee Duncan
4, Guizhou Hu
4and Jiayin Zheng
5,6,2Abstract
Background:Framingham Stroke Risk Score (FSRS) is the most well-regarded risk appraisal tools for evaluating an individual’s absolute risk on stroke onset. However, several widely accepted risk factors for stroke were not included in the original Framingham model. This study proposed a new model which combines an existing risk models with new risk factors using synthesis analysis, and applied it to the longitudinal Atherosclerosis Risk in Communities (ARIC) data set.
Methods:Risk factors in original prediction models and new risk factors in proposed model had been discussed. Three measures, like discrimination, calibration and reclassification, were used to evaluate the performance of the original Framingham model and new risk prediction model.
Results:Modified C-statistics, Hosmer-Lemeshow Test and classless NRI, class NRI were the statistical indices which, respectively, denoted the performance of discrimination, calibration and reclassification for evaluating the newly developed risk prediction model on stroke onset. It showed that the NEW-STROKE (new stroke risk score prediction model) model had higher modified C-statistics, smaller Hosmer-Lemeshow chi-square values after recalibration than original FSRS model, and the classless NRI and class NRI of the NEW-STROKE model over the original FSRS model were all significantly positive in overall group.
Conclusion:The NEW-STROKE integrated with seven literature-derived risk factors outperformed the original
FSRS model in predicting the risk score of stroke. It illustrated that seven literature-derived risk factors contributed significantly to stroke risk prediction.
Keyword: Framingham model, C-statistics, Synthesis analysis, NRI, Discrimination, Calibration, Reclassification
Background
Despite a consistent decline in stroke mortality over the last twenty-plus years, cerebrovascular disease remains a major cause of death and disability in the U.S. and worldwide [1–4]. Epidemiological studies in various populations have reported numerous risk fac-tors for stroke, including age, ethnicity, blood pres-sure, pre-existing cardiovascular disease, and diabetes mellitus [5–13]. Integrating these reported factors, several assessment models have been developed to
evaluate an individual’s absolute risk for stroke onset [14–20]. One of the most well-regarded stroke risk appraisal tools is the Framingham Stroke Risk Score (FSRS), as developed from the Framingham Heart Study [14–16, 21]. However, despite it prominence, several widely accepted risk factors for stroke, such as body weight and shape [22–26] and family history [27–30] were not included in the original Framingham model. The objective of the present study was to evaluate whether the FSRS could be im-proved upon by developing a new stroke model that combines the original Framingham algorithm with seven additional literature-derived risk factors; this new model was created using a novel modeling process, called synthesis analysis [31, 32]. We used * Correspondence:[email protected]
1
Changchun University of Chinese Medicine Affiliated Hospital, Changchun, Jilin, China
2Department of Biostatistics, School of Public Health, University of Washington, Seattle, WA 98195, USA
Full list of author information is available at the end of the article
the third National Health and Nutrition Examination Survey (NHANES III) to develop our new model. Both the new model and the FSRS model were then evaluated objectively and scientifically using statistical measures commonly used to assess the performance of prediction models— discrimination, calibration, and reclassification—in the longitudinal Atherosclerosis Risk in Communities (ARIC) dataset.
Methods
Stroke prediction models
In modern medicine, prediction models have become valuable and important tools for risk education, disease prevention, and treatment-strategy selection. Often con-sidered the gold standard for risk prediction estimates, data from the Framingham cohort have been used to develop risk functions to evaluate several clinical out-comes, including coronary heart disease, atrial fibrilla-tion, congestive heart failure, diabetes, and hypertension, among others [33–37].
In the original publication, stroke risk appraisal functions were developed among Framingham sub-jects who were 55 to 84 years of age, free of stroke at baseline, and followed for 10 years [15]. Risk factors included in the 1991 stroke profile functions included: age, sex, systolic blood pressure, use of anti-hypertensive medication, presence of diabetes melli-tus, current cigarette smoker stamelli-tus, and the presence of pre-existing cardiovascular disease (coronary heart disease, cardiac failure, or intermittent claudication), atrial fibrillation, and/or left ventricular hypertrophy by electrocardiogram.
After publication, review of the cohort data indicated that the additive effect for antihypertensive therapy was applicable only when systolic blood pressure ranged from 110 to 200 mmHg, rather than across all levels of systolic blood pressure as originally reported. The algo-rithms were revised accordingly, and the modified risk appraisal function is the current Framingham Stroke Risk Score [16]. The detailed procedure of using Framingham Stroke Risk Score for predicting a future patient is given in Appendix 1.
Despite its widespread recognition, several gener-ally accepted risk factors were not included in the original Framingham Stroke Risk Score (FSRS). To overcome this limitation, a novel model-building method, called synthesis analysis, was proposed to incorporate new risk factors into the existing FSRS model. Synthesis analysis is a statistical method used to develop new, comprehensive risk assessment models by combining literature-derived risk factors with an existing prediction model. The primary ad-vantage of synthesis analysis is that it allows for the updating of an existing risk prediction model with
new risk factors without needing to collect compre-hensive information on all original and new risk fac-tors and then following the cohort participants for outcomes of interest, which may take a long time. Detailed descriptions of synthesis analysis and its statistical validation have been reported elsewhere [31, 32, 38–40].
Adding to the baseline, multivariate FSRS equation, the new stroke model incorporates several literature-derived risk factors, including African American ethnicity, physical exercise level (low, moderate, or high based on frequency and intensity of activity), body mass index (kg/m2), waist circumference, height, HDL cholesterol, and use of hormone replacement therapy in postmenopausal females only. We will give a detailed procedure of constructing NEW-STROKE model using synthesis analysis method in Appendix 2.
Measures of performance of a risk prediction model for survival time
Discrimination measures the ability of the model to distin-guish subjects who will likely develop an event from those who will likely not. For a prediction model evaluating time to event (survival time), discrimination is typically mea-sured by the concordance probability (denoted as C), which is defined as the probability of concordant pairs, where a pair of subjects is called concordant if the individual with the shorter survival time had the higher predicted risk.
Several approaches for calculating the concordance probability, also called C-statistics, have been proposed by Harrell [41, 42]. However, appropriate ordering of survival time in the presence of censoring is the key question when calculating C-statistics based on a rank-correlation measure by the Harrell method. Subse-quently, a modified C-statistic was proposed by Uno [43], which consistently estimated a conventional con-cordance measure that is free of censoring. In this study, we utilized the modified C-statistics to evaluate the dis-crimination of the models.
Although discrimination measures the ability of a prediction model to distinguish a subject who will likely develop an event from a subject who will likely not develop an event, it does not measure the ability of a model to predict the probability of an event. Calibration describes how closely the predicted probabilities agree numerically with the actual outcomes [44]. If the new model is lack of fit in the ARIC data set, we need to recalibrate the model so that the overall predicted incidence equal to the overall observed incidence. The more detailed discussion on recalibration process is given in Appendix 3.
low-risk groups. The net reclassification index (NRI) has been proposed to accomplish this task [45]. The NRI measures the change in clinically meaningful categories between two predictive models. In our study, the outputs of FSRS model and new model we developed are the estimated probability of having a stroke for each patient. There are two different definitions about NRI. One is called class NRI if we classify the estimated probability of having stroke into several levels, for example, three levels, like high-, intermediate- and low-risk groups. The other is classless NRI when we treat the estimated prob-ability of having a stroke as continuous.
Data set
The longitudinal Atherosclerosis Risk in Communities (ARIC) dataset was used for model evaluation and comparison. ARIC is a prospective epidemiologic study conducted in four US communities, and stroke incidence was recorded during the follow-up interval. Details of the ARIC study design have been previously described [46]. Briefly, stroke events were identified in a cohort of 15,792 individuals aged 45 to 64 years who were recruited from 1987 to 1989 among 4 com-munities in the United States: Washington County, Maryland; the northwest suburbs of Minneapolis, Minnesota; Forsyth County, North Carolina; and Jackson, Mississippi. Only African Americans were enrolled at the Jackson site; recruits from other sites were representative of their respective community. ARIC participants were reexamined every three years through 1998, and again in 2009. Health status follow-up occurs annually or semi-annually via telephone.
The ARIC study dataset, as used in the current re-search, contained 15,620 individuals, aged 45 to 64 years at baseline. To allow for appropriate com-parisons between the models (FSRS and NEW-STROKE), all ARIC individuals with stroke at base-line (n= 172) were excluded from analysis. In the 10 years after baseline evaluation, 759 incident stroke cases, defined as clinically diagnosed stroke, receipt of stroke-related clinical procedures, or a fatal stroke event, were reported. Details of the iden-tification and classification of stroke events in ARIC are described in greater detail elsewhere [47]. In addition, the visit 1 ARIC data did not contain the left ventricular hypertrophy by electrocardiogram FSRS input; therefore, all participants were assigned left ventricular hypertrophy = no.
Results
As is shown in Table 1, the new model (NEW-STROKE) demonstrated a higher modified C-statistics than the
Framingham model (FSRS) in the overall group and the female subgroup. However, for the male subgroup, the values of modified C-statistics between NEW-STROKE and FSRS are almost identical.
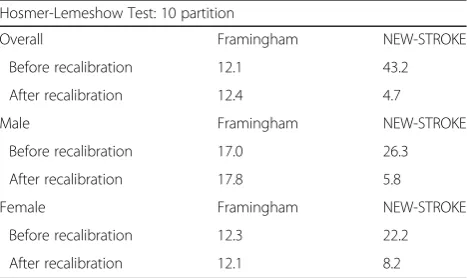
Hosmer-Lemeshow chi-square statistics are used to assess the calibration of a model by measuring the fitness between observed outcomes and predicted probabilities. Hosmer-Lemeshow chi-square test re-sults are illustrated in Table 2. After recalibration, the test for NEW-STROKE is indicative of no lack of fit, since the test value is significantly smaller than the Hosmer-Lemeshow chi-square accepted threshold of 20.
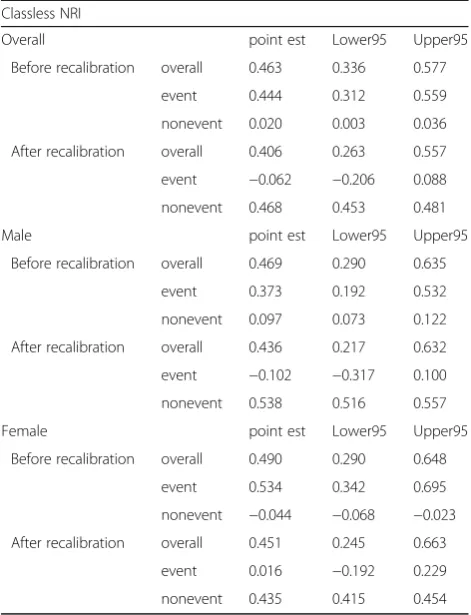
Results for classless NRI are shown in Table 3. For the overall group, both before and after recalibration, the classless NRI values of the NEW-STROKE over Framingham are statistically significant. Following re-calibration, the classless NRI are significantly positive in the non-event subgroup, while not significant in event subgroup. Before recalibration, all classless NRI values are significantly positive except for the female, non-event subgroup in which the classless NRI value is significantly negative.
For the class NRI, test data were categorized into three risk groups based on the quantiles of predicted risk for Table 1Uno’s C-statistic
Uno’s C-statistic
Overall c.index se Lower95 Upper95
Framingham 0.762 0.207 0.739 0.779
NEW-STROKE 0.783 0.206 0.763 0.803
Male c.index se Lower95 Upper95
Framingham 0.765 0.303 0.732 0.797
NEW-STROKE 0.765 0.287 0.733 0.790
Female c.index se Lower95 Upper95
Framingham 0.769 0.317 0.737 0.800
NEW-STROKE 0.793 0.307 0.758 0.818
Table 2Hosmer-Lemeshow test
Hosmer-Lemeshow Test: 10 partition
Overall Framingham NEW-STROKE
Before recalibration 12.1 43.2
After recalibration 12.4 4.7
Male Framingham NEW-STROKE
Before recalibration 17.0 26.3
After recalibration 17.8 5.8
Female Framingham NEW-STROKE
Before recalibration 12.3 22.2
each model. Two types of thresholds were used: (1) the risk thresholds of lower than 70% quantile, 70 ~ 90% quantiles, and higher than 90% quantile; and (2) the risk thresholds of lower than 95% quantile, 95 ~ 99% quan-tiles, and higher than 99% quantile. The second thresh-old type was chosen because the estimated event probability is approximately 1% in the overall group and in both gender subgroups. The results are shown in Table 4. Evaluating the first threshold group, only the class NRI values in the overall and male non-event subgroups are significantly positive. For the second threshold type, all class NRI values are not statistically significant from 0.
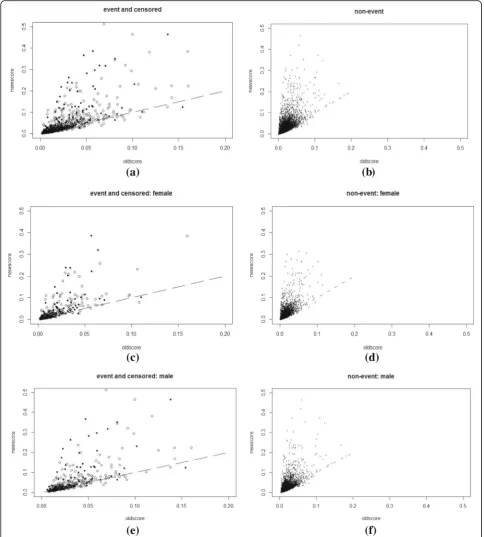
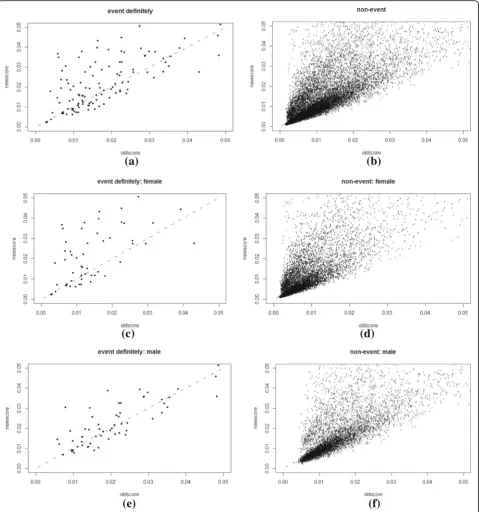
Plots and charts were used to supplement the nu-meric comparisons between the NEW-STROKE and FSRS models and to provide additional information related to the detailed changes. A scatterplot of pnew versus pold is a natural complement to the summary statistics already reported, with different symbols or separate plots for cases (events) and controls (non-events). A line at pnew=pold, in addition to horizontal and vertical lines at key risk thresholds, allows for the illustration of the extent and direction of change in risk induced by the NEW-STROKE model over the existing FSRS. A summary index, such as classless NRI or its components, classless event NRI, and
classless non-event NRI, cannot distinguish between a few large upward movements, a medium number of small upward movements, or a large number of movements in both upward and downward directions. However, such important distinctions may be evident from a scatterplot.
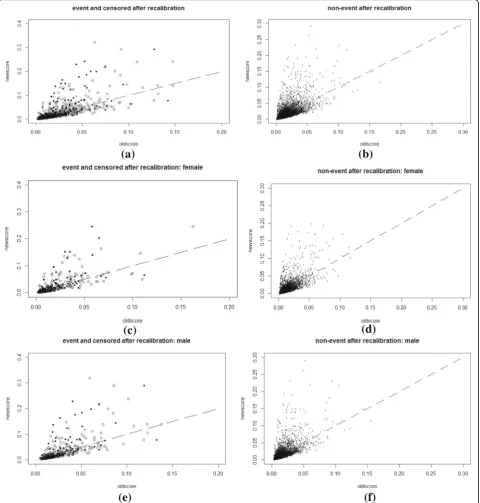
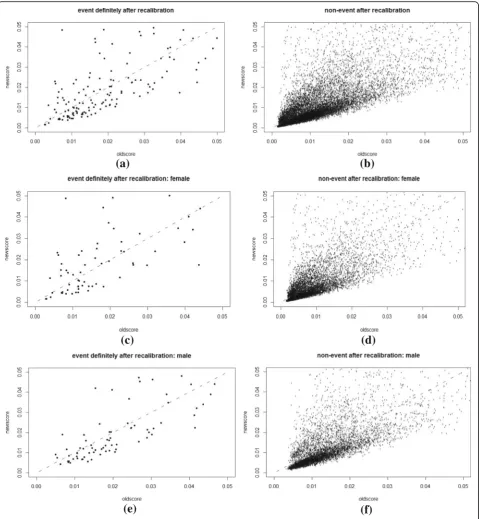
Scatterplots of pnew versuspold, with separate plots for cases (events) and controls (non-events) are shown in Figs. 1, 2, 3 and 4. They were plotted before and after re-calibration, among the overall group, and also stratified by gender. Figures 3 and 4 are the enlarged main parts of Figs. 1 and 2, respectively.
Discussion
In this study, a newly developed risk assessment model for stroke onset was shown by several statis-tical indicators to be superior to the gold-standard Framingham Stroke Risk Score. This new stroke risk score model(NEW-STROKE) was developed using a Table 3Classless NRI
Classless NRI
Overall point est Lower95 Upper95
Before recalibration overall 0.463 0.336 0.577
event 0.444 0.312 0.559
nonevent 0.020 0.003 0.036
After recalibration overall 0.406 0.263 0.557
event −0.062 −0.206 0.088
nonevent 0.468 0.453 0.481
Male point est Lower95 Upper95
Before recalibration overall 0.469 0.290 0.635
event 0.373 0.192 0.532
nonevent 0.097 0.073 0.122
After recalibration overall 0.436 0.217 0.632
event −0.102 −0.317 0.100
nonevent 0.538 0.516 0.557
Female point est Lower95 Upper95
Before recalibration overall 0.490 0.290 0.648
event 0.534 0.342 0.695
nonevent −0.044 −0.068 −0.023
After recalibration overall 0.451 0.245 0.663
event 0.016 −0.192 0.229
nonevent 0.435 0.415 0.454
Table 4Class NRI
Class NRI
0 ~ 0.7, 0.7 ~ 0.9, 0.9 ~ 1
Overall point est lower95 Upper95
NRI 0.028 −0.056 0.115
Event NRI 0.016 −0.069 0.103
Nonevent NRI 0.012 0.004 0.020
Male point est lower95 Upper95
NRI −0.027 −0.133 0.099
Event NRI −0.040 −0.145 0.083
Nonevent NRI 0.013 0.002 0.025
Female point est lower95 Upper95
NRI 0.022 −0.117 0.152
Event NRI 0.011 −0.131 0.141
Nonevent NRI 0.011 −0.001 0.021
0 ~ 0.95, 0.95 ~ 0.99, 0.99 ~ 1
Overall point est lower95 Upper95
NRI 0.053 −0.030 0.129
Event NRI 0.050 −0.032 0.126
Nonevent NRI 0.003 −0.001 0.006
Male point est lower95 Upper95
NRI 0.030 −0.087 0.148
Event NRI 0.027 −0.089 0.145
Nonevent NRI 0.003 −0.002 0.009
Female point est lower95 Upper95
NRI 0.056 −0.066 0.158
Event NRI 0.053 −0.065 0.156
novel, model-building technology, called synthesis analysis, that allowed for the incorporation of seven additional literature-derived risk factors into the original FSRS.
Compared with the discrimination of these two models, the NEW-STROKE model had higher modi-fied C-statistics than the original FSRS model in the overall group and in the female subgroup in the
(a)
(b)
(c)
(d)
(e)
(f)
Fig. 1The scatterplot ofpnewversuspoldbeforerecalibration: separate plots for cases (definitely events and censored ones) and controls
presence of censoring for survival time. This obser-vation illustrates that the NEW-STROKE model has higher precision in both the overall group and the female subgroup in predicting stroke risk score. When evaluating calibration, the NEW-STROKE model outperformed the original FSRS model as
evidenced by smaller Hosmer-Lemeshow chi-square values (<20) after recalibration in the overall group and in both gender subgroups. For reclassification, the NRIs represent the true- and false-positive rates, measuring the change between the NEW-STROKE model and the original FSRS model in predicting
(a)
(c)
(d)
(f)
(e)
(b)
Fig. 2The scatterplot ofpnewversuspoldafterrecalibration: separate plots for cases (definitely events and censored ones) and controls (definitely
stroke risk score. The class NRI and the classless NRI of the NEW-STROKE model over the original FSRS model in the overall group were all signifi-cantly positive. This finding indicates that the NEW-STROKE model is better than the original FSRS model in correctly classifying individuals into higher-and lower-risk groups. Importantly, in the
NEW-STROKE model, all seven literature-derived risk fac-tors contributed significantly to stroke risk predic-tion, thereby effectively improving the original, baseline FSRS model.
This procedure of evaluating the NEW-STROKE model using statistical measures to assess prediction accuracy is similar to that used to evaluate a
NEW-(a)
(c)
(d)
(f)
(e)
(b)
Fig. 3The scatterplot ofpnewversuspoldbeforerecalibration: separate plots for cases (definitely stroke events) and controls (definitely non-events)
CHD model for coronary heart disease, the latter of which was shown to improve upon the gold-standard Framingham CHD Risk Score [38]. Numerous clinical publications report the development of new CHD risk prediction equations that are purportedly better than the original Framingham CHD score. Tzoulaki
[48] disputed these claims of improvement citing notable methodological deficiencies in the majority of these publications, including incorrect validation study design (i.e., using the same data to develop and validate the model, improper selection of the study population, and/or incorrect definition of the
(a)
(b)
(d)
(c)
(e)
(f)
Fig. 4The scatterplot ofpnewversuspoldafterrecalibration: separate plots for cases (definitely stroke events) and controls (definitely non-events)
outcome of interest), incomplete use of statistical evaluation criteria in model comparisons, and publi-cation bias, among others. These deficiencies repre-sent a prevalent issue in this type of research, and necessary steps should be taken to avoid them in similar, future studies. In the current research, we have successfully demonstrated that the NEW-STROKE model outperforms the original FSRS and have avoided Tzoulaki’s noted pitfalls [48], as follows.
First, to address the deficiency of incorrect validation study design, the NEW-STROKE model was developed using the peer-reviewed, clinical literature and the syn-thesis analysis method. It was not empirically derived within the ARIC data. It is notable that this validation study of the NEW-STROKE model, which does not have restrictions on the eligible population, evaluated only those ARIC participants without stroke at baseline; this exclusion allows for appropriate comparisons to the FSRS.
Second, in this research, the performance of the NEW-STROKE model was evaluated using three predic-tion accuracy properties–discriminapredic-tion, calibrapredic-tion, and reclassification. These statistical indexes were calculated by appropriate approaches that were satisfied within the ARIC data. Furthermore, a modified C-statistic was used, as proposed by Uno [43], which specializes in counting for censored survival data. These calculated ac-curacy properties were evaluated comprehensively to avoid another of Tzoulaki’s deficiencies in assessing a new prediction model.
To address the publication bias deficiency, the pri-mary objective of this research was to evaluate whether a stroke risk assessment model, which im-proved upon a baseline Framingham Stroke Risk Score equation, could be developed using synthesis analysis. Inevitably, conflicting interests and publica-tion bias play a small part in all validapublica-tion studies; however, not every model developer will bias its val-idation. The main goal of this research was to dem-onstrate improvement of the original FSRS model, resulting in a more accurate risk prediction model for stroke. The current results illustrate that the NEW-STROKE model did indeed outperform the original FSRS model in predicting the risk score of stroke.
Conclusion
In this paper, a new stroke risk score prediction model (NEW-STROKE) was developed using synthesis analysis, which allowed for the integration of seven, literature-derived risk factors into the original FSRS model. The NEW-STROKE model was then validated in the ARIC dataset. Three statistical measures were
used to evaluate the performance of the NEW-STROKE model over the original FSRS model-discrimination, calibration, and reclassification. Validation results indicated that the original FSRS model was indeed im-proved upon by the NEW-STROKE model in predicting the risk of stroke. These findings provide another suc-cessful instance of utilizing synthesis analysis to im-prove upon a baseline, multivariate risk assessment mode.
Appendix 1
FSRS model for predicting a future patient
Stroke risk factors in the original FSRS model in-cluded 9 variables such as age, sex, systolic blood pres-sure, use of antihypertensive medication, presence of diabetes mellitus, current cigarette smoker status, the presence of pre-existing cardiovascular disease, atrial fibrillation, and left ventricular hypertrophy, denoted byX1,X2,X3,X4,X5,X6,X7,X8,X9respectively. Logistic
regression and Cox proportional hazards regression model had been employed in developing this FSRS model. Separate models were developed for each sex. From the published literatures [15], we got the pre-dicted probability that this individual will develop a stroke withintyears isp= 1−(S(t))B,whereS(t) denoted the estimated probability of surviving without a stroke for individuals whose risk factors are equal to the mean values of those observed in the data, t indicated the number of years. B=eA, A had different formulas for each sex.
For sex = female,
A¼b1X1þb3X3þ⋯þb9X9− b1X1þb3X3þ⋯þb9X9
with Xi;i¼1;3;…;9 indicating the value of the mean for theith covariate in one population.
For sex = male,
A¼c1X1þc3X3þ…þc9X9− c1X1þc3X3þ⋯þc9X9
As an example, consider a x1 -year old woman with
a systolic blood pressure of x3 mm Hg who does not
take antihypertensive medication (x4= 0), is free of
diabetes (x5= 0),smokes (x6= 1),does not have a
previ-ous cerebrovascular disease (x7= 0),does not have a
history of atrial fibrillation (x8= 0), and does not left
ventricular hypertrophy (x9= 0). The predicted
p¼1−ðSð Þ10 ÞB
¼1−ðSð Þ10Þexp b1x1þb3x3þþbb9400þ−ðbb51X01þþbb63X13þþb⋯7þ0bþ9bX89Þ0 ¼1−ðSð Þ10 Þexp bð1x1þb3x3þb6−ðb1X1þb3X3þ⋯þb9X9ÞÞ
The more detailed about the original Framingham Stroke Risk score model please see the Framingham study reference [15].
Appendix 2
Synthesis analysis and NEW-STROKE model
Synthesis analysis is a statistical method used to de-velop a multivariate regression model integrating the incomplete regression models and correlations among the independent variables of interest. In our study, we used Synthesis analysis method to propose the NEW-STROKE model, which included seven more risk fac-tors than the FSRS model in predicting a future patient. Specificity, FSRS model is one of the most well-regards stroke risk appraisal tools, and can be regarded as a baseline equation in developing the NEW-STROKE model. Additional seven risk factors contained African American ethnicity, physical exer-cise level, body mass index, waist circumference, height, HDL cholesterol and the use of hormone re-placement therapy derived from different longitudinal studies and comprehensive meta-analysis of the med-ical literatures. Let Z1,Z2,⋯,Z7 denote these seven
covariates respectively.
There are some assumptions in developing the NEW-STROKE model for predicting the stroke risk score by synthesis analysis method. The key assump-tion is that the input informaassump-tion, namely the associa-tions of each risk factor with the stroke score and correlations among the multiple risk factors, are rep-resentative in the population. Another one is that these seven risk factors we chose in adding to our new model must be available in the training set which used to construct the model. In our study, the third National Health and Nutrition Examination Survey (NHANES III) has been used to propose the NEW-STROKE model for predicting stroke risk score. Be-cause the NHANES III data is a representative sample of the US population and can be regarded as the only “superpopulation”. And these variables are all avail-able both in NHANES III and ARIC data. The third one is the correlations between these risk factors and outcome of Stroke are exchangeable across different studies. The detailed procedure of constructing NEW-STROKE is as follows.
The dependent variable is the logit of the probability of stroke outcome, denoted by Y. Framingham Stroke Risk Score model can be regarded as the gold standard
for stroke risk prediction, and be considered as a base-line equation in developing new model. The following steps can illustrate the detailed synthesis analysis methodology.
Assume the baseline empirical logistic model is:
LY¼αþβ1X1þβ2X2þ⋯þβ9X9
withLYdenoting the logit ofY.
The parameters α,β1,β2,⋯,β9 had been estimated in
Framingham Heart Study. We useα^þβ1X1þβ2X2þ⋯ þβ9X9to predictLYfor each patient who was followed up
in the NHANES III. Denote the prediction by LY. The correlations between the additional seven risk factors (Z1,
Z2,⋯,Z7) and stroke outcome represent byγ1,γ2,⋯,γ7,
which derived from the medical literatures.
Firstly, we use^αþβ1X1þβ2X2þ⋯þβ9X9 to
calcu-late the predicted dependent variableLY for each patient in the NHANES III.
Secondly, for the same dataset, LY can be used as dependent variable, the first additional risk factorZ1is the
independent variable, build the linear regression model LY ¼δ1þς1Z1. We use a weighted least square method
to obtain the regression coefficient ς1. ς1 represents the
association of α^þβ1X1þβ2X2þ⋯þβ9X9 with Z1,
also means that how much of Z1 is captured in the
baseline equation. γ1denotes the correlation between
the first risk factor Z1 and stroke outcome.
Thirdly, we use the difference between γ1 and ς1 to
reflect the association of the first risk factor Z1with the
stroke that was not captured in the baseline equation. The new equation has the form:
LY1¼LYþðγ1−ς1ÞZ1¼α^þβ1X1þβ2X2þ⋯
þβ9X9þðγ1−ς1Þ Z1−Z1
here, Z1 indicate the mean ofZ1. Constant α^ keeps the
same when Z1 is mean centered. Then, this new
equa-tion has been regarded as a new baseline equaequa-tion. We continue to add the second interested risk factor to this new baseline equation. We repeat the first step to third step until all interested risk factors are included in the final model.
The final equation is:
LY7¼^αþβ1X1þβ2X2þ⋯þβ9X9þðγ1−ς1Þ Z1−Z1
þðγ2−ς2Þ Z2−Z2
þ⋯þ γ7−ς7
Z7−Z7
LY7 is our proposed NEW-STROKE model by synthe-sis analysynthe-sis method. The detailed steps are our proced-ure of synthesis analysis.
Abbreviations
ARIC:Atherosclerosis risk in communities; FSRS: Framingham stroke risk score; NEW-STROKE: New stroke risk score model
Acknowledgements
The Atherosclerosis Risk in Communities Study is carried out as a collaborative study supported by National Heart, Lung, and Blood Institute contracts (HHSN268201100005C, HHSN268201100006C, HHSN268201100007C, HHSN268201100008C, HHSN268201100009C, HHSN268201100010C, HHSN268201100011C, and HHSN268201100012C). The authors thank the staff and participants of the ARIC study for their important contribution participants of the ARIC study for their important contribution. This manuscript was not prepared in collaboration with investigators of the ARIC Study and does not necessarily reflect the opinions or conclusions of the ARIC Study or the NHLBI.”Xiaonan Wang and Jiayin Zheng gratefully acknowledge China Scholarship Council (CSC) for providing financial support when they visited University of Washington.
Availability of data and materials
Interested investigators can obtain the data by contacting the ARIC Coordinating Center at the University of North Carolina-Chapel Hill. Details about the procedures for data request can be found in the following website: http://www2.cscc.unc.edu/aric/distribution-agreements; It is also possible to obtain the ARIC data from BioLINCC, a repository maintained by the National Heart, Lung, and Blood Institute. (https://biolincc.nhlbi.nih.gov/).
Authors’contributions
XZ, AD, and GH conceived and designed the study. GH and AD were responsible for the acquisition of data, JZ,XW and XZ analyzed the data. XZ, XW, and JZ interpreted the results. XZ, XW, JZ and AD wrote the manuscript. XZ and XW revised the manuscript. All authors read and approved the final manuscript.
Competing interests
The authors declare that they have no competing interests.
Let the observed overall incidence P(Y = 1|X) =ρ. If the predicted probability P Yð ¼1jXÞ does not equal to the observed overall incidenceρ. We need to adjust this NEW-STROKE model, such as adjust the constant term α^. For example,
so thatP^ðY¼1jXÞ ¼P Yð ¼1jXÞ ¼ρ.
After calculating, we are able to give the formula of C:
logit P Yð ¼1jXÞ
1−P Yð ¼1jXÞ¼^αþβ1X1þβ2X2þ⋯þβ9X9
þðγ1−ς1Þ Z1−Z1
þðγ2−ς2Þ Z2−Z2
þ⋯þ γ7−ς7
Z7−Z7
^
P Yð ¼1jXÞ ¼ exp α^þβ1X1þ⋯þβ9X9þðγ1−ς1Þ Z1−Z1
þ⋯þ γ7−ς7
Z7−Z7
1þexp ^αþβ1X1þ⋯þβ9X9þðγ1−ς1Þ Z1−Z1
þ⋯þ γ7−ς7
Z7−Z7
^
P Yð ¼1jXÞ ¼ exp α^þβ1X1þ⋯þβ9X9þðγ1−ς1Þ Z1−Z1
þ⋯þ γ7−ς7
Z7−Z7
þC
1þexp ^αþβ1X1þ⋯þβ9X9þðγ1−ς1Þ Z1−Z1
þ⋯þ γ7−ς7
Z7−Z7
þC
C¼log ρ
1−ρ
− α^þβ1X1þβ2X2þ⋯þβ9X9
þðγ1−ς1Þ Z1−Z1
þðγ2−ς2Þ Z2−Z2
þ⋯þ γ7−ς7 Z7−Z7 Appendix 3
Recalibration approach
The disease outcomeY= 1 if patient who had a stroke, otherwise,Y= 0.
The NEW-STROKE prediction model has the following form:
Consent for publication Not applicable.
Ethics approval and consent to participate
The ARIC study was approved by the institutional review boards at all field centers of ARIC study, and informed consent was obtained from all participants.
Our paper mainly focuses on developing the new statistical model and compares the performance of the proposed statistical model with the old model. Therefore, the ethics approval was not required in our specific study. In addition, the ARIC data we applied in National Heart, Lung, and Blood Institute (NHLBI) is a publicly available data set. The individuals in ARIC data all understood the ethics approval and signed informed consent. The detailed information could be found in this website: https://www2.cscc.unc.edu/aric/.
Publisher’s Note
Springer Nature remains neutral with regard to jurisdictional claims in published maps and institutional affiliations.
Author details 1
Changchun University of Chinese Medicine Affiliated Hospital, Changchun, Jilin, China.2Department of Biostatistics, School of Public Health, University of Washington, Seattle, WA 98195, USA.3School of Statistics, Renmin University of China, Beijing 100872, China.4BioSignia, Inc, Durham, NC, USA. 5
Department of Biostatistics and Bioinformatics, Duke University, Durham, USA.6School of Mathematical Sciences, Peking University, Beijing, China.
Received: 30 August 2016 Accepted: 27 March 2017
References
1. Lopez AD, Mathers CD, Ezzati M, Jamison DT, Murray CJ. Global and regional burden of disease and risk factors, 2001: systematic analysis of population health data. Lancet (London, England). 2006;367:1747–57. 2. Kochanek KD, Murphy SL, Xu J, Arias E. Mortality in the United States, 2013.
NCHS Data Brief. 2014;178:1–8.
3. Mozaffarian D, Benjamin EJ, Go AS, et al. Heart disease and stroke statistics– 2015 update: a report from the American Heart Association. Circulation. 2015;131:229–322.
4. Naghavi M, Wang H, Lozano R, et al. Global, regional, and national age-sex specific all-cause and cause-specific mortality for 240 causes of death, 1990–2013: a systematic analysis for the Global Burden of Disease Study 2013. Lancet (London, England). 2015;385:117–71. 5. Wolf PA. Risk factors for stroke. Stroke. 1985;16:359–60.
6. Howard G, Anderson R, Sorlie P, Andrews V, Backlund E, Burke GL. Ethnic differences in stroke mortality between non-Hispanic whites, Hispanic whites, and blacks. The National Longitudinal Mortality Study. Stroke. 1994; 25:2120–5.
7. Manolio TA, Kronmal RA, Burke GL, O’Leary DH, Price TR. Short-term predictors of incident stroke in older adults. The Cardiovascular Health Study. Stroke. 1996;27:1479–86.
8. Whisnant JP. Modeling of risk factors for ischemic stroke.The Willis Lecture. Stroke. 1997;28:1840–4.
9. Berger K, Schulte H, Stogbauer F, Assmann G. Incidence and risk factors for stroke in an occupational cohort: the PROCAM Study. Prospective Cardiovascular Muenster Study. Stroke. 1998;29:1562–6.
10. Morgenstern LB, Smith MA, Lisabeth LD, et al. Excess stroke in Mexican Americans compared with non-Hispanic Whites: the Brain Attack Surveillance in Corpus Christi Project. Am J Epidemiol. 2004;160:376–83. 11. Harmsen P, Lappas G, Rosengren A, Wilhelmsen L. Long-term risk factors
for stroke: twenty-eight years of follow-up of 7457 middle-aged men in Goteborg, Sweden. Stroke. 2006;37:1663–7.
12. O’Donnell MJ, Xavier D, Liu L, et al. Risk factors for ischaemic and intracerebral haemorrhagic stroke in 22 countries (the INTERSTROKE study): a case–control study. Lancet (London, England). 2010;376:112–23. 13. Howard VJ. Reasons underlying racial differences in stroke incidence and
mortality. Stroke. 2013;44:S126–8.
14. Anderson KM, Odell PM, Wilson PWF, Kannel WB. Cardiovascular disease risk profiles. Am Heart J. 1990;121:293–8.
15. Wolf PA, D’Agostino RB, Belanger AJ, Kannel WB. Probability of stroke: A risk profile from the Framingham study. Stroke. 1991;22:312–8.
16. D’Agostino RB, Wolf PA, Belanger AJ, Kannel WB. Stroke risk profile: adjustment for antihypertensive medication. Stroke. 1994;25:40–3. 17. Hippisley-Cox J, Coupland C, Vinogradova Y, Robson J, May M, Brindle P.
Derivation and validation of QRISK, a new cardiovascular disease risk score for the United Kingdom: prospective open cohort study. BMJ. 2007;335:136. 18. Ridker PM, Buring JE, Rifai N, Cook NR. Development and validation of
improved algorithms for the assessment of global cardiovascular risk in women: the Reynolds Risk Score. JAMA. 2007;297:611–9.
19. Jee SH, Park JW, Lee SY, et al. Stroke risk prediction model: a risk profile from the Korean study. Atherosclerosis. 2008;197:318–25.
20. Hippisley-Cox J, Coupland C, Brindle P. Derivation and validation of QStroke score for predicting risk of ischaemic stroke in primary care and comparison with other risk scores: a prospective open cohort study. BMJ. 2013;346:f2573. 21. Wilson PWF, D’Agostino RB, Levy D, Belanger AM, Silbershatz H, Kannel WB.
Prediction of coronary heart disease using risk factor categories. Circulation. 1998;97:1837–47.
22. Kurth T, Gaziano JM, Berger K, et al. Body mass index and the risk of stroke in men. Arch Intern Med. 2002;162:2557–62.
23. Kurth T, Gaziano JM, Rexrode KM, et al. Prospective study of body mass index and risk of stroke in apparently healthy women. Circulation. 2005; 111:1992–8.
24. Lu M, Ye W, Adami HO, Weiderpass E. Prospective study of body size and risk for stroke amongst women below age 60. J Intern Med. 2006; 260:442–50.
25. Hu G, Tuomilehto J, Silventoinen K, Sarti C, Mannisto S, Jousilahti P. Body mass index, waist circumference, and waist-hip ratio on the risk of total and type-specific stroke. Arch Intern Med. 2007;167:1420–7.
26. Park JW, Lee SY, Kim SY, Choe H, Jee SH. BMI and stroke risk in Korean women. Obesity (Silver Spring). 2008;16:396–401.
27. Khaw KT, Barrett-Connor E. Family history of stroke as an independent predictor of ischemic heart disease in men and stroke in women. Am J Epidemiol. 1986;123:59–66.
28. Kiely DK, Wolf PA, Cupples LA, Beiser AS, Myers RH. Familial aggregation of stroke.The Framingham Study. Stroke. 1993;24:1366–71.
29. Flossmann E, Schulz UG, Rothwell PM. Systematic review of methods and results of studies of the genetic epidemiology of ischemic stroke. Stroke. 2004;35:212–27.
30. Touze E, Rothwell PM. Sex differences in heritability of ischemic stroke: a systematic review and meta-analysis. Stroke. 2008;39:16–23. 31. Hu G, Root M. Building prediction models for coronary heart disease by
synthesizing multiple longitudinal research findings. Eur J Cardiovasc Prev Rehabil. 2005;12:459–64.
32. Zhou XH, Hu N, Hu G, Root M. Synthesis analysis of regression models with a continuous outcome. Stat Med. 2009;28:1620–35.
33. Expert Panel on Detection E, and Treatment of High Blood Cholesterol in Adults. Executive Summary of The Third Report of The National Cholesterol Education Program (NCEP) Expert Panel on Detection, Evaluation, And Treatment of High Blood Cholesterol In Adults (Adult Treatment Panel III). JAMA. 2001;285:2486–97.
34. Kannel WB, D’Agostino RB, Silbershatz H, Belanger AJ, Wilson PW, Levy D. Profile for estimating risk of heart failure. Arch Intern Med. 1999;159:1197–204. 35. Parikh NI, Pencina MJ, Wang TJ, et al. A risk score for predicting near-term
incidence of hypertension: the Framingham Heart Study. Ann Intern Med. 2008;148:102–10.
36. Schnabel RB, Sullivan LM, Levy D, et al. Development of a risk score for atrial fibrillation (Framingham Heart Study): a community-based cohort study. Lancet (London, England). 2009;373:739–45.
37. Wilson PW, Meigs JB, Sullivan L, Fox CS, Nathan DM, D’Agostino Sr RB. Prediction of incident diabetes mellitus in middle-aged adults: the Framingham Offspring Study. Arch Intern Med. 2007;167:1068–74. 38. Hu G, Root M, Duncan AW. Adding multiple risk factors improves
Framingham coronary heart disease risk scores. Vasc Health Risk Manag. 2014;10:557–62.
39. Sheng E, Zhou XH, Chen H, Hu G, Duncan A. A new synthesis analysis method for building logistic regression prediction models. Stat Med. 2014; 33:2567–76.
41. Harrell FE, Califf RM, Pryor DB, Lee KL, Rosati RA. Evaluating the yield of medical tests. JAMA. 1982;247:2543–46.
42. Harrell FE, Lee KL, Califf RM, Pryor DB, Lee KL, Rosati RA. Regression modeling strategies for improved prognostic prediction. Stat Med. 1984;3:143–52. 43. Hajime U, Tianxi C, Pencima MJ, D’Agostino RB, Wei LJ. On the C-statistics
for evaluating overall adequacy of risk prediction procedures with censored survival data. Stat Med. 2011;30:1105–17.
44. Harrell Jr FE, Lee KL, Mark DB. Tutorial in biostatistics multivariable prognostic models:issues in developing models, evaluating assumptions and adequacy, and measuring and reducing errors. Stat Med. 1996;15:361–87.
45. Pencina MJ, D’Agostino Sr RB, Steyerberg EW. Extensions of net reclassification improvement calculations to measure usefulness of new biomarkers. Stat Med. 2011;30:11–21.
46. The ARIC investigators. The Atherosclerosis Risk in Communities(ARIC) Study: design and objectives. Am J Epidemiol. 1989;129:687–702.
47. Rosamond WD, Folsom AR, Chambless LE, Wang CH, McGovern PG, Howard G, Copper LS, Shahar E. Stroke incidence and Survival Among Middle-Aged Adults 9-Year Follow-Up of the Atherosclerosis Risk in Communities(ARIC) cohort. Stroke. 1999;30:736–43.
48. Tzoulaki I, Liberopoulos G, Ioannidis JP. Assessment of claims of improved prediction beyond the Framingham risk score. J Am Med Assoc. 2009;302: 2345–52.
• We accept pre-submission inquiries
• Our selector tool helps you to find the most relevant journal • We provide round the clock customer support
• Convenient online submission • Thorough peer review
• Inclusion in PubMed and all major indexing services • Maximum visibility for your research
Submit your manuscript at www.biomedcentral.com/submit