Quantifying spatial heterogeneity of chlorophyll
fluorescence during plant growth and in response
to water stress
Bresson
et al.
Bressonet al. Plant Methods (2015) 11:23
M E T H O D O L O G Y
Open Access
Quantifying spatial heterogeneity of chlorophyll
fluorescence during plant growth and in response
to water stress
Justine Bresson
1,2,3†, François Vasseur
4†, Myriam Dauzat
1, Garance Koch
1, Christine Granier
1and Denis Vile
1*†Abstract
Background:Effects of abiotic and biotic stresses on plant photosynthetic performance lead to fitness and yield decrease. The maximum quantum efficiency of photosystem II (Fv/Fm) is a parameter of chlorophyll fluorescence (ChlF) classically used to track changes in photosynthetic performance. Despite recent technical and methodological advances in ChlF imaging, the spatio-temporal heterogeneity ofFv/Fmstill awaits for standardized and accurate quantification.
Results:We developed a method to quantify the dynamics of spatial heterogeneity of photosynthetic efficiency through the distribution-based analysis ofFv/Fmvalues. The method was applied toArabidopsis thalianagrown under well-watered and severe water deficit (survival rate of 40%). First, whole-plantFv/Fmshifted from unimodal to bimodal distributions during plant development despite a constant meanFv/Fmunder well-watered conditions. The establishment of a bimodal distribution ofFv/Fmreflects the occurrence of two types of leaf regions with contrasted photosynthetic efficiency. The distance between the two modes (called S) quantified the whole-plant photosynthetic heterogeneity. The weighted contribution of the most efficient/healthiest leaf regions to whole-plant performance (calledWmax) quantified the spatial efficiency of a photosynthetically heterogeneous plant. Plant survival to water deficit was associated to high S values, as well as with strong and fast recovery ofWmaxfollowing soil rewatering. Hence, during stress surviving plants had higher, but more efficient photosynthetic heterogeneity compared to perishing plants. Importantly, S allowed the discrimination between surviving and perishing plants four days earlier than the meanFv/Fm. A sensitivity analysis from simulated dynamics ofFv/Fmshowed that parameters indicative of plant tolerance and/or stress intensity caused identifiable changes in S andWmax. Finally, an independent comparison of six Arabidopsis accessions grown under well-watered conditions indicated that S andWmaxare related to the genetic variability of growth.
Conclusions:The distribution-based analysis of ChlF provides an efficient tool for quantifying photosynthetic heterogeneity and performance. S andWmax are good indicators to estimate plant survival under water stress. Our results suggest that the dynamics of photosynthetic heterogeneity are key components of plant growth and tolerance to stress.
Keywords:Arabidopsis thaliana, Chlorophyll fluorescence imaging, Heterogeneity ofFv/Fmvalues, Modelling, Photosynthetic performance, Pixels distribution, Plant growth, Plant survival, Sensitivity analysis
* Correspondence:denis.vile@supagro.inra.fr
†Equal contributors 1
Laboratoire d’Ecophysiologie des Plantes sous Stress Environnementaux (LEPSE), INRA, Montpellier SupAgro, UMR759, F-34060 Montpellier, France Full list of author information is available at the end of the article
Background
High-throughput phenotyping is increasingly used for dis-secting the genetic and eco-physiological determinisms of plant performance and stress tolerance. Over the last decade, efficient automated imaging systems have been developed for the acquisition of visible, bioluminescence, fluorescence and multi-spectral images. A rising difficulty is now to extract valuable, i.e., biologically meaningful, preferably quantitative, information from the large collec-tion of images generated by these systems [1].
Chlorophyll fluorescence (ChlF) imaging has become one of the most powerful and popular tools to track changes in the photosynthetic capacities of plants in response to abiotic and biotic factors [2-4]. Pulse-amplitude modu-lated ChlF techniques provide non-invasive assessment of the photosystem II (PSII) efficiency to supply electrons to the photosynthetic machinery. Light energy absorbed by chlorophyll molecules can undergo one of three com-peting fates: (i) driving photosynthesis (photochemistry); (ii) being dissipated as heat; or (iii) being re-emitted as ChlF. These three processes take place in a competitive manner, and under stress conditions, the photochemistry declines whereas heat dissipation and ChlF emission in-crease (for recent reviews, see [5,6]). ChlF is estimated by the quantification of the light re-emitted (in the red wave-bands) after the application of a saturating flash (usually for a few seconds) to the photosynthetic organs [5]. The saturating flash induces the transport of electrons through PSII centres, driving the reduction of QA, the primary stable electron acceptor of PSII. Once reduced, QAcannot accept new electrons before electrons are transferred to the next acceptor (the reaction centre is considered to be
‘closed’), and the excess of energy is dissipated through heat and fluorescence.
Amongst the different ChlF parameters, theFv/Fmratio is a useful and rapid parameter that reflects the maximum quantum efficiency of the PSII photochemistry [7]. In dark-adapted leaves (in which all PSII reaction centres are in the‘open’state; QAfully oxidized), a measuring beam is applied to elicit the minimal value of ChlF, F0 (i.e., basal fluorescence).F0represents the energy dissipation via light-harvesting antenna pigments when excitation energy is not being transferred to the PSII reaction cen-tres. After reaching F0, the application of a brief satur-ating pulse induces a maximum value of ChlF,Fm(PSII reaction centres get ‘closed’ because of electron accu-mulation; QAfully reduced). The difference betweenF0 andFmis the variable fluorescence,FvandFv/Fmis given by (Fm-F0)/Fm(for more details, see [5]). LowFv/Fm indi-cate substantial photoinhibition or down-regulation of PSII that occurs when plants experience stress. It has been shown that Fv/Fm is a robust indicator of plant health. Healthy photosynthetic tissues of most plant species ex-hibit a mean Fv/Fm at ca. 0.83, while lower values are
indicative of an impaired physiological status [8,9]. Rapid modifications of Fv/Fm are for instance reported in re-sponse to many environmental factors, such as water stress [8,10], temperature [11-13], wounding [14], photo-inhibition [11,15], biotic interactions such as pathogenic as well as beneficial bacteria [16-19].
Soil water availability is one of the most important en-vironmental factors for plant growth and development. The impact of water deficit on the photosynthetic per-formance of plants depends on the severity and duration of the stress. In the short-term, decrease in water supply usually induces stomata closure to maintain a favourable leaf water status, what in turn leads to a reduction of in-ternal CO2 concentration [20]. Hence, stomata closure under water stress promotes an imbalance between the photochemical activity of PSII and the electron require-ment for carbon fixation, leading to over-excitations and subsequent photoinhibitory damages to PSII reaction cen-tres [21]. As a consequence, substantial decline in Fv/Fm in response to moderate water deficit is observed in vari-ous plant species (see references in [2]), and was closely related to decreased relative leaf water content [8]. With increasing stress severity or duration, carbon starvation and hydraulic failure, which strongly alter Fv/Fm at the whole-plant level, lead to partial (or total) senescence or leaf abscission [22]. Even though exacerbated leaf senescence can be lethal, sacrificing a few leaves might be a good strategy to ensure survival under severe re-source limitation [23]. Growth recovery following severe water stress is then associated with the (partial) re-establishment of the photosynthetic capacities of the senescing leaves, and/or with the development of new leaves with optimal photosynthetic performance [24].
Here, we analysed the distribution ofFv/Fmto estimate the spatial heterogeneity of photosynthetic efficiency (S) and the weighted contribution of the most efficient/ healthiest leaf regions to whole-plant photosynthetic per-formance (Wmax). We first showed that the changes in S andWmaxwere related to the survival of the Arabidopsis Col-0 accession to a severe water deficit (SWD). A sensi-tivity analysis of S and Wmax to simulated dynamics of Fv/Fmdistributions showed to what extent S and Wmax can vary depending on plant tolerance and/or stress in-tensity. Finally, we found that a significant part of the variation in biomass accumulation in six contrasted Arabidopsis accessions is explained by the variation of Wmaxin the course of plant development.
Results
Analytical framework: severe water deficit strongly affects plant growth, photosynthetic efficiency and induces plant mortality
Arabidopsis Col-0 plants were grown in the PHENOPSIS automaton [33] (Figure 1A). Plants were subjected to SWD by withholding irrigation from the four-leaves stage (L4; stage 1.04, [34]; Figure 1B) in order to progressively reach a very low soil relative water content (RWCsoil) of 6% g H2O g−1dry soil (corresponding to water potential ca. of−9.52 MPa; see Additional file 1: Figure S1). There-after, irrigation was resumed to progressively reach the well-watered (WW) soil condition (35% g H2O g−1 dry soil; 0.07 Mpa, Additional file 1: Figure S1) maintained until the flowering of surviving plants (Figure 1B). These two soil conditions allowed the investigation of Fv/Fm heterogeneity with highly contrasted physiological status and thus, with a wide range of leaf damages and senes-cence. Plant growth andFv/Fmwere daily measured from early developmental stages (i.e., emergence of the two first leaves, stage 1.02, [34]) to the emergence of the flower-ing stem (i.e., boltflower-ing, stage 5.01, [34]; Figure 1C), with a high-throughput ChlF imaging system (Imaging-PAM M-Series, Maxi-version, Heinz Walz GmbH, Germany) implemented on the automaton (Figures 1A, C). We de-veloped an ImageJ (1.47v, Rasband, Bethesda, Maryland, USA) macro “PHENOPSIS-Fluo” to semi-automatically extract the whole-rosette Fv/Fm mean, the distribution of Fv/Fmvalues across the rosette and the projected total leaf area from ChlF images.
Under SWD, 40% of the plants survived, resumed growth and flowered whereas the remaining plants failed to re-cover, perished and decomposition of tissues started (Figures 1D, E). Whole-rosette mean Fv/Fm followed the variation of RWCsoiland was therefore dramatically affected by the SWD (Figures 1B and 2A). Whole-rosette meanFv/Fmof stressed plants remained stable at 0.812 ± 0.041 (n = 4–30) during the 14 days after water with-holding, similar to plants grown under WW conditions
(0.813 ± 0.019; n = 4–31; Figure 2A). Then, whole-rosette mean Fv/Fm of stressed plants decreased dramatically (Figure 2A). This was mainly due to the decrease ofFv/ Fm in the oldest leaves of the rosette, notably with a gradient from the tip to the base of the leaves (see 3-D rep-resentations in Figure 2B and Additional file 2: Figure S2). Just before rewatering, SWD resulted in a significant 38% and 43% decrease of meanFv/Fm in surviving and perishing plants, respectively (Figure 2A). Upon rewater-ing, mean Fv/Fm continued to decline steadily for three further days. Afterwards, surviving plants progressively re-coveredFv/Fmvalues up to 88% of their initial values after 6 days following rewatering (Figure 2A). This was mainly achieved by shedding of almost all senescing leaves (Figure 2B). In contrast, meanFv/Fmof perishing plants continued to decrease to reach undetectable thresh-old of photosynthetic activity (i.e., plants were completely senescing or decomposing; Figure 2B and Additional file 2: Figure S2). A clear separation of meanFv/Fm be-tween surviving and perishing plants was visible four days after rewatering (Figure 2A).
Computing and quantifying the heterogeneity of plant photosynthetic efficiency during growth and under severe water deficit
During SWD, Fv/Fm values at the plant surface became heterogeneous, as illustrated by the changes in the mean and distribution of Fv/Fm values (Figures 2A, B). We notably observed the establishment of multimodal distri-butions during SWD, reflecting the spatial variability of Fv/Fm in the rosette (Figure 2B). To explore the hetero-geneity of Fv/Fm values during time course, we applied the Hartigan’s non-parametric significance test for unim-odality [35-37]. As expected, the proportion of stressed plants showing multimodal distributions increased strongly after stress exposure (Figure 2C). Under WW conditions, the proportion of plants that displayed significant multi-modal distributions also increased from < 10% to > 90% be-tween 1 to 10 days after L4 stage. Stressed plants even displayed a slightly lower proportion of multimodal distri-butions compared to plants grown under WW conditions (Figure 2C).
After distinguishing the plants that exhibited significant multimodal distributions, we used the REBMIX algorithm for finite mixture models [38] to characterize each modei of the mixture of distributions ofFv/Fmvalues (i.e., mean
second mode (minimum μmin, σmin and ρmin; with the lowest Fv/Fm values) represented the least efficient or senescing parts of the rosette (Figure 3A). In case of unimodal distribution, the mode was considered as the single maximum mode.
For plants grown under WW conditions, each param-eter was roughly constant during plant development (Figures 3B-G). In stressed plants, whileμmaxessentially followed the same variation of whole-rosette meanFv/Fm (Figures 2A and 3C), μmin decreased to reach very low
values (μmin= 0.24 ± 0.13 and 0.37 ± 0.17 for perishing and surviving plants, respectively; Figure 3B). Standard devi-ation σmaxprogressively increased during SWD establish-ment. However, whileσmax of surviving plants recovered values similar to WW plants after rewatering,σmax contin-ued to increase in perishing plants (Figure 3E). By con-trast, standard deviationσminincreased more in surviving than in perishing plants, but recovered their initial value 13 days after rewatering (Figure 3D). In addition, the weight, i.e. the proportion, of the minimum mode ρmin Figure 1High-throughput analysis of Arabidopsis growth and chlorophyll fluorescence in the PHENOPSIS automaton. (A)A. thaliana
plants are grown in controlled environmental conditions in the PHENOPSIS platform equipped with a chlorophyll fluorescence imaging system.
(B)Dynamics of soil relative water content in two watering scenarios including constant well-watered conditions (WW) and water withdrawing from the four-leaves stage (L4; beginning of stress) followed by rewatering after 1 day at 6% g H2O−1dry soil (SWD). Data are means (± SE) of 13
and 48 plants under WW and SWD, respectively.(C)Plant growth (top) and whole-rosetteFv/Fm(bottom) during plant development and under
SWD.Fv/Fmvalues are represented by false colour scale ranging from black (pixel values 0) through red, yellow, green, blue to purple (ending at 1).(D)
Visible images of surviving and perishing plants (left) and survival percentage of plants under WW and SWD conditions (right). Asterisks indicate significant differences following Chi2test between plants grown in WW conditions(n= 13) and plants under SWD (n= 19 and 29 for surviving
increased to a greater extent in perishing plants (and the weight of the maximum mode ρmax decreased likewise) compared to surviving plants (Figures 3F, G).
A quantification of the disparity between the two modes of a bimodal distribution, i.e. the heterogeneity of the values, is given by the ‘bimodal separation’ S = (μmax
-μmin) / 2(σmax+σmin) [39]. S is roughly the distance be-tween the two peaks, and S > 1 when the two modes do not overlap. Here, the Fv/Fm heterogeneity across the plant increased regardless of soil water conditions during time course (Figure 4). However, S increased more in plants that survived the SWD than in others plants, whereas perishing plants had the same heterogeneity than those grown in WW conditions. A clear difference between S values of surviving and perishing plants was visible just before rewatering (Figure 4), i.e. four days earlier than meanFv/Fm.
Quantifying the effect of photosynthetic heterogeneity on whole-plant performance: description
Under SWD, S accurately represented the photosynthetic heterogeneity and allowed deciphering surviving and
perishing plants. However, it failed to quantify the effect of photosynthetic heterogeneity on plant performance and stress tolerance, as shown by the overlap of S values tween WW and perishing plants (Figure 4). This is be-cause the deviation of both modes to the photosynthetic optimum is as important as the disparity between the two modes.
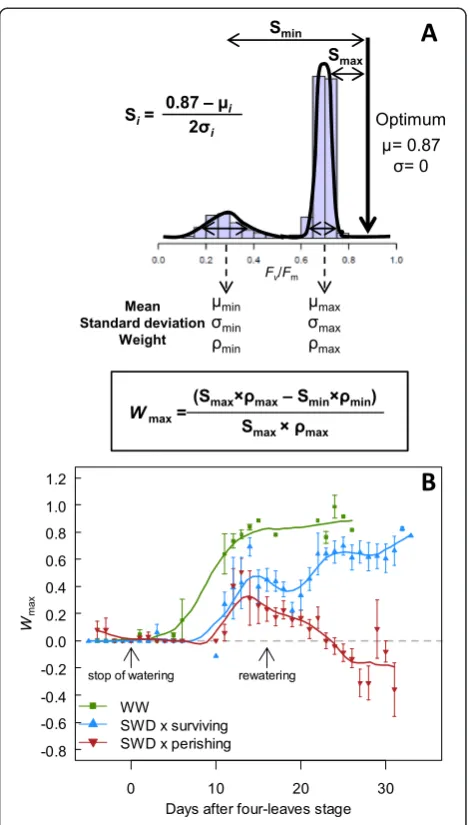
It was shown from energy conversion modelling of PSII that theoretical optimum of Fv/Fm is about 0.87 in un-stressed dark-adapted leaves [40,41]. However, a healthy plant displays a typical maximal mean Fv/Fm= 0.83 [8,9] and shows considerable variation around the mean. The theoretical optimum would be reached if a plant exhibits a unimodal distribution of mean 0.87 and variance 0. Hence, the photosynthetic deviation of each modeito the theor-etical optimum can be estimated as the bimodal separ-ation Si such as Si= (0.87 -μi) / 2σi(i.e., Smaxand Smin; Figure 5A). High Si represents low photosynthetic per-formance of the modei. Then, the weighted deviation to the optimum, which measured the size-corrected per-formance of a given mode, was calculated as Smax×ρmax and Smin×ρmin, for the maximum and the minimum Figure 2Effects of severe water deficit on plant photosynthetic efficiency. (A)Dynamics of whole-rosette meanFv/Fmof well-watered (WW) plants
and stressed (surviving and perishing) plants under severe water deficit (SWD) as a function of days after four-leaves stage (L4; beginning of SWD) until bolting. Data are means (± SE) of 13–29 plants.(B)3-D representations of vegetative rosettes under WW and SWD conditions inFv/Fmfalse colour (from
black pixel values (0) through red, yellow, green, blue to purple (ending at 1)) and their correspondingFv/Fmdistributions during time courses. Asterisks
indicatep-value < 0.01 (Hartigan’s dip test) meaning significant departure from unimodality ofFv/Fmvalues. Arrows indicate rewatering step.(C)Dynamics
Figure 3Dynamics of the parameters describing the bimodal distributions. (A)Example of a bimodal distribution composed of two clusters of pixels grouping in two modes. The higher mode (max; with the highestFv/Fmvalues) represents the healthiest parts of the rosette
whereas the second mode (min; with the lowestFv/Fmvalues) represents damaged/senescing parts of the rosette. Each modeiof the mixture
distribution ofFv/Fmvalues is characterized by meanμi, standard deviationσiand weightρi.(B-G)Dynamics ofμmaxandμminofFv/Fmvalues,
σmaxandσmin,and,ρmaxandρminin well-watered (WW) plants and under severe water stress (SWD; surviving and perishing plants) as a function
modes, respectively (Figure 5A). To estimate the spatial efficiency of a photosynthetically heterogeneous plant to convert light energy into chemical energy (Wmax), we calculated the proportion of Smax×ρmax(i.e., the weighted deviation to the optimum of the most efficient leaf re-gions) in the distribution of Fv/Fm values, as Wmax= (Smax×ρmax - Smin×ρmin) / Smax×ρmax (Figure 5A). By definition, for a unimodal distribution Wmax= 0 because there is no spatial heterogeneity (Smax×ρmax= Smin×
ρmin). Basically, increase or decrease in Wmax indicates that the contribution of the most efficient/healthiest re-gions to the whole-plant photosynthetic performance is more or less important, respectively, than the contribu-tion of the least efficient or senescing regions (note that Wmaxhas a maximum value of 1). For a heterogeneous surface (i.e., not in the first stages of plant development which display Wmax= 0 because of unimodal distribu-tions), Wmax= 0 is assumed to be the compensation point, where the healthiest leaf regions compensate the negative effect of the less efficient leaf regions. Negative values ofWmaxappear when the contribution of senes-cing leaf regions is prevailing.
Quantifying the effect of photosynthetic heterogeneity on whole-plant performance: applications
In plants grown in WW conditions, Wmax increased progressively during development from 0 to ca. 0.85 (Figure 5B). This reflects the increase in the hetero-geneity of whole-plant photosynthetic performance (i.e., a switch from unimodality to bimodality) with a very low
and negligible effect of the minimum mode compared to the maximum mode. In stressed plants, the increase ofWmaxwas delayed and reduced (Figure 5B). In surviving plants,Wmaxstarted to decrease at 15 days after L4 stage, and recovered shortly (2 days) after rewatering. At bolting, surviving plants exhibited a Wmax of ca. 0.65, i.e. 23% less than WW plants at the same developmental stage (Figure 5B). By contrast, in perishing plants,Wmaxstarted
Days after four-leaves stage
0.0 0.2 0.4 0.6 0.8 1.0
0 10 20 30
B
im
oda
l s
e
par
a
ti
o
n S
stop of watering
rewatering
WW
SWD x surviving SWD x perishing
Figure 4Dynamics of spatial heterogeneity of whole-plant photosynthetic efficiency during development and severe water deficit.Bimodal separation (S) ofFv/Fmvalues of well-watered
(WW) plants and stressed plants (SWD; surviving and perishing) as a function of days after four-leaves stage (beginning of SWD) until bolting. S = (μmax-μmin) / 2 (σmax+σmin) measures the distance
between the modes and is superior to 1 essentially if the two modes do not overlap. Data are means (± SE) of 13–29 plants.
Figure 5Dynamics of the spatial efficiency of a
photosynthetically heterogeneous plant (Wmax). (A)Illustration of
the mixture parameters in the case of a bimodal distribution.Wmaxis
calculated as the proportional difference in the weighted bimodal separation of each mode (Smaxand Smin) to the theoretical optimum of
photosynthetic performance (0.87, with standard deviation = 0), such as:
Wmax= (Smax×ρmax- Smin×ρmin) / Smax×ρmax.Wmaxestimates the
relative contribution of the most efficient/healthiest leaf regions to the whole-plant photosynthetic performance.(B)Dynamics ofWmaxof plants
to decrease after 14 days following the L4 stage and be-came negative ten days later.
We used simple mathematical functions to model the dynamics of the parameters of the bimodal distributions in various stressing conditions, and simulate the associated variations of S and Wmax (see Additional file 3). First, this simulation exercise was sufficient to reproduce what has been observed in this paper in plants grown under SWD that did not sur-vive the stress. The parameters of these functions were then varied to simulate different scenarios of photosynthetic heterogeneity generated by different stress intensities. Our sensitivity analysis of Wmax showed that it becomes as negative as (1) the rate of decrease in means and (2) the increase in proportion of damaged leaf regions, are high (i.e., low stress tolerance, and/or diffuse stress effect, high stress intensity). Conversely, its decrease is delayed when the rates of decrease in means and rates of changes are low (i.e., high stress tolerance, stress effects with high patchiness, and/or low stress intensity; see Additional file 3).
To explore further the possible applications of Wmax, we performed the same analysis on two other datasets. First, we used an independent dataset (not generated with the PHENOPSIS platform) to explore the genetic variability in photosynthetic performance in six accessions of Arabidopsis from contrasted geographic locations. The plants displayed little variation during plant development in mean Fv/Fm values (Figure 6A). However, we observed an increase in photosynthetic heterogeneity S and Wmax during plant development (see Additional file 4: Figure S3). We calculated the increase in Wmax during development as the slope of the relationship between Wmax and plant age. Interest-ingly, we found that 72% of the variability in plant dry mass at 48 days after stratification (DAS) was explained by the variation of Wmax between 17 and 48 DAS (P< 0.05; R = 0.85; Figure 6B).
Second, we investigated the effect of soil inoculation with Phyllobacterium brassicacearum STM196 strain, a plant growth-promoting rhizobacteria (PGPR) that im-proves plant tolerance to moderate water deficit [42] and also increases plant survival under SWD [19]. Bressonet al., 2014 [19] showed that STM196-inoculated surviving plants also exhibit a higher growth recovery after rewater-ing, leading to a higher plant biomass than non-inoculated plants [19]. Here, we showed that STM196-inoculation in-duced a faster and higher increase in Wmax than non-inoculated plants from 2 days after rewatering (Additional file 5: Figure S4). This suggests that the positive effects of STM196 on growth recovery, biomass production and plant survival may be related to its effects on whole-plant photosynthetic heterogeneity.
Discussion
Analysing the effects of environmental conditions on plant growth, survival and yield requires massive, rapid and non-invasive tools to track changes in plant perform-ance. Non-invasive ChlF imaging has been developed to give insights into plant photosynthetic capacities and explore the ability of plants to tolerate various environ-mental stresses (e.g., [8,16,43]). Most often the mean values of various indices of ChlF, including the widely used Fv/Fm, of an organ or a plant is used to characterize the response to a stressor (e.g., [8,11]). However, a ChlF image is composed of a panel of pixels in a given range (Fv/Fm= [0; 1]). Hence, using mean values does not give a clear clue of the disparity of values that corresponds to contrasted physiology. Heterogeneity in the photosyn-thetic capacities of plants has been observed but rarely quantified in responses to a wide variety of external stimuli (e.g., [10,16,25-32]). For instance, the establishment Figure 6Variation ofFv/Fmand relationship betweenWmaxand growth in six accessions ofA. thaliana. (A)Dynamics of whole-rosette meanFv/Fmas a function of days after stratification (DAS).
Pots (n = 4) were manually watered three times per week to maintain good (non-stressing) soil moisture.(B)Relationship between the slope ofWmaxin the course of plant development and plant dry mass at 48
of Fv/Fm heterogeneity in response to stress has been described by sampling small areas on the leaf surface [10,29,30], visual inspection of the shape of distributions [25-29,32], or by Fv/Fm clustering [16]. However, this is prone to large variations depending on the species, experi-menter and stress. ChlF heterogeneity is often admitted but its standardized, objective and reproducible quantifi-cation is still lacking. For instance, previous methods used threshold-based analysis to quantify the area and progres-sion of senescence or damages [8,16]. Here, we proposed a method to quantify (1) the heterogeneity ofFv/Fmvalues at whole-plant level (S) and (2) the spatial efficiency of a photosynthetically heterogeneous plant (Wmax). Although we applied our method to measurements ofFv/Fm in the Arabidopsis rosette under a severe water deficit scenario, we argue that the approach can be used with other ChlF parameters (e.g.,ΦII, NPQ) as well as in response to other stressing conditions that induce variations of the physio-logical status.
Photosynthetic heterogeneity is intrinsic to the development of plants
Our results showed that the distribution ofFv/Fmvalues shifted from unimodal to bimodal distributions both under WW and SWD conditions, and this despite a con-stant meanFv/Fmin WW plants. This result indicates that heterogeneity in photosynthetic efficiency (i.e., the in-crease in the proportion of bimodal Fv/Fm distributions) does not appear only under stress but is intrinsic to the development of plants. Importantly, S andWmaxin WW plants also significantly increased during development. It therefore indicates that, even in the absence of visible senescence, (1) there were leaf regions exhibiting lower Fv/Fm, (2) low-efficiency leaf regions increased during development and, (3) the contribution of these latter was minor on whole-plant photosynthetic performance under WW conditions. There might be different sources of photosynthetic heterogeneity. First, at the whole-plant level, photosynthetic heterogeneity in plants might be caused by age-induced leaf senescence, i.e. by visible and non-visible cell death and nutrient remobilization, notably on the edges of the oldest leaves. In addition, the increase in the size of leaf veins with increasing leaf size can also induce a decrease in the mean Fv/Fm, as well as an increase inFv/Fmheterogeneity. Second, at the sub-cellular level, some of PSII centres are inactive to linear electron transport. Functional PSII heterogeneity is for instance expected since 70-80% of PSII are located in the stacked grana region and the remaining PSII are located in the stroma-exposed region of the thylakoid membrane [44-47].
We also showed that the variation in photosynthetic heterogeneity might be a key trait related to plant growth, as suggested by the significant correlation between the
increase in Wmax during development and biomass in six contrasted Arabidopsis accessions and despite no distinct differences in the meanFv/Fmbetween genotypes. The analysis of the distributions ofFv/Fmvalues, as pro-posed with S and Wmax, allows the quantification of the whole-plant heterogeneity and may be more informative than the whole-plant mean value to investigate changes during plant development and genetic variation in plant performance.
The indicators of photosynthetic heterogeneity (S andWmax)
are linked to plant tolerance to severe water deficit
Our analysis revealed that SWD affected the establishment of the intrinsic heterogeneity in plants during development. The heterogeneity ofFv/Fmvalues (quantified by S) across the rosette increased differently depending on the state of the plants. Importantly, S was a more sensitive indicator of the plant physiological status than the meanFv/Fm. Indeed the mean Fv/Fm was stable during the first 14 days in stressed plants, while a strong photosynthetic heterogen-eity was already present (Figures 2A and 4). S allows the discrimination between surviving and perishing plants earl-ier,ca. four days, than the whole-rosette meanFv/Fm. The lag time before recovery was also shorter in S values than the meanFv/Fm.
plants thus presented the same heterogeneity than well-watered plants.
However, the contribution of the most efficient leaf re-gions was more negatively impacted in the perishing plants. In surviving plants,Wmaxdecreased during stress establishment and recovered rapidly after rewatering. This indicated that the contribution of the healthiest leaf regions was sufficient to compensate the negative effects of senescence and to support plant survival. By contrast, in perishing plants,Wmaxconstantly decreased and reached negative values, reflecting that the contribution of low-efficiency leaf regions on whole-plant photosynthetic performance was too important and led to plant death. We also showed that increase inWmax is related to the improvement of plant survival and biomass production upon inoculation with a PGPR that affects photosynthesis in plants [42]. We argue thatWmaxcould be a good indi-cator to predict plant survival under water stress, and pre-sumably in response to other stresses.
The results of the sensitivity analysis (Additional file 3) showed that Wmaxis specifically sensitive to changes in the proportion of damaged leaf regions and in the lag time,i.e.the time before the appearance of the first symp-toms. By contrast, S is independent of the proportion of leaf damaged but strongly impacted by the dynamics of the means. This simulation analysis suggests that the variation of Wmaxduring stress (specifically, the rate of decrease and the time to reach negative values) can be a good indicator of stress tolerance in response to many environmental stresses. We argue that the parameters of the mathematical functions used to model the dy-namics of mixture distributions could be used as useful tolerance/sensitivity indices. Additional work is how-ever needed to implement physiological hypotheses under the spatio-temporal dynamics of the mixture parameters.
Together, our results showed that the dynamics of S and Wmaxallow quantifying photosynthetic heterogeneity and its relationship with plant performance, during plant development and under stress. Although the variation in meanFv/Fmis informative about overall changes in plant performance, we showed that the modifications ofFv/Fm distributions are not accurately tractable by the modifica-tions of mean Fv/Fm, or other threshold-based methods. For example, in comparison to Wooet al.[8] who used a 33% threshold for a mean Fv/Fm= 0.80 to discriminate surviving to perishing plants, here we showed that the bimodal separation S allowed discriminating plants four days earlier than mean Fv/Fm. Moreover, the quantita-tive measurement of photosynthetic heterogeneity can be followed, repeated and modelled in the course of plant development. For instance, negative values ofWmax indi-cated death for individual plants; this may represent a powerful tool to screening plants to water stress. Our
study highlights that the management of the spatial photo-synthetic heterogeneity may be key to plant survival, and that theFv/Fmheterogeneity is a sensitive measure of plant responses to the environment. Further studies will un-doubtedly improve our capacity to predict plant tolerance, including survival, to different stressing environmental con-ditions using the indices of photosynthetic heterogeneity.
Conclusion
Heterogeneity in photosynthetic performance has impli-cations for overall plant performance. In this study, we characterized the heterogeneity of chlorophyll fluores-cence in leaves impacted by severe water deficit. We used a quantitative measure of (1) the heterogeneity of photo-synthetic efficiency S, and (2) the spatial efficiency of a photosynthetically heterogeneous plant, Wmax. S and Wmax gave a more accurate indication of the dynamics of leaf senescence or damages induced by water deficit than the whole-plant mean Fv/Fm. For instance, they allowed an earlier discrimination between surviving and perishing plants. S and Wmaxwere also strongly related to the genetic variability of growth between six contrasted accessions of Arabidopsis. Together our analyses suggest that S and Wmax could be useful indicators of plant re-sponses to their abiotic and biotic environments. Other studies are now needed to explore further the physio-logical causes and implications of the quantitative varia-tions of photosynthetic heterogeneity and then improve our ability to predict plant response to the environment.
Methods
Phenotyping platform PHENOPSIS
V4; Campbell Scientific). The climatic regulation of the growth-chambers is controlled by Loggernet software allowing the control of the desired environment by employ-ing an air drier or a water sprayer to modify air humidity, an air-cooler or a heater to modify air temperature.
Plant material, growth conditions and irrigation treatments
The experimentations performed in the PHENOPSIS automaton used A. thaliana (L.) Heynh, accession Columbia-0. Five seeds were sown at the soil surface in 250 cm3 cylindrical pots (10 cm high, 6 cm diameter) filled with a damped mixture (1:1, v:v) of loamy soil and organic compost Neuhaus N2 (see Additional file 6: Table S1 for soil chemical properties). Initial soil water content was controlled during pot filling by determining soil fresh weight (FWsoil) and soil dry weight (DWsoil, after 5 days at 80°C) every ten pots. Soil relative water content was calculated as RWCsoil= (FWsoil – DWsoil) × 100 × DWsoil−1. Subsequent changes in pot weight were attributed to a change in soil water status. The pots were kept in the dark for 2 days and were damped with sprayed deionised water three times a day until germination. Then, plants were cultivated under 12 h day length (180μmol m−2s−1 photosynthetic photon flux density, at plant height). Dur-ing germination phase (7 days), air temperature was set to 20°C day and night, and air relative humidity was adjusted in order to maintain constant water vapour pressure deficit (VPD) at 0.6 kPa. Then, plants were grown at 20/17°C day/night and 0.8 kPa of VPD. Just before the beginning of water stress, seedlings of similar sizes and developmental stages were selected and were thinned to one to four plants per pot. Each pot was daily weighed and watered with a modified one-tenth-strength Hoagland solution [48] to reach the target RWCsoil. RWCsoil was maintained at 0.35 g H2O g−1dry soil in the WW treat-ment (35%). SWD was started at L4 stage by stopping irri-gation to decrease progressively RWCsoilto reach 0.06 g H2O g−1dry soil (6%). After RWCsoil= 6% g H2O g−1dry soil, irrigation was resumed by adding a daily constant vol-ume of nutritive solution to reach the WW soil condition level, and was then maintained until final harvests at first flower open (stage 6.00; [34]). Soil water potential was determined by using a potentiometer (WP4-T dewpoint meter, Decagon Devices, Pullman, WA 99163, USA) dur-ing the soil drydur-ing.
An independent experiment was performed in the Max Planck Institute for Developmental Biology (Weigel lab, Tübingen, Germany) on six natural accessions from con-trasted geographic origins: ICE107 (South Italia), ICE111 (South Italia), ICE228 (South Tyrol), ICE50 (Spain), Sha (Kazakhstan), Yeg-1 (Caucasus). Each accession was grown in four replicates. Five to ten seeds were sown at the soil surface of each pot and stratified during 2 days in the dark at 4°C. Plants were then grown at 16°C and under 8 h day
length. At L4 stage, only one plant per pot was kept and grown until 48 DAS. Pots were manually watered 3 times a week to maintain good soil moisture.Fv/Fmwas measured every 2–3 days from 17 to 48 DAS (using the same ChlF imaging system as in the PHENOPSIS automaton described below). At 48 DAS, rosettes were harvested, dried at 65°C for 4 days and weighed.
High resolution of chlorophyll fluorescence imaging
Acquisition of chlorophyll fluorescence images
ChlF measurements were performed using Imaging-PAM chlorophyll fluorometer and ImagingWin software application (ver. 2-45d, Heinz Walz GmbH) connected with PHENOPSIS automaton. ImagingWin software is driven by Optima PLC (ver. 2–14, build v323, by Optimalog SARL; Saint-Cyr-sur-Loire, France) that allows the auto-matic movement of Imaging-PAM implemented on the arm of robot (Figure 1A) and the ChlF measurement of each pot with identical settings. The measuring system consists of a 2/3″Gigabit Ethernet IMAG K6-CCD camera (Manta, G-145B, ASG Allied Vision Technologies GmbH, Stadtroda, Germany), 1392 × 1040 pixel primary resolution with enhanced sensitivity by 4-pixel-binning resulting in 640 × 480 pixel images, coupled to an objective lens (F1.4/f = 12.5 mm; Cosmicar-Pentax, Hamburg, Germany) with a detector filter (RG665, 3 mm) and a short-pass interfer-ence filter (λ< 770 nm). Imaging-PAM is equipped with a powerful array of 44 high-power Luxeon LEDs for fluores-cence excitation and actinic illumination with blue light (450 nm) as well as assessment of absorbed photosynthet-ically active radiation with the help of red light (650 nm) and near-infrared (NIR)-light (780 nm). The ChlF imaging system was equipped by a conic, black, metal shading hood of 21.5 cm height wherein the pot was lift up by the balance controlled by a hydraulic cylinder (Figure 1A). This system allows avoiding the illumination of neigh-bouring plants and achieving the optimal working of 18.5 cm distance from the LEDs resulting in an imaged area of approximately 9 x 12 cm with +/−7% maximal deviation of intensity from the mean value. The image acquisition takes 30 s per plant, and different files are generated such as .PIM files (which are only usable by ImagingWin software) and .CSV files, which contain re-quested parameters such as F0, Fm andFv/Fm averaged on a region of interest. Two images of ChlF acquisition are also generated: *.JPEG files which give a representa-tion of the image acquired in false colour (from black pixel values (0) through red, yellow, green, blue to pur-ple (ending at 1)) and *.TIFF files with contain different stacks of fluorescence parameters (see below).
Measurement of maximum efficiency of PSII (Fv/Fm)
Intensity 2) for determination of F0. The Fm level of fluorescence is recorded during a saturating pulse (Si 9, width 800 ms).Fv/Fm, calculated as (Fm-F0)/Fm, provides the maximum quantum yield of PSII (i.e., photosynthetic efficiency). In the study,Fv/Fmwas daily performed, from the two first leaves to bolting, on dark-adapted plants (8–12 h of dark), under WW and SWD conditions.
Data extraction of photosynthetic efficiency and rosette expansion during time course
We developed an ImageJ macro “PHENOPSIS-Fluo” to semi-automatically extract whole-rosetteFv/Fmpixel values and total leaf area from the generated TIFF files (contain-ingF0andFmpixel values, and NIR images). The analysis of ChlF images starts with image segmentation from NIR pictures,i.e.the automatic separation of the region of interest (here the rosette) from the background. Then, by subtracting and dividingF0andFmstacks, [(Fm–F0)/ Fm], the macro generates an image ofFv/Fm pixel values, which are represented in the 255 greyscale (0 and 255 cor-responding to the minimum and maximum pixel values of the selection, respectively). The macro gives the whole-rosetteFv/Fm mean and the list of pixel values across the plant. Projected area of the rosette (RAproj) was also deter-mined from plant selection. Different plants in the same pot can be independently measured. Whole-rosette mean Fv/Fmextracted with the macro “PHENOPSIS-Fluo” was highly correlated with the mean of the rosette extracted from the commercial software ImagingWin (R2= 0.98; Additional file 7: Figure S5). The“PHENOPSIS-Fluo”macro is available on the PHENOPSIS website (http://bioweb. supagro.inra.fr/phenopsis/MacroImageJ.php).
Under SWD conditions, growth dynamics of surviving plants were modelled as a sigmoid curve fitted following RAproj=a/ [1 + exp-[(d-a/2)/b]] whereais the maximum area, and d is the number of days after L4 stage. Under WW conditions, an exponential curve was fitted such as RAproj= exp (a–b×d).
Statistical analyses and modelling procedures
All analyses were performed using R 3.1[49]. Comparisons of mean trait values between treatments were performed with Kruskal-Wallis non-parametric tests. Survival per-centage was calculated as the proportion of surviving plants at the end of experiment compared to initial num-ber of plants. Plant survival was analysed by Chi2tests. Non-parametric significance test for unimodality, Hartigan’s dip test (R package ‘dip test’ [35-37]) was used to identity multimodal distribution, withp-value < 0.01 as the significance threshold for departure from unimodality. Then, the REBMIX algorithm for finite mix-ture models ([38]; R package ‘rebmix’) as used to characterize each mode i of the bimodal distributions of
Fv/Fm values (i.e., mean μi, standard deviation σi and weightρi), using the Bayesian Information Criteria (BIC).
We developed a modelling procedure of the temporal dynamics of the means, standard deviations and propor-tions (weights) of the mixture distribupropor-tions. We then simu-lated the variation of these parameters and, subsequently, the variation of S andWmax(Additional file 3).
All meteorological and phenotypic data, ChlF files and images, R scripts are available in the PHENOPSIS web site (http://bioweb.supagro.inra.fr/phenopsis/) and database [50].
Additional files
Additional file 1: Figure S1.Soil water potential during soil drying. Soil water potential was determined using a potentiometer (WP4-T dewpoint meter, Decagon Devices, Pullman, WA 99163, USA) during soil drying (from 0.35 to 0.06 g H2O g−1dry soil).
Additional file 2: Figure S2.Representations of vegetative rosettes in
Fv/Fmfalse colour (from black pixel values (0) through red, yellow, green,
blue to purple (ending at 1)) under well-watered (WW) conditions and under severe water stress (SWD; surviving and perishing plants) during time courses.
Additional file 3:Modelling the spatial heterogeneity of photosynthetic efficiency under stress.
Additional file 4: Figure S3.Spatial heterogeneity S of whole-plantFv/Fm
andWmaxin six accessions ofA. thaliana. (A) Bimodal separation S and (B) the
spatial efficiency of a photosynthetically heterogeneous plantWmaxas a
function of days after stratification (DAS). The six accessions were collected from different geographic origins (ICE107: South Italia; Sha: Kazakhstan; ICE111: South Italia; ICE50: Spain; Yeg-1: Caucasus; ICE228: South Tyrol).
Additional file 5: Figure S4.Wmaxunder biotic and abiotic interaction:
effect of inoculation by a plant growth promoting rhizobacteria (PGPR) under severe water stress.Wmaxin non-inoculated plants (NI; solid lines)
and inoculated plants with the PGPRPhyllobacterium brassicacearum
(STM196; dashed lines) under well-watered (WW) conditions and severe water stress (SWD; surviving and perishing) as a function of days after four-leaves stage (beginning of SWD) until bolting.
Additional file 6: Table S1.Soil chemical properties of the compost (Neuhaus N2), soil and two mixtures of both. Mixture 1 was sampled before experimentation and mixture 2 was sampled after experimentations. nd: not determined. Soil analysis was performed by ALFA Agricultural Service and Research Building, Soil Testing Laboratory of Auburn University.
Additional file 7: Figure S5.Correlation between extracted whole-rosette meanFv/Fmwith the macro“PHENOPSIS-Fluo”and extracted from CSV files
from ImagingWin software.R2is the Pearson’s coefficient of correlation
between 164 rosettes analysed with both the PHENOPSIS-Fluo macro and the ImagingWin software.
Abbreviations
ChlF:Chlorophyll fluorescence; PSII: Photosystem II; QA: Quinone A, the
primary stable electron acceptor of PSII centres;Fv/Fm: Maximum quantum
efficiency of PSII photochemistry (photosynthetic efficiency);F0: Minimal
fluorescence emission of a dark-adapted plant;Fm: Maximum fluorescence
emission after a short pulse of a saturating light;Fv: Variable fluorescence
from dark-adapted plant; S: Spatial heterogeneity ofFv/Fm;Wmax: Spatial
efficiency of a photosynthetically heterogeneous plant; SWD: Severe water deficit; L4: Four-leaves stage; RWCsoil: Soil relative water content; WW: Well
watered condition; DAS: Days after stratification; PGPR: Plant growth-promoting rhizobacteria; CCD: Charge Coupled Device; FWsoil: Soil fresh weight; DWsoil: Soil
dry weight; VPD: Water vapour pressure deficit; NIR: Near-infrared; RAproj: Projected area of the rosette.
Competing interests
Authors’contributions
JB, DV conceived and designed the experiments in the PHENOPSIS platform. JB, MD and GK performed the experiments in the PHENOPSIS platform. FV conceived and performed the experiments on the six Arabidopsis accessions. JB, FV and DV analysed the data. DV performed the modelling. DV and CG contributed reagents/materials/analysis tools. JB, FV, DV, CG and MD contributed to the writing of the manuscript. All authors read and approved the final manuscript.
Acknowledgements
We are very grateful to G. Rolland, A. Bediee, F. Bouvery and C. Balsera for help during the experiments. We thank F. Fiorani for giving us advice on the design of the ChlF system. We thank D. Fourré, M. Desigaux, O. Meyerhoff and J. Kolbowski for helpful technical supports. We thank B. Touraine and F. Varoquaux for constructive remarks on plant-microbes interactions and for providing us the rhizobacteria (STM196). We thank B. Genty and S. Bieker for helpful comments and suggestions on this paper. We thank D. Weigel for his contribution and support at different stages of the study. We thank A. Christophe for the helpful discussions during the modelling procedure. We also thank two anonymous reviewers for helpful comments on this paper. JB was funded by French Ministry of Higher Education and Research and was supported by the Institutional Strategy of the University of Tuebingen (Deutsche Forschungsgemeinschaft, ZUK 63). FV was funded by a post-doctoral grant from the Max Planck Society. This work was made possible by a series of grants supporting the development of the plant phenotyping platform: the European Plant Phenotyping Network funded by the FP7 Research Infrastructures Program of the European Union (EPPN, grant agreement no. 284443) and the EIT Climate-KIC project AgWaterBreed.
Author details
1
Laboratoire d’Ecophysiologie des Plantes sous Stress Environnementaux (LEPSE), INRA, Montpellier SupAgro, UMR759, F-34060 Montpellier, France.
2
Laboratoire des Symbioses Tropicales et Méditerranéennes (LSTM), UMR113, Université Montpellier 2-IRD-CIRAD-INRA-SupAgro, F-34095 Montpellier, France.3Center for Plant Molecular Biology (ZMBP), General Genetics, University of Tuebingen, D-72076 Tuebingen, Germany.4Max Planck Institute
for Developmental Biology, D-72076 Tuebingen, Germany.
Received: 11 December 2014 Accepted: 12 March 2015
References
1. Granier C, Vile D. Phenotyping and beyond: modelling the relationships between traits. Curr Opin Plant Biol. 2014;18:96–102.
2. Baker NR, Rosenqvist E. Applications of chlorophyll fluorescence can improve crop production strategies: an examination of future possibilities. J Exp Bot. 2004;55:1607–21.
3. Porcar-Castell A, Tyystjärvi E, Atherton J, van der Tol C, Flexas J, Pfündel EE, et al. Linking chlorophyllafluorescence to photosynthesis for remote sensing applications: mechanisms and challenges. J Exp Bot.2014;doi:10.1093/jxb/eru191. 4. Chaerle L, Leinonen I, Jones HG, Van Der Straeten D. Monitoring and
screening plant populations with combined thermal and chlorophyll fluorescence imaging. J Exp Bot. 2007;58:773–84.
5. Murchie EH, Lawson T. Chlorophyll fluorescence analysis: a guide to good practice and understanding some new applications. J Exp Bot.2013; doi:10.1093/jxb/ert208.
6. Maxwell K, Johnson GN. Chlorophyll fluorescence - a practical guide. J Exp Bot. 2000;51:659–68.
7. Genty B, Briantais J-M, Baker NR. The relationship between the quantum yield of photosynthetic electron transport and quenching of chlorophyll fluorescence. Biochimica et Biophysica Acta (BBA)-General Subjects. 1989;990:87–92.
8. Woo NS, Badger MR, Pogson BJ. A rapid, non-invasive procedure for quantitative assessment of drought survival using chlorophyll fluorescence. Plant Methods. 2008;4:27.
9. Hunt S. Measurements of photosynthesis and respiration in plants. Physiol Plant. 2003;117:314–25.
10. Sperdouli I, Moustakas M. Spatio-temporal heterogeneity inArabidopsis
thalianaleaves under drought stress. Plant Biol. 2012;14:118–28.
11. Gray GR, Hope BJ, Qin XQ, Taylor BG, Whitehead CL. The characterization of photoinhibition and recovery during cold acclimation inArabidopsis thaliana
using chlorophyll fluorescence imaging. Physiol Plant. 2003;119:365–75. 12. Ehlert B, Hincha DK. Chlorophyll fluorescence imaging accurately quantifies
freezing damage and cold acclimation responses in Arabidopsis leaves. Plant Methods. 2008;4:12.
13. Janka E, Körner O, Rosenqvist E, Ottosen C-O. High temperature stress monitoring and detection using chlorophyllafluorescence and infrared thermography in chrysanthemum (Dendranthema grandiflora). Plant Physiol Biochem. 2013;67:87–94.
14. Quilliam RS, Swarbrick PJ, Scholes JD, Rolfe SA. Imaging photosynthesis in wounded leaves ofArabidopsis thaliana. J Exp Bot. 2006;57:55–69. 15. Bolhàr-Nordenkampf HR, Öquist G. Chlorophyll fluorescence as a tool in
photosynthesis research. In: Hall DO, Scurlock JMO, Bolhàr-Nordenkampf HR, Leegood RC, Long SP, editors. Photosynthesis and Production in a Changing Environment.Springer Netherlands; 1993. p. 193–206.
16. Rousseau C, Belin E, Bove E, Rousseau D, Fabre F, Berruyer R, et al. High throughput quantitative phenotyping of plant resistance using chlorophyll fluorescence image analysis. Plant Methods. 2013;9:17.
17. Rincon A, Valladares F, Gimeno TE, Pueyo JJ. Water stress responses of two Mediterranean tree species influenced by native soil microorganisms and inoculation with a plant growth promoting rhizobacterium. Tree Physiol. 2008;28:1693–701.
18. Heidari M, Golpayegani A. Effects of water stress and inoculation with plant growth promoting rhizobacteria (PGPR) on antioxidant status and photosynthetic pigments in basil (Ocimum basilicum L.). J Saudi Soc Agric Sci. 2012;11:57–61. 19. Bresson J, Vasseur F, Dauzat M, Labadie M, Varoquaux F, Touraine B, et al. Interact
to survive:Phyllobacterium brassicacearumimproves Arabidopsis tolerance to severe water deficit and growth recovery. PLoS One. 2014;9:e107607. 20. Chaves MM. Effects of water deficits on carbon assimilation. J Exp Bot. 1991;42:1–16. 21. Krause GH. Photoinhibition of photosynthesis. An evaluation of damaging
and protective mechanisms. Physiol Plant. 1988;74:566–74.
22. McDowell NG. Mechanisms linking drought, hydraulics, carbon metabolism, and vegetation mortality. Plant Physiol. 2011;155:1051–9.
23. Munné-Bosch S, Alegre L. Die and let live: leaf senescence contributes to plant survival under drought stress. Funct Plant Biol. 2004;31:203–16. 24. Hensel LL, GrbićV, Baumgarten DA, Bleecker AB. Developmental and
age-related processes that influence the longevity and senescence of photosynthetic tissues in Arabidopsis. Plant Cell. 1993;5:553–64. 25. Genty B, Meyer S. Quantitative mapping of leaf photosynthesis using
chlorophyll fluorescence imaging. Funct Plant Biol. 1995;22:277–84. 26. Baker NR, Oxborough K, Lawson T, Morison JI. High resolution imaging of
photosynthetic activities of tissues, cells and chloroplasts in leaves. J Exp Bot. 2001;52:615–21.
27. Leipner J, Oxborough K, Baker NR. Primary sites of ozone-induced perturbations of photosynthesis in leaves: identification and characterization inPhaseolus
vulgarisusing high resolution chlorophyll fluorescence imaging. J Exp Bot.
2001;52:1689–96.
28. Oxborough K, Baker N. An instrument capable of imaging chlorophylla
fluorescence from intact leaves at very low irradiance and at cellular and subcellular levels of organization. Plant Cell Environ. 1997;20:1473–83. 29. Hogewoning SW, Harbinson J. Insights on the development, kinetics, and
variation of photoinhibition using chlorophyll fluorescence imaging of a chilled, variegated leaf. J Exp Bot. 2007;58:453–63.
30. Calatayud A, Roca D, Martínez P. Spatial-temporal variations in rose leaves under water stress conditions studied by chlorophyll fluorescence imaging. Plant Physiol Biochem. 2006;44:564–73.
31. Daley PF, Raschke K, Ball JT, Berry JA. Topography of photosynthetic activity of leaves obtained from video images of chlorophyll fluorescence. Plant Physiol. 1989;90:1233–8.
32. Lazár D, Sušila P, NaušJ. Early detection of plant stress from changes in distributions of chlorophyllafluorescence parameters measured with fluorescence imaging. J Fluoresc. 2006;16:173–6.
33. Granier C, Aguirrezabal L, Chenu K, Cookson SJ, Dauzat M, Hamard P, et al. PHENOPSIS, an automated platform for reproducible phenotyping of plant responses to soil water deficit inArabidopsis thalianapermitted the identification of an accession with low sensitivity to soil water deficit. New Phytol. 2006;169:623–35.
35. Hartigan JA, Hartigan P. The dip test of unimodality. The Annals of Statistics. 1985;13:70–84.
36. Hartigan PM. Algorithm AS 217: Computation of the Dip Statistic to Test for Unimodality. J R Stat Soc: Ser C: Appl Stat. 1985;34:320–5.
37. Maechler M, Ringach D. diptest: Hartigan’s dip test statistic for unimodality– corrected code. R package version 075–74. 2012. Available online at: http://CRANR-projectorg/package=diptest [Retrieved: January 4, 2013]. 38. Nagode M. rebmix. An R Package for continuous and discrete finite mixture
models. 2004.
39. Zhang C, Mapes BE, Soden BJ. Bimodality in tropical water vapour. Q J Roy Meteorol Soc. 2003;129:2847–66.
40. Demmig-Adams B, Adams Iii WW, Barker DH, Logan BA, Bowling DR, Verhoeven AS. Using chlorophyll fluorescence to assess the fraction of absorbed light allocated to thermal dissipation of excess excitation. Physiol Plant. 1996;98:253–64.
41. Björkman O, Demmig B. Photon yield of O2evolution and chlorophyll
fluorescence characteristics at 77 K among vascular plants of diverse origins. Planta. 1987;170:489–504.
42. Bresson J, Varoquaux F, Bontpart T, Touraine B, Vile D. The PGPR strain
Phyllobacterium brassicacearumSTM196 induces a reproductive delay and
physiological changes that result in improved drought tolerance in Arabidopsis. New Phytol. 2013;200:558–69.
43. Barbagallo RP, Oxborough K, Pallett KE, Baker NR. Rapid, noninvasive screening for perturbations of metabolism and plant growth using chlorophyll fluorescence imaging. Plant Physiol. 2003;132:485–93. 44. Chylla R, Garab G, Whitmarsh J. Evidence for slow turnover in a fraction of
photosystem II complexes in thylakoid membranes. Biochimica et Biophysica Acta (BBA)-Bioenergetics. 1987;894:562–71.
45. Chylla RA, Whitmarsh J. Light saturation response of inactive photosystem II reaction centers in spinach. Photosynth Res. 1990;25:39–48.
46. Cao J. Chlorophyllafluorescence transient as an indicator of active and inactive photosystem II in thylakoid membranes. Biochimica et Biophysica Acta (BBA)-Bioenergetics. 1990;1015:180–8.
47. Lavergne J, Leci E. Properties of inactive photosystem II centers. Photosynth Res. 1993;35:323–43.
48. Hoagland DR, Arnon DI. The water-culture method for growing plants without soil. Calif Agric Exper Stn Circ. 1950;347:1–32.
49. R Development Core Team. R: a language and environment for statistical computing. Vienna, Austria: R Foundation for Statistical Computing; 2009. 50. Fabre J, Dauzat M, Negre V, Wuyts N, Tireau A, Gennari E, et al. PHENOPSIS DB:
an Information System for Arabidopsis thaliana phenotypic data in an environmental context. BMC Plant Biol. 2011;11:77.
Submit your next manuscript to BioMed Central and take full advantage of:
• Convenient online submission
• Thorough peer review
• No space constraints or color figure charges
• Immediate publication on acceptance
• Inclusion in PubMed, CAS, Scopus and Google Scholar
• Research which is freely available for redistribution