Organized by C.O.E.T, Akola. Available Online at www.ijpret.com
408
INTERNATIONAL JOURNAL OF PURE AND
APPLIED RESEARCH IN ENGINEERING AND
TECHNOLOGY
A PATH FOR HORIZING YOUR INNOVATIVE WORK
DIGITAL ELEVATION MODELS AND SLOPE ANALYSIS IN SOME PART OF PURNA
RIVER SUBBASIN, CENTRAL INDIA
B. S. MANJARE
1, S. M. TALE
2, S.K. PAUNIKAR
3 1.Department of Geology, RTM Nagpur University, Nagpur-440 001, India.2.Collage of Engineering and Technology, Akola, University SGB Amravati, (MS) India. 3.P.G. Students Department of Geology, RTM Nagpur University, Nagpur-440 001
Accepted Date: 05/09/2017; Published Date: 10/10/2017
Abstract:
Slope is one of the important factor governing topography of the area. Slope governs many factors like drainage systems, drainage pattern and also affects soil cover of the area which ultimately leads to vegetation cover and vegetation density. Study area varies in elevation from 290 Mt. to 1147 Mt. With the help of SRTM-DEM and ArcMap 10.1 slope analysis is been carried out. Study area is been classified into 5 classes on the basis of slope in degree. Categories as Very gentle (0˚ to 3.39˚), Gentle (3.39˚to 9.80˚), moderate (9.80˚to17.89˚) and Moderate to steep (17.89˚ to 27.49˚) and Steep (27.49˚ to 48.01˚). Where northern part of study area is having steep slope and as going downwards in the southern parts of study area slope decreases up to very gentle.Keywords
: Slope, DEM, Purna River.
Corresponding Author: B. S. MANJARE
Co Author: - S. M. TALE
Access Online On:
www.ijpret.com
How to Cite This Article:
B. S. Manjare, IJPRET, 2017; Volume 6 (2): 408-414
PAPER-QR CODE
SPECIAL ISSUE FOR
INTERNATIONAL LEVEL CONFERENCE
"ADVANCES IN SCIENCE,
Organized by C.O.E.T, Akola. Available Online at www.ijpret.com
409
INTRODUCTIONDEMs are used for visual analysis of topography, landscapes and landforms other than modeling of surface processes (Welch, 1990). Currently Digital elevation models (DEMs) is considered as the main resource for the extraction of various geomorphologic and topographic features depending on their elevation, spatial distribution and deviations (Felicisimo, 1994). Digital Elevation Model (DEM), Digital Elevation Data (DED), Digital Terrain Data (DTD) (Campbell, 2002) or Digital Terrain Model (DTM) all consists of different arrangements of individual points of x (east-west direction) and y (north-south direction) coordinates of horizontal geographic positions. Z is the vertical elevation value that is relative to a given datum for a set of x, y points (Bolstad , 1994, Welch, 1990). The satellite images are becoming useful and necessary in geomorphology, especially in obtaining quantitative measurements and performing geomorphic analyses (Hayden et al. 1986). Image analysis provide geologists an opportunity to enhance, manipulate, and combine remotely-sensed digital data with several types of geographic information that in turn increases the amount of extracted information related to topographic and geologic features (Horsby & Harris 1992). In the study area, how the IRS LISS III false colour composite and SRTM DEM has been used for deliation of the geomorphology of the upper Chandrabhaga River. It occupies an area of 308.29 km2. The elevation
varies in the study area from 1147 m to 290m. The stratum of the Northern Western part mainly of Deccan traps. The southern part of the Watersheds contains alluvium. The Shuttle Radar Topography Mission (SRTM) is an international research effort that obtained digital elevation models on a near-global scale from 56° S to 60° N, to generate the most complete high-resolution digital topographic database of Earth. This data is provided in an effort to promote the use of geospatial science and applications for sustainable development and resource conservation in the developing world. Digital elevation models (DEM) for the entire globe, covering all of the countries of the world, are available for download. The SRTM 90m DEM’s have a resolution of 90m at the equator, and are provided in mosaic 5 deg x 5 deg tiles for easy download and use. All are produced from a seamless dataset to allow easy mosaicing. These are available in both ArcInfo ASCII and GeoTiff format to facilitate their ease of use in a variety of image processing and GIS applications. Data can be downloaded using a browser or accessed directly from the ftp site. In the Study Approach is made to analyse the slope with SRTM-DEM data. The slope information is useful in understanding the topography, geomorphology, soil types and their erodability, surface drainage etc ( Manjare 2015). Slope Analysis provide information about the topography of the area and on the basis of slope analysis area is been classified into Very genital slope (0° to 3.39°); Gentle slope (3.39° to 9.80°); Moderately steep slope (3.39° to 17.89°); Moderately to steep slope (17.89° to 27.49°); Steep slope (27.49° to 48.01°). A map is been generated using the SRTM-DEM data and on the basis of above classification showing slope map of study area (Fig.2). The slope element dependent on stratigraphy, structure, climate and erosion activity of the river (Paunikar, 2015).
Study Area
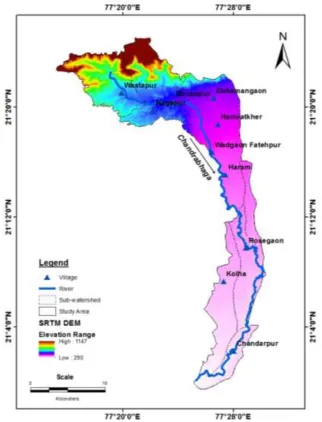
The study area encompasses the part of the upper Watershed of the Chandrabhaga River, which is main tributary of Purna River. It extends between 77˚ 04’ 23” E to 77˚ 25’ 19” E and 21˚ 20’52” N to 20˚ 53’24” N, and
administratively in Amravati districts of Maharashtra, India (Fig.1). The river Chandrabhaga originates from Satapura Hills (Chikaldhara) and flow in south direction. It occupies an area of 308.29 km2. The elevation varies in
Organized by C.O.E.T, Akola. Available Online at www.ijpret.com
410
Fig.1: Location map of study areaDigital elevation models (DEMs)
Organized by C.O.E.T, Akola. Available Online at www.ijpret.com
411
Fig. 2: Digital elevation map of the study areaSLOPE
Organized by C.O.E.T, Akola. Available Online at www.ijpret.com
412
slope which are mainly along the master streams. Low relief is present in the gentle slope class, moderate relief is belongs to moderate slope category and high relief is extant in the steep categories.SLOPE CLASSIFICATION
Slope study classified on the basis of the guideline mentioned in Integrated Mission for Sustainable Development (IMSD) document. The varying degree of slope leads to severe erosion of land soil. The effect of slope on geomorphology, soil and land used was studied. Variation of slope and relief, drainage networks and typical landforms are the result of erosion and tectonic activity (Ghosh, 2011). The slope for the Chandrabhaga sub-basin of Purna River varies from. It is evident from the slope map which has been extracted from the SRTM DEM (90m) resolution in which five slope category have observed in the given study area (Fig. 2).
a) Very genital slope (0° to 3.39°): This is the lowest category of slope in this region and is associated with
extremely flat part of area. This class provides ideal conditions for any type of farming, other agronomic condition favorable. Almost erodible land falls in this category which is drained by river and stream and represents an erosional surface of the current cycle. This covers Villages Chandarpur, Bargao, Rosegaon, Chamak Khurd, Petehpur, Wadgaon Fatehpur, Aregaon, Hanwatkher, Dhamangaon, Pimpalkhuta (Fig. 3).
b) Gentle slope (3.39° to 9.80°): This category of slope class covers an area having gently sloping terrain and do not
have irregularities in the form of small mounds or some undulation, which can be remove by leveling process. This slope region cover villages Deogaon, Nimdari, Bhopapur, Manjarkapdi, Nagapur, Somwarkheda, Malkapur, Dobanballa, Baglinga, Wastapur, Kulangna budruk (Fig. 3).
c) Moderately steep slope (3.39° to 17.89°): This type of slope does not have any problem for cultivation unless
there are irregularities on the surface. This slope region covers villages Tarabanda, Mojhri (Fig. 3).
d) Moderately to steep slope (17.89° to 27.49°): It covers an area in patches mostly in foot hills of Satpura hills,
part of basin. These parts are of reserved forest of Chikhaldara (Fig.3).
e) Steep slope (27.49° to 48.01°): It also covers the area in patches in different parts. This slope zone is prominent
Organized by C.O.E.T, Akola. Available Online at www.ijpret.com
413
Fig.3: Slope map of study areaDISCUSSION AND CONCLUSION
Study area is been classified into five categories slope such as Very gentle, gentle, moderate, Moderate to steep and Steep. From the slope map it can be seen that major part of the study area falls under Very Gentle slope category covers an area of 2.19.32 sq.km (71.14 %) and 14.90 % of the study area is characterized by Gentle slope category occupies an area of 45.95 sq.km. About 20.30 sq.km of the study area (6.54 %) comes under moderate slope category while the small proportion 16.09 sq.km (5.22 %) of the study area has moderately to steep sloping areas and only 7.14 sq.km (2.20) areas is of very steep slope. It can be concluded from above studies that north parts of study area covering majority of Deccan traps show very steep slope and slope decreases almost become flat with very gentle in the south parts consisting of Purna alluvium.
ACKNOWLEDGEMENTS
Organized by C.O.E.T, Akola. Available Online at www.ijpret.com
414
1. Bolstad P.V., (1994). An Evaluation of DEM Accuracy: Elevation, Slope, and Aspects. Photogrammetric Engineering and Remote Sensing.. 60 (11) pp. 1327-1332.2. Burrough, P.A. (1986) Principles of Geographical Information Systems for land resources assessment. Clarendon
Press, Oxford.
3. Burrough, P.A. (1986) Principles of Geographical Information Systems for land resources assessment. Clarendon
Press, Oxford.
4. Campbell L.B., (2002), Introduction to Remote Sensing. 3rd Ed. The Guilford Press, New York.
5. Davis, W.M (1899) The Geomorphic cycle Geroge. J. V. pp. 481-504.
6. Felicísimo A.M,. (1994), Parametric Statistical Method for Error Detection in Digital Elevation Models. ISPRS Journal of Photogrammetry and Remote Sensing.. Vol. 49 (4) pp. 29-33.
7. Ghosh S. (2011). Quantitative and Spatial Analysis of Fluvial Erosion in Relation to Morphmetric Attributes of
Sarujharna Basin, East Singh hum, Jharkhand. Int. Jour. Of Geometrics and Geosci., Vol.2 Issue 1,2011.
8. Hayden, R. S., Blair, R. W. Jr., Garvin, J. B. and Short, N. M. (1986) Global Geomorphology: Outlook for the Future. In Geomorphology from Space: A global overview of regional landforms. Pp. 657-675.
9. Horsby, J. K. and Harris, J. R. (1992). Application of Remotely Sensed Data to Geologic Exploration using Image Analysis and Geographic Information Systems. In Geographic Information Systems (GIS) and Mapping: Practices and Standards. Pp. 155-171.
10.Manjare B. S. (2015) Slope Analysis in Some Part of Wardha River Sub Basin of Maharashtra by Using SRTM DEM: An Integrated Approach of GIS Techniques Indian Jour. of Geomorphology, Vol. 20 (1) pp.1-8.
11.Moore, I.D., Grayson, R.B. and Landson, A.R. (1991). Digital terrain modelling: a review of hydrological, geomorphological, and biological applications. Hydrological Processes, 5:3-30.
12.Paunikar, S.K., (2016), Flood Hazard Risk Mapping of Upper Chandrabhaga Watersheds of Purna River Sub Basin, Maharashtra, Using Remote Sensing And GIS Techniques” Un-published thesis submitted to RTM Nagpur University, Nagpur P.60.
13.Welch R (1990), 3-D Terrain Modeling for GIS Applications. GIS World. Vol. 3 (5) pp. 26-30.
14.Wilson J. P. and Gallant J.C. 2000. Terrain Analysis: Principles and Applications. John Wiley and Sons, New York. pp. 87-131.