Organized by C.O.E.T, Akola. Available Online at www.ijpret.com 59
INTERNATIONAL JOURNAL OF PURE AND
APPLIED RESEARCH IN ENGINEERING AND
TECHNOLOGY
A PATH FOR HORIZING YOUR INNOVATIVE WORK
TO STUDY THE EFFECT OF POLYVINYL ACETATE ON IONIC NaCl
PROF. SUMALA JAMSING NINGWAL, PROF. JAYA VIJAY NIKOLE Accepted Date: 12/03/2016; Published Date: 02/04/2016Abstract: If we compare the result of polymer doped and NaCl salt Composites. It is
observed that addition of PVAc to NaCl salt gives the change in nature of ionic conductivity with change in Polyvinyl acetate PVAc % and Temperature. Thus polymer is best suited for controlling the activation energy and band gap energy of material and also it is best for increase the crystanality of material.
Keywords: Polyvinyl Acetate, Ionic NaCl, Polymer
Corresponding Author: PROF. SUMALA JAMSING NINGWAL
Co Author: PROF. JAYA VIJAY NIKOLE
Access Online On:
www.ijpret.com
How to Cite This Article:
Sumala Jamsing Ningwal, IJPRET, 2016; Volume 4 (8): 59-71 PAPER-QR CODE
SPECIAL ISSUE FOR
NATIONAL LEVEL CONFERENCE
"RENEWABLE ENERGY
Organized by C.O.E.T, Akola. Available Online at www.ijpret.com 60 INTRODUCTION
Polymer is made up of many small molecules which have combined to form a single long and large molecule. The individual small molecules from which the polymer is formed are known as monomer.
The word ‘mer’ in Greek means a unit, and so monomer stands for a single unit and polymer for many units joined together. A polymer usually has thousands of monomers bonded by a chemical reaction. For this reason, it is often called Macromolecules. If joining occurs essentially along one direction, we produce long chain polymers. These long chains are held together by secondary bonds in a polymeric solid.
Most of polymers are based on the covalent bonds formed by carbon. Polymers are complex and giant molecules and are different from low molecular weight compounds like say, common salt.The striking difference between the behavior of a polymer and that of a low molecular weight compounds concerns their solubility pattern. The process by which the monomer molecules are linked to form a big polymer molecule is called ‘polymerization’.
Polymers changed the life style of man. The modern era can definitely be called a polymer era as we wear these man made materials sleep between them, build houses, pulls witches, with their help, we can see and hear the sights remote from us. These polymers made revolutionary advancement in the field of medicine, with their help, cripples could walk, heart valves can be repaired and damage human organs could be replaced.
Example: Ethylene monomer gives the polyethylene.
CH2=CH2
↓ Polymerization.
[–CH2–CH2–]n
(polyethylene molecules containing n repeat units of CH2–CH2– )
b) Sodium Chaloride (Nacl)
Organized by C.O.E.T, Akola. Available Online at www.ijpret.com 61
when logk (logarithms of ionic conductivity) was plotted against 1/T (reciprocal of the absolute temp)
Hence,
Logk= E/T 1
Here E is the heat of activation or crition increament of energy which the ions must acquire in order to take part in ionic conduction. The slope of the straight line should given activation energy. If the assunrption is made that the conductance in a solid at temperare remote from its melting point is proportional only to number of ions which have a more than a certain threshold energy, then it fouows from maxwells boltzmams distrirution law.
K=CE 2
Where,
K is conductance, E is the threshold energy or heat of libration and Kb is boltzmanni constant eqr is may be uritlen in differential form as.
D logk /d (I/T) = -/E/KB
Thus, the heat of liberation of conducting ions in ergs can be calculated by multiplying the slope of logk versus I/T curve by a constant 3.17x10 The conductivity k could be found out from the relation.
K = In /VA
Where,
I- Current through sample
H – Height of sample
V – Voltage across the sample
Organized by C.O.E.T, Akola. Available Online at www.ijpret.com 62 Aim And Objectives
Aim :-
Composite is nothing but the mixing of two or more incompatible material in different proportion for the preparation of composite polymer is the best and most important material.
It is decide that to prepare the pallet of a polymeric composite, PVAc is used as dopant doped with NaCl salt (sodium chloride) doped in different weight percent, 0.25%, 1%, 3% and 4%. The main aim of the work is to characterize the sample by X-Rd & to study the effect of polymer on ionic conductivity of NaCl Material.
Objectives of Present work
i) To prepare pallets of NaCl + PVAc in different weight percent.
ii) Characterization: X-Rd of samples
iii) Measurement of ionic conductivity in the temperature range (280 to 6000c).
iv) To Calculate and plot the graph between log (Conductivity) verses 1/T (inverses of temperature)
v) To find out the activation energy from graph.
MATERIALS AND EXPERIMENTAL DETAILS
2:1 Materials: a) Polyvinyl acetate
Polyvinyl acetate formula
Organized by C.O.E.T, Akola. Available Online at www.ijpret.com 63
It is prepared by polymerization of vinyl acetate monomer, also referred to as VAM. Partial or complete hydrolysis of the polymer is used to prepare polyvinyl alcohol. Hydroylized alcohol product is typically in the 87% to 99% range (converted PVA)
Samples Preparation:- Samples of Polymer (PVA) polyvinyl acetate doped Nacl Salt in different
proportion were prepared by weight method. The percentage of each polymer in Nacl Salt were 0.25%, 1%, 3% & 4% Taken by weight measurement method. Pallets of these composite were prepared in the physics department of G.V.I.S.H. Amravati.
The Pallets were prepared by “Hydrallic Press” In “KBR” machine. The powder form of PVA and Nacl Salt are taken by percentage weight and water were used as a binder.
Thickness Measurements
The thickness and diameter were measured by screw gage having least count 0.001 cm.
Characterization Techniques
a) X-Rd:-
X-Ray diffractograms were obtained using X-Rd sentag USA, by CuKά radiations from VNIT Nagpur.
b) UV-spectra
UV absorption spectra of all the samples were taken on UV-visible spectrophotometer – 1700 Shimadzu, Govt. Pharmacy College, Amravati.
Theorotical Aspects
X-rd
Theory of X-Rd
Single crystals are materials in which the atomic order extends uninterrupted over the entirety of the specimen; under some circumstances, they may have flat vast majority of crystalline solids; however, are polycrystalline, being composed of many small crystals or grains having different crystallographic orientaition.
Organized by C.O.E.T, Akola. Available Online at www.ijpret.com 64
interaction with a series of parallel atomic planes according to Braggs law. Interplaner spacing is a function of the miller indices and lattice parameter as well as the crystal structure also by using X-Rd we can determine.
1) Lattice thermal expansion.
2) Particle Size.
3) Texture and strain in Lattice.
4) Temperature and pressure induced phase transformation.
There are various method for X-Rd of the sample such as
1) Rotation/Oscillation Method.
2) The Laue Method.
3) Powder Method
Where m1, m2, are the height of the minimum between two peaks and h1, h2 are the heights of the peaks from the base line.
Now, Crystanality X = (1 – R)
UV-spectra
Uv- Visible Spectra:-
Optical absorption measurement are carried out in particular to check the presence of sodium chloride (NaCl) in PVA matrix. In addition the study of optical absorption and particularly the absorption edge is a useful method for the investigation of optical induced transition and for the provision of information about the band structure and energy gap in both crystalline and non-crystalline materials the principle of this technique is that a photom with energy greater than the band gap energy.
Observations, Calculations & Graphs
Calculation:
X-Rd:
Organized by C.O.E.T, Akola. Available Online at www.ijpret.com 65
by using Manjunaths formula
R = m1+2m2 + ………….+ nmn (1)
h 1+ h2 +……….+ hn
Where m1, m2, are the height of the minimum between two peaks and h1, h2 are the heights of the peaks from the base line.
Now, Crystanality X = (1 – R)
h1 = 14.5 m1 = 0.2
h2 = 3.1 m2 = 0.12
h3 = 1.2 m3 = 0.1
by putting the values
R = 0.0395
X = (1-R)
= 0.9605
X = 0.9605 x 100%
X = 96.05% Crystanality
Same way crystanality was found to be 98.28% of samples 4% PVA doped NaCl the fig. No. ( )
UV- S Pectra.
From the UV-Peak i.e. Absorption verses wavelength from fig.( ) 0.25% PVAc doped with NaCl. The values of A (absorption) and wavelength canbe determined by plotting normal’s. The values of
A1 = 0.105 λ1 = 764
A2 = 0.263 λ2 = 306
A3 = 1.842 λ3 = 288
Organized by C.O.E.T, Akola. Available Online at www.ijpret.com 66
Where ν = c
λ
ά1 = 0.4033 x 10¹⁶
ά2 = 0.404 x 10¹⁶
ά3 = 2.667 x 10¹⁶
Then we, calculated άhν1, άhν2, άhν3 and hν1, hν2, hν3.
Then we Ploted the graph (άhν)2 verses hν.
The graph is shown in fig. ( )
The tangent line is drawn from bending of curve. The Band gap energy calculated will be found out 0.69 ev
The same procedure were applied to sample 1%, 3% and 4% as shown in fig. ( )
Ionic Conductivity calculation
From the formula
σ = I h (1)
VA
Where I = current through sample
h = height of sample
V = voltage applied to sample
A = (π r2) area of cross section of sample
for 0.25 % of Pellet
h = 1.105 cm
and diameter, d = 1.106 cm
Organized by C.O.E.T, Akola. Available Online at www.ijpret.com 67
Conductivity can be calculated by using equation (1)
The graph is ploted log.σ Verses 1/T (inverse of temperature)
The slope is found to be 0.3030
Activation energy calculated
Ea = -3.17 x 10⁻¹⁶ (dlog k /(d1/T))
Or
Ea = 3.17 x 10-16 x (0.3030) x 104
Ea = 0.96 ev
In this we calculated activation energy of sample Pure,0.25%,1% and 3%
Pure NaCl 20V
-10 -9 -8 -7 -6 -5 -4
0.001 0.0015 0.002 0.0025 0.003
1/T perk log ( c on du c ti v it y ) m ho pe r cm Pellet 025%10V -9 -8.5 -8 -7.5 -7 -6.5 -6 -5.5 -5
0.001 0.0015 0.002 0.0025 0.003
1/T Perk lo g ( c o n d u c ti v it y ) m h o p e r c m
Organized by C.O.E.T, Akola. Available Online at www.ijpret.com 68
Pellet 025% 20V
-10 -9 -8 -7 -6 -5 -4
0.001 0.0015 0.002 0.0025 0.003
1/T perk lo g (c o n d u c ti v ity ) m h o p e r c m
Pellet 1% 20V
-8 -7.5 -7 -6.5 -6 -5.5 -5
0.001 0.0015 0.002 0.0025 0.003
1/T perk lo g ( c o n d u c ti v it y ) m h o p e r cm
Graph No. (3) 0.25% PVA with NaCl -20V Graph No. (4) 1% PVA with NaCl -20V
Pellet 3% 10V
-8 -7.5 -7 -6.5 -6 -5.5 -5 -4.5 -4 -3.5 -3
0.001 0.0015 0.002 0.0025 0.003
1/T perk lo g ( c o n d u c ti v it y )m h o p e r cm
Pellet 3% 15V
-8 -7.5 -7 -6.5 -6 -5.5 -5 -4.5 -4 -3.5 -3
0.001 0.0015 0.002 0.0025 0.003
1/T perk lo g ( c o n d u c ti v it y )m h o p e r cm
Graph No.(5) 3% PVA with NaCl -10V Graph No. (6) 3% PVA with NaCl -15V
RESULT & CONCLUSION
RESULTS
Organized by C.O.E.T, Akola. Available Online at www.ijpret.com 69 Table No. 1 for U. V. Spectra.
Sr.No. % of pellet PVAc doped NaCl Band gap energy
1 Pure NaCl 0.932 ev
2 0.25% 0.69 ev
3 1% 0.82 ev
4 4% 0.89 ev
Table (1) Shows the values of band energy for pure NaCl and PVAc doped (0.25%, 1% and 4%) NaCl salt composite.
From the Table (1) as we increase impurity of polymer Band gap energy decreases.
Hence, the polymer impurity are used to control the band gap energy of ionic material or metals.
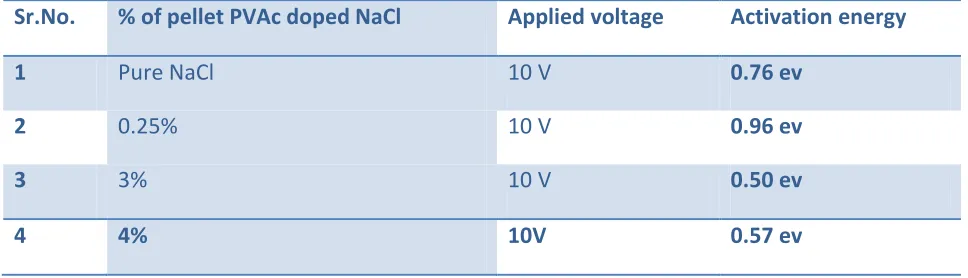
Table No. 2 for Ionic conductivity measurement
Sr.No. % of pellet PVAc doped NaCl Applied voltage Activation energy
1 Pure NaCl 10 V 0.76 ev
2 0.25% 10 V 0.96 ev
3 3% 10 V 0.50 ev
4 4% 10V 0.57 ev
Table (2) shows the values of Activation Narage for PVAc doped (in different weight 0.25%, 3% and 4%) NaCl salt composites.
Organized by C.O.E.T, Akola. Available Online at www.ijpret.com 70
The temperature dependence of electrical resistivity of pure and doped NaCl is shown in (graph 1 to 14).
It is seen that the curves can be divided into an three regions initial region of sharply decreasing resistivity, second region plateau region and a tail region in which the conductivity again sharply increases with increasing temperature. The Plateau is shortened with increasing impurity content. However, it becomes predominant in the case of PVAc doping while it is completely extinct for NaCl incorporations.
In the ionic crystals is that the charge transport is by charged ion them selves the fact that the ions are the current carriers is accompanied
by concurrent mass, transport of ions this means that a directed diffisional motion of the ions occur during conduction.
Conduction in ionic crystal due to ionic is closely connected with diffusion which at absolute zero temperature there is complete order in a
lattice. But all temperature greater than zero degree absolute there is certain amount of disorder in lattice.
The simplest example of disorder as vacant lattice site and interstitial atoms. These vacancies and interstitial are created thermally and which can migrate through lattice are responsible for conduction.
Diffusion under external electric field causes the ions to jump more in one direction than in other so a both matter and charge are transported.
The activation energies calculated from the slopes of these resistivity curves for the three regions are given in calculations along with the activation energies calculated from thermally stimulated discharge current measurements of these materials. The results are quite comparable. The electrical conduction in polymers can be attributed to the ions, due to the impurity incorporation the electrons which migrate along the polymer chain and also to the charges released by the electrolytic dissociation under thermal activation.
Organized by C.O.E.T, Akola. Available Online at www.ijpret.com 71
energies less than 0.2 ev should be considered as electronic mechanism and values more than 0.6 or 0.8 ev would normally be associated with ionic transport.
On doping the impurities with material the ionic contribution dominates over the electronic contribution even at low temperatures. The marked increase in the conductivity at higher temperatures on addition of impurities supports the mechanism of ionic conduction at these temperature
CONCLUSIONS
If we compare the result of polymer doped and NaCl salt Composites. It is observed that addition of PVAc to NaCl salt gives the change in nature of ionic conductivity with change in polyvinyl acetate PVAc % and Temperature.
Thus polymer is best suited for controlling the activation energy and band gap energy of material and also it is best for increase the crystanality of material.
REFERENCES
1. D.Lukas, A. Sarkar, L. Martinova, K. Vodsed’alkova, D. Lubasova et al. Physical principles of elctrospinning, Textile Progress Vol. 41, No.2, 2009,
2. S. Ramakrishna, K. Fujihara, W. Teo, T. Lim, and Z. Ma, An introduction to electro spinning and nanofibres, World Scientific Publishing Co., Singapor, 2005.
3. Anthony L. Andrady, Science and Technology of Polymer Nanofibers; John Wiley & Sons, Inc., Hoboken, New Jersey, 2008.
4. Chan Kim, Sang-Hee Park, Wan-Jin Lee, Kap-Seung Yang; Electrochimica Acta 50 (2004) 877– 881.