Research Article ISSN 2250-0480 VOL 7/ ISSUE 3/JULY 2017
L-15
Life Sciences Plant Sciences
COMPARE
MORPHOLOGICAL AND PHYSIOLOGICAL TRAITS OF
NATIVE PEAR GENOTYPES OF SARDASHT CITY
*FEREIDOON ALIPOOR
Department of Horticultural Science, Mahabad Branch, Islamic Azad University, Mahabad, Iran
ABSTRACT
According to findings of researchers the west of Iran is part of the center of origin pear fruit and the West Azerbaijan province, according to the topographical status and geographical conditions, its vegetation has great diversity. Native Pear in this province, especially in the highlands and jungles of Sardasht city as types of wild pear has a great variety. Accordingly, compare of the morphological and physiological traits of native pear of Sardasht based on national guideline tests for distinctness, uniformity, and stability (DUS )was conducted. There were, respectively 5and 9 traits of the shape of trees and one-year branch, among morphological traits and among physiological traits which 15 traits related to fruit, were investigated. This research, all genotype kinds of native pear, after identifying the trees and coding them was done in two stages and the considered traits were written and in a stage in the laboratory the chemical traits studied and statistical investigations were done using SPSS software. Chart analysis and resulted cluster analysis showed the number of 8 types of native pear genotype and showed its close relative value. In general, according to variance analysis of biochemical traits, the correlation was observed between all traits that most of the trees had abundant diversity. The collection of key traits was, well able to make differentiation and distinction between various native pear trees of Sardasht area.
Keywords: wild pear, morphological traits, physiological traits, DUS instructions, Sardasht.
INTRODUCTION
The pear, is the native fruit of western Asia and Eastern Europe, especially the regions of The Northwest and West of Iran and the Caucasus Mountains 1. In the type of pear, there are almost 20 different species that most of them don’t have edible fruits and only used as a basis for common pears. Of the 20 species, 11 species are in Iran in which, 5 species distributed in Kurdistan and West Azerbaijan. Pear is one of the most important fruits in the world that among the seedy fruits after apple has the second grade. Pear tree relatively resistant against the cold of winter and can withstand up to -30 ° C. Therefore, this tree can be grown in a wide range of Iran and be one of the products of the country's exports and exchange 2. Free entry of foreign varieties, especially Bartlett leads to paying less attention to internal figures so that removing the native varieties and replacing them with foreign varieties or the other fruits, constantly increasing and there is a fear that in the not far future the
species of native varieties destroyed and disappear from nature. including this we can mention Sanaly species that previously was one of the good native varieties, but by the now remained only a name for orchardists or we can cite the varieties of Gaveh, Belan, Biareh, Shoteh and Lale Abbasi that merely a single tree remained in the region or maybe in all the nature 3. Since each species has its unique genome with the loss of each variety many useful genes are destroyed that nature is incapable of regenerating them. On the other hand local varieties because of their genetic diversity and tolerance and compatibility which have obtained with their particular environmental conditions can be an important genetic basis for improving fruit trees 4, 5.
METHODOLOGY
Research Article ISSN 2250-0480 VOL 7/ ISSUE 3/JULY 2017
L-16
Life Sciences Plant Sciences
This study was carried out in 2014 at the different places of Sardasht city with 1515 m above sea level and with "45 degrees and 48 minutes long - 36 degrees 9 minutes "latitude in the forest and various villages of Sardasht city (the villages of Mir Sheikh Heydar with 1670 m, height from sea, Ghazan village with 1400 m height from sea level, Gvalan with 1492 m height from sea level and Vargel with 1069 m height from sea level). Sardasht located in the south of west Azerbaijan and has a semi-humid climate. The average annual rainfall is 615.5 mm; maximum temperature is 37 ℃, the minimum temperature 9 ° C and sometimes reaches below zero and has 76 percent relative humidity 6, 7.
The experimental design and methodology
The research was carried out on some native wild pear genotypes of Sardasht located in different areas of the forest and its different areas. The study was conducted in a randomized complete block design with three replications, some morphological and physiological and biochemical characteristics of fruit and pear trees were studied. Therefore, in the current study attempted to while selecting the
most important local Pear, take actions to evaluate in detail and accurate them based on national guideline tests for distinctness, uniformity and stability DUS). In this study, while studying the efficacy of this procedure on evaluating the variety of local Pear genotype, the obtained information will be used for breeding programs and record the figures used 8, 9.
The steps of carrying out the experiment
After identifying the desired location and the considered tree, the traits were evaluated based on national guidelines on distinction tests, uniformity of stability using the instructions provided by the International Union for the Protection of new plant Varieties. Taking notes of trees was done, in two stages of active growth period of trees from the mid-May to mid-June and the time of ripening and harvesting of the fruit from the mid- August to the mid- October in a year. The study of biochemical traits is done in mid-May to early November 10. Desired traits based on separation time priority and in the action stage the noting and sampling was done at least on three trees.
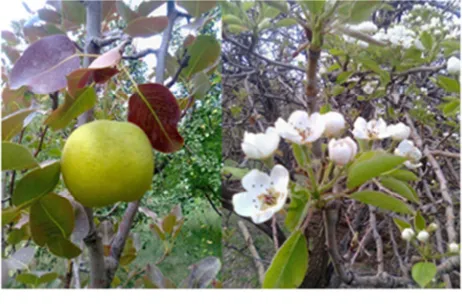
Figure 1
Flowering and fruiting some native pear trees
Figure 2
Research Article ISSN 2250-0480 VOL 7/ ISSUE 3/JULY 2017
L-17
Life Sciences Plant Sciences Figure 3
Fruits harvested from some local pears
Biochemical studies Measuring ion leakage
For this purpose, at first the samples of the leaves, weighed at rate of 0.5 grams and rinsed with distilled water the putted into test tubes, containing 20 ml of distilled water. The tubes were shake in 150 rpm and for 30 minutes by the shaker device (FINETECH model, built in Company of Ferdoos), then ion leakage of (L1) solution was measured by conductivity meter (aqualyticsensdirect CD24), then the samples for 15 minutes at 95 95 ° Placed in the hot water and at end the ion leakage of (L2) leakage after reaching equilibrium with ambient temperature measurement condition, the rate of ion leakage (damage to the cell membrane) was calculated from the following equation.
EL (%)=(L1.L2) ×100
Determination of total acidity
For this purpose 25 cc of taken fruit juice in an Erlen, reached to 2. cc with distilled water, and then eight drops of phenolphthalein was added to the solution and then by help of NaOH1. 0 normal, operation titration is done until the color change, then the volume of consumed NaOH and based on related equation the value of acidity was calculated according to acidity.
Acidity = V×0.0064×100.S
S = Amount of sample in terms of cc V=the volume of consumed NaOH Citric acid equivalent =0.0064
Chl(a,b)=[20.4(D645)+8.02(D663)] × V ⁄(1000×W)
The rate of red light absorbance in wavelength = related D
The volume of extract of V: The weight of wet sample of W:
C(x+c) = (1000A470-1.82 Ca - 85.02Cb).198 In the above equations Ca is a Chlorophyll,Cb is Chlorophyll of bC(x+c),the value of Carotenoids and A is the value of absorption in different wavelengths.
The measurement of fruit sugar by Fehling method
Research Article ISSN 2250-0480 VOL 7/ ISSUE 3/JULY 2017
L-18
Life Sciences Plant Sciences
the following formula the percentage sugar content in the extract was determined.
F Standard sugar factor
9.5 g of sucrose in 200 ml of distilled water was poured, and then 5 ml of concentrated hydrochloric acid added to it, and was placed in experimental temperature for two days and in the third day with NaOH 1,0 and 10 normal, reached to 1000 ml volume, then some of it poured into a graduated burette and tittered with 5 ml Fehling A ,5 ml Fehling B+ and a drop of metilen blue that the rate of used sucrose solution in titration was equal to standard figure of F.
V= the volume of extract used for titration Constant figure=0.00095
Preparation method for Fehling A: 17.32 g of copper sulfate is reached to 250 ml
Preparation method for Fehling B: double tartrate of Potassium sodium with 86.5 g plus 15 g NaOH reached to 250 ml volume.
Analysis of data
The results of the experiment using computer software SPSS version 16 was analyzed and to draw some charts Microsoft Office Excel (2010) software was used. The used tests include correlation, analysis of variance, regression, cluster analysis.
RESULTS
Analysis of Variance (ANOVA)
According to table 1, the places that are marked by asterisks, the difference is significant at %1 and places where marked with ns the difference is not meaningful. According to the table the difference in EC, TA and total sugar is meaningful at %1 and it can be concluded that there are different types of wild pear that are diverse in terms of biochemical traits and observed that there was no significant difference in the characteristics of PH and TSS.
Table 1
Table of variance analysis of biochemical traits of types of wild pear tree
Mean Square degree change sources Freedom
Total sugar pH EC TSS TA
7.142**
2.449
Ns 0.471
0.242
** 4.27
1.560
Ns 16.970
11.234
** 0.350
0.140
78 Pear Error
Ns and ** respectively, indicating significantly and non-significant at the probability level of 5 and 1.
Regression
Multiple linear regression in the fruit characters with the method of the forwarded variables choice
Table 2
The entered and exited variables in the model
Model The variables entered Deleted variables Method
1 The inspiration state to the fruit axis 0 Forward
2 Meat texture 0 Forward
3 Symmetry (in longitudinal section) 0 Forward
Table 1 shows the entered and removed variables from the model in the forward regression model. Three depth variables of inspiration state in ratio with the axis of meat axis and symmetry in the longitudinal section which have the required criteria in order to enter into the model are entered into the model in three phases. Table 2 shows that each of the models respectively %42,561 and %83
Research Article ISSN 2250-0480 VOL 7/ ISSUE 3/JULY 2017
L-19
Life Sciences Plant Sciences Table 3
Summary Model
Model Multiple correlation coefficients
Multiple coefficients of determination
The adjusted multiple
coefficients of
determination
The SD of multiple
coefficients of
determination
1 .734 .423 .376 .882
2 .798 .611 .595 .647
3 .895 .83 .778 .495
Table 4
Regression Analysis
Model Sum of squares Degree freedom Mean of squares F value sig
1 Regression 7.529 1 7.729 11.409 .004**
Error 11.219 15 0.645
All 18.749 16
2 Regression 11.829 2 5.814 13.675 .000**
Error 6.920 14 0.431
All 18.749 16
3 Regression 15.157 3 5.452 21.100 .000**
Error 3.592 13 .236
All 18.749 16
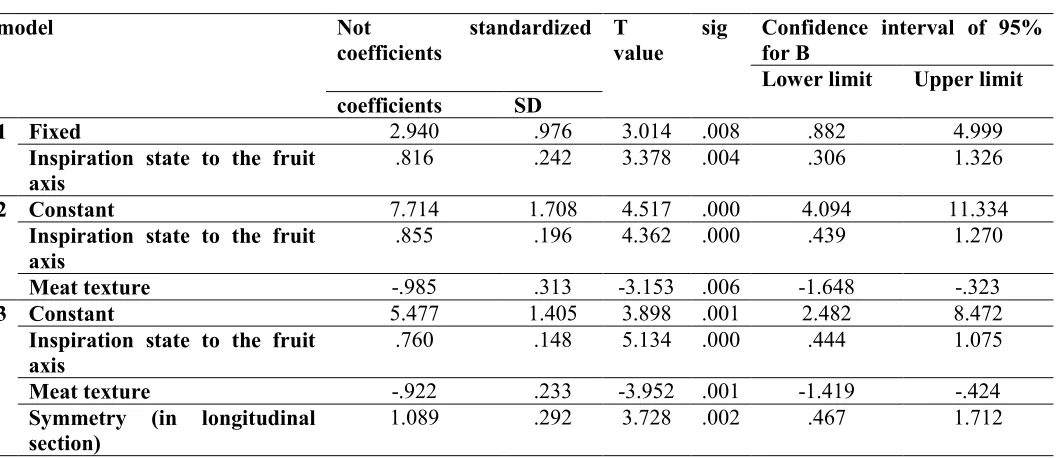
Table 5
Regression coefficients
model Not standardized
coefficients
T value
sig Confidence interval of 95% for B
Lower limit Upper limit
coefficients SD
1 Fixed 2.940 .976 3.014 .008 .882 4.999
Inspiration state to the fruit axis
.816 .242 3.378 .004 .306 1.326
2 Constant 7.714 1.708 4.517 .000 4.094 11.334
Inspiration state to the fruit axis
.855 .196 4.362 .000 .439 1.270
Meat texture -.985 .313 -3.153 .006 -1.648 -.323
3 Constant 5.477 1.405 3.898 .001 2.482 8.472
Inspiration state to the fruit axis
.760 .148 5.134 .000 .444 1.075
Meat texture -.922 .233 -3.952 .001 -1.419 -.424
Symmetry (in longitudinal section)
1.089 .292 3.728 .002 .467 1.712
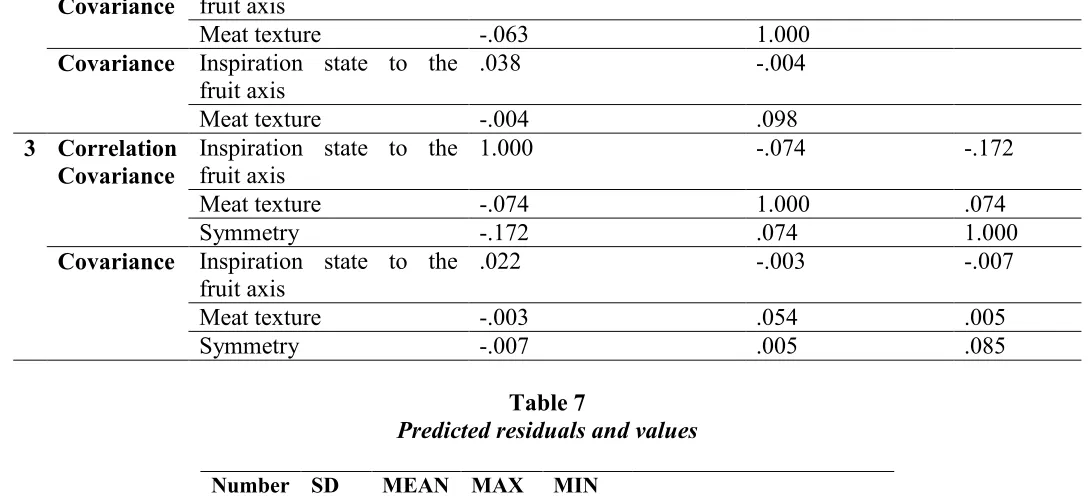
Table 6
Correlation matrix of variables of each model
Model The depth of end
indentation
The firmness of meat
Symmetry 1 Correlation Inspiration state to the
fruit axis
1.000
Covariance Inspiration state to the fruit axis
.058
Research Article ISSN 2250-0480 VOL 7/ ISSUE 3/JULY 2017
L-20
Life Sciences Plant Sciences Covariance fruit axis
Meat texture -.063 1.000
Covariance Inspiration state to the fruit axis
.038 -.004
Meat texture -.004 .098
3 Correlation Covariance
Inspiration state to the fruit axis
1.000 -.074 -.172
Meat texture -.074 1.000 .074 Symmetry -.172 .074 1.000
Covariance Inspiration state to the fruit axis
.022 -.003 -.007
Meat texture -.003 .054 .005 Symmetry -.007 .005 .085
Table 7
Predicted residuals and values
Number SD MEAN MAX MIN
16 .9163 6.1754 7.8247 4.3502 Predicted values
16 .4469 .00000 .59968 -.83416 Remained
16 1.000 .000 1.797 -1.989 The SD of predicted values
The multiple linear regression in the traits of tree with entering method
In table 1 the list of independent variables available in the model and regression method that is by entering method is reported.in table 8 the values of multiple correlation coefficients, multiple determination coefficients, the adjusted multiple determination coefficients and the standard deviation of multiple determination coefficient is reported. In general, 9 sums of squares, degrees of freedom, Mean Square, Fisher's exact test, and a significant level regression has been reported. In Table 10 for each of the parameters of the regression model, the estimated values of the parameters, the standard deviation of the parameter estimates, standard regression model parameter estimation, test and significant level parameters
have been reported. According to table 8 the values equal to 0.68, this means that linear regression bulge trunk, justifies growth habits, the power of growth and the status of the shell on shoots regeneration about 68% of the total variance. The significance level in table 9 is 0. 001. This means that in the model, the suppose at 0.005 and 0.01 is rejected.in the table the coefficients are the second value of significance of 0.000 that is rejected with %99 confidence. According to a significant level in table 6 at 0.05 percent, all variables have a critical role in the regression. According to the table of regression models is as follows:
= .101 + 1.33X − .045X + .165X − .285X
Table 8
The entered and exited variables from the model
Model Entered variables Exited variables Method
1 Body bulge
X2 the growth habits
X3: the power of growth
X4; Status of shell
Enter
Research Article ISSN 2250-0480 VOL 7/ ISSUE 3/JULY 2017
L-21
Life Sciences Plant Sciences Table 9
The summary of model
Model Multiple correlation coefficients
Multiple determination coefficients
The adjusted Multiple determination coefficients
The SD of Multiple determination coefficients
1 .825 .688 .632 .62780
Table 10
The analysis of regression
Model Sum of squares Degree freedom The mean of squares The value of F Significance level
1 Regression 12.786 4 3.197 6.965 .001
Error 5.518 12 .459
Total 18.304 16
Independent variable: Shoot proliferation
The predictor: bulge on the trunk, the growth of an organ, the growth of vigor, fixed amount and shell Status.
Table 11
Regression coefficients
Model Not standardized
coefficients
The estimated standardized regression parameters
Value of t
Significance %95confidence interval for regression coefficients Regression
coefficients
The SD of coefficients
Coefficients Lower
limit
Upper limit
1 Fixed .102 3.064 .061 .000 -6.387 6.758
The power of growth
1.33 .202 .807 5.055 .000 .589 1.456
The habit of growth
-.045 .417 -.011 -.072 .045 -.925 .865
Shell status
.165 .443 .068 .420 .03 -.763 1.136
Bulge on the trunk
-.285 1.580 -.032 -.189 0.05 -3.688 3.092
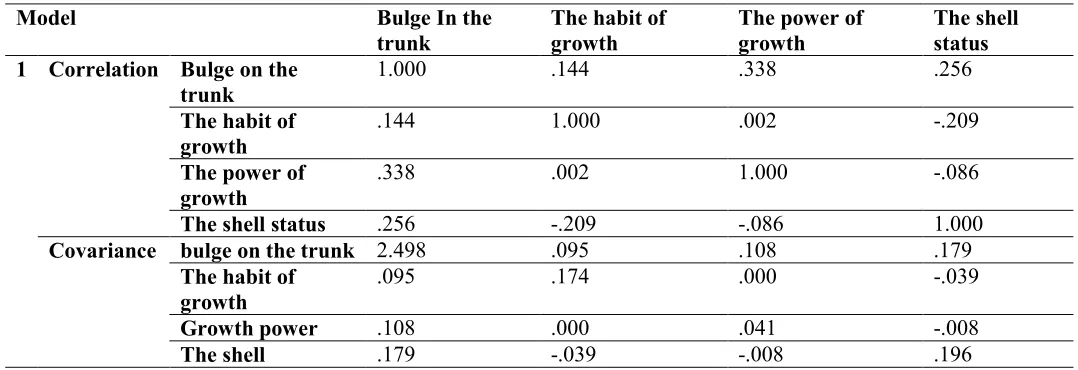
Table 12
Correlation matrix of regression coefficients
Model Bulge In the
trunk
The habit of growth
The power of growth
The shell status 1 Correlation Bulge on the
trunk
1.000 .144 .338 .256
The habit of growth
.144 1.000 .002 -.209
The power of growth
.338 .002 1.000 -.086
The shell status .256 -.209 -.086 1.000
Covariance bulge on the trunk 2.498 .095 .108 .179
The habit of growth
.095 .174 .000 -.039
Growth power .108 .000 .041 -.008
Research Article ISSN 2250-0480 VOL 7/ ISSUE 3/JULY 2017
L-22
Life Sciences Plant Sciences Table 13
Predicted values and residuals
MIN MAX Mean SD number
The predicted values 4.5005 7.3263 6.1754 .84282 19
Remained -1.06230 1.02196 .00000 .55366 19
The predicted residuals -1.987 1.365 .000 1.000 19
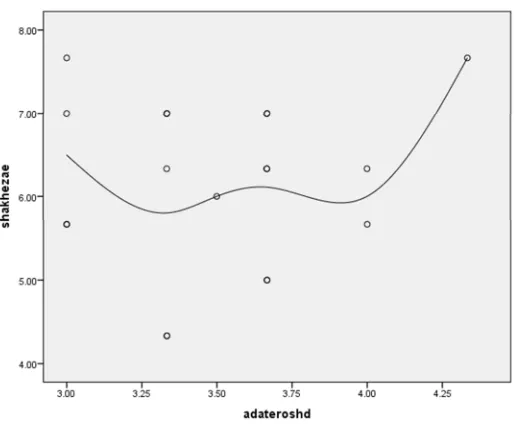
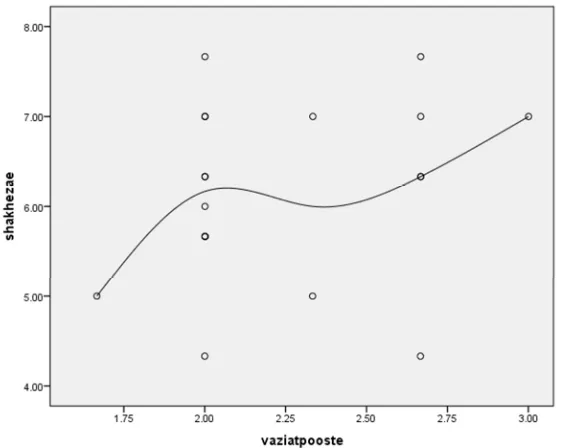
The above table show minimum, maximum, mean and standard deviation of the predicted values. The charts 1 to 4 shows the distribution of the shoot proliferation to the variables of the power of growth, the habit of growth, the shell status and the bulge of the trunk. It is clear that with increasing
growth vigor, the growth habit and shell shooting status increases, but the bulge of the trunk has the reverse relationship with shoot proliferation and by increasing the bulge of the trunk, the shoot proliferation is reduced.
The power of growth
Figure 1
Diagram of power distribution and shoot proliferation.
The habit of growth
Figure 2
Research Article ISSN 2250-0480 VOL 7/ ISSUE 3/JULY 2017
L-23
Life Sciences Plant Sciences
The status of shell
Figure 3
The graph of the distribution of shell status and the proliferation
The bulge of trunk
Figure 4
Research Article ISSN 2250-0480 VOL 7/ ISSUE 3/JULY 2017
L-24
Life Sciences Plant Sciences Figure 5
Histogram of residuals and comparison with the normal distribution
Figure 6
Chart P-P of residuals
Figure 6 is a graph of the remaining of residues and since the residuals are almost on a straight line has a normal distribution. From Figure 5 it can be easily understood that residuals are normally distributed.
DISCUSSION
AND
CONCLUSION
In this paper, compares the morphological, physiological types of native pear cultivars were Sardasht. Firstly, variance analysis was done for chemical traits (PH, EC, TSS, TA and whole sugar). Biochemical traits of all types of pear
Research Article ISSN 2250-0480 VOL 7/ ISSUE 3/JULY 2017
L-25
Life Sciences Plant Sciences
internodes with the position of bud growth and size of bud support.as well as the correlation was meaningful between the number of lenticels with the size of bud support and correlation between the position of growth and with the size of bud support was significant. In lamina of leaf, the correlation between the mode of the branch and margin cut, between the lengths with the ripple of the longitudinal axis and also between widths with the ripple of length axis, was significant. In biochemical traits correlation between pH and total sugar is significant. From hierarchical clustering analysis using the Euclidean distance in the morphological, physiological and biochemical types were identified all types of native Pear that the native pear genotypes can be divided into 6 clusters. The dendrogram graph indicates this result. Multiple linear regression in the traits of fruit was performed by the forward method and in this method, three variables of the state of the tail to the fruit axis, meat texture, and symmetry in longitudinal section, in three phases gained the necessary criteria for entering to the models. In all three models, the regression was significant and the variables well justified the changes. Also, the residuals were normally distributed. Multiple linear regression in the traits of the tree was performed
with entering method.in this method the regression was significant and the variables of power growth, growth habit, a bulge of the trunk and the status of the shell was entered into the model at %5 level. According to the distribution charts, three variables of the power of growth, growth habit and the status of shell had the direct relationship with branch generation and bulge of the trunk had the reverse relationship with branch generation. In this model the residual regression is normal. According to obtained results from variance analysis of biochemical traits and comparing mean, correlation among all morphological and physiological traits, dendrogram of all the attributes and multiple regression of fruit characteristics, we can conclude that there is very difference in the morphological and physiological traits of 8 genotype of native pear and in terms of dendrogram and the most studied areas are divided into 6 groups and we can say that the diversity is very high and have large numbers and enormous genetic diversity. Chart analysis and dendrogram obtained from cluster analysis have shown 8 native genotype pear and the overall key traits of instruction nicely able to separate and distinct different points of pear native tree.
REFERENCES
1. Mozaffari AS. Identify pears southern part of the province. Master's thesis gardening. Tabriz University. 2008; 87.
2. Davari Nejad GH, Hassanpour H, Azizi M, and Sgahriaree F. Investigation on the possibility of reducing graft incopatibility in some Iranian pear cultivars on Quince A by inter-stocks.Agriculture sciences & technology journal. 2007; 21 (1): 45-55. 3. Haji tagilou R, Asghari M, And Jalili M, R.
Effect of Chitosan and Salicylic acid in grape berries. Master's thesis Horticulture, Faculty of Agriculture, Urmia University. 2009; 100: 34-56.
4. Nee CC, Tsai CH, and Anstine DD. Asian pears germplasm future trends and current research in the industry. Acta Hort. 2002; 587: 61-69.
5. Rahemi M, Akbari H. The effects of thermal treatment and packaging on fruit quality during storage and Iranian Horticultural Science and Technology Journal. 2004; 4(3-4): 94-83.
6. Sabeti H. Trees and Shrubs of Iran. Yazd University Publications (Second Edition), Yazd, Iran. 1994; 210-211. (In Persian). 7. Sadeghi L, Abdollahi H, and Fakhraee
Lahiji M. National Guideline for the Conduct of Tests for Distinctness, Uniformity and Stability in Pear. Seed and Plant Certification and Registration Institute. 2008; 37: 45-56. (In Persian). 8. Sharifani M, Hasani S, Ahmadi M, and
Shah Mohammadi H. Evaluation of reproductive traits, morphologic and genetic diversity in Iranian wild pear cultivar Proceedings of the 4th Iranian Horticultural Sciences Congress, Mashhad University Mashhad, Iran. 2005; 19. (In Persian). 9. Zamani A, Attar F, and Maroofi H. A
synopsis of the genus Pyrus (Rosaceae) in Iran. Nordic Journal of Botany. 2012; 30: 310-312.