JIEM, 2010 – 3(3): 447-493 – Online ISSN: 2013-0953 Print ISSN: 2013-8423
Lean process management implementation through enhanced
problem solving capabilities
Perumal Puvanasvaran
1, Hamdan Megat
2, Tang Sai Hong
3, Muhamad Mohd Razali
1, S
Hamouda Abdel Magid
41
University Technical Malaysia Melaka (MALAYSIA);
2University Pertahanan National Malaysia
(MALAYSIA);
3University Putra Malaysia (MALAYSIA);
4Qatar University (QATAR)
Received January 2009
Accepted November 2010
JIEM, 2010 – 3(3): 447-493 – Online ISSN: 2013-0953 Print ISSN: 2013-8423
among its employees while implementing the lean process management there. Although,
the PDS can be implemented throughout the organization, if it is implemented in a
particular department in an organization, it will be feasible to study and analyze its
effectiveness in-depth. So, this study documents and analyzes the implementation of Lean
process in the Kitting Department of the aerospace company, ABC Company. Qualitative
and quantitative measures were also used to document the case study. The outcome of the
people development system needs to be measured to understand its value in developing
the problem solving capabilities among the employees. Only with developed and equipped
employees, the Kitting Department can reduce its wastages, optimize its performance and
thereby play a crucial role in making ABC Company a world class organization. As
pertinent results of the PDS implementation, in general Kitting Department successfully
achieved to meet their Department Key Performance Indicator and particularly the
employees’ are also improve by practicing good lean behaviors and skill and knowledge in
using lean tools which lead to better leanness level by improving employees’ problem
solving capabilities in eliminating waste. On the whole, the lean process management and
the resultant PDS is having positive applications, and importantly could also have positive
applications in the future as well.
Keywords: lean process management, people development system, problem solving
capabilities
1 Introduction
JIEM, 2010 – 3(3): 447-493 – Online ISSN: 2013-0953 Print ISSN: 2013-8423
constituted of employees from different backgrounds, culture, educational qualifications, skill level and attitude. Inside the organization, these workers will normally be apportioned into different departments for better arrangement or streamlining of work. These departments, which make up an organization, only play an omnipresent and crucial role in the proper and effective functioning of the organizations, by adopting various feasible and effective strategies including approaches like the lean management approach. That is, with every organization wanting to expand their reach and make an imprint in various markets, there will be enough opportunities for it, to initiate that expansion drive.
Thus, when the organization has enough opportunities, it can set targets and formulate various strategies to achieve those targets. Along with the formulation of new targets and strategies, organizations also have to initiate changes in its overall functioning. The changes can be brought out both by the internal and external environment of the organizations. This is where the approaches like lean management come into the picture. And the key aspect is, the organizations and its employees will or should be able to adapt or orient themselves towards the targets and should also be in sync with the lean process management. Therefore every organization’s survival and success hinges on how the organization has been able to adapt to the changes as part of the lean process management in its functioning as well as the changes that might keep happening in the market. Accordingly, formulating and implementing important strategies including lean management and the resultant changes, to guide the employees, are the ‘keys’ that opens the door of success and profit for any organization. The decisions which are needed to be taken inside the organization regarding these aspects have to be taken by the leader and the management team with a lot of care, planning, analysis and feedback.
JIEM, 2010 – 3(3): 447-493 – Online ISSN: 2013-0953 Print ISSN: 2013-8423
2 Literature review
Many industries in today’s competitive and fast moving world have successfully adopted lean manufacturing practices and principles. But, most of these companies are still not what can be considered as a fully lean organization since they have been wasting their valuable resources which could affect their productivity as well as profit. In order to become fully lean, in whatsoever a company must understand lean as a long-term philosophy about the right processes that will produce the right results and added value to the organization, by continuously developing people and partners through continuously solving problems (Liker, 2004).
Actually, as Liker (2004) stated about how organizations should implement the lean process management, there is no exact definition for a fully lean organization. Even though the goal of becoming a fully lean organization can only be reached if the employees are well aligned with the new philosophy. In that case, therefore it is important for an organization to understand and apply all of the practices and principles besides a comprehensive lean thinking, which affects the whole business model as a key and not solely leaner production. This thought process has high chance of eliminating wastes, but the implementation has inbuilt issues.
This is because, as Gagnon and Michael (2003) work suggests, production employees who are not well aligned with a philosophy will exhibit lower levels of desired attitudes and behaviors. Anyhow, since lean thinking requires a great level of employees involvement and change in attitude and behaviors (Gagnon & Michael, 2003), strategic employees alignment plays an important role in the quest to become lean. To ensure employees alignment, it is particularly crucial to have open, honest communication, and delegation of authority. Spear and Bowen (1999) argues that these are necessary for a successful lean implementation due to people or the employees of the organization are the main appreciating assets of an organization after products or services. But, at the same time, they are also the most underutilized resources in many organizations. Although a number of authors, experts, researchers have discussed the lean process management as part of organization centric issues.
JIEM, 2010 – 3(3): 447-493 – Online ISSN: 2013-0953 Print ISSN: 2013-8423
competence, when in the implementing the process there are some of the following reasons as follow as:
• The business is unable to learn and change its behavior (Emiliani, 1998b).
He defined the repeated mistakes of the business as another primary type of waste and argues that, “No doubt, risk the future existence of their entire enterprise as currently governed”.
• In a lean company, Liker (2004) stated that learning continues since lean is
a continuum and not a steady state. Although lean thinking is a buzzword, the lean philosophy, practices and principles offer industry a potential mechanism for improving performance where many lean implementations to date have followed a trial and error approach (Gilgeous & Gilgeous, 1999)
• A lack of direction of planning and adequate project sequencing (Bhasin &
Burcher, 2006)
• Lean concept was viewed as a counter-intuitive alternative to traditional
manufacturing model proposal (Womack, Jones, & Roos, 1990)
• The concept of waste has not been yet effectively extended to the
self-defeating behaviors of individual and group of people in workplace (Emiliani, 1998a), change in employees attitude and behavior (Gagnon & Michael, 2003)
• Lean is seen as an abstract philosophy (Pullin, 2002)
• An organization structure operation flows oriented toward results with
JIEM, 2010 – 3(3): 447-493 – Online ISSN: 2013-0953 Print ISSN: 2013-8423
Cooksey, 1998); honest communication and delegation of authority (Spear & Bowen, 1999).
• Need to improve the productivity of a manufacturing organization with
respect to different market and product mixes (Hilmola, 2005); customer value and market segments (Setijono & Dahlgaard, 2007).
• Absence of practical and detailed model to follow in pursuit of excellence
within manufacturing (Gilgeous & Gilgeous, 1999), holistic logic and management system (Holweg, 2007), and the outcome of dynamic learning process that adopted the practice (Cusumano, 1992).
Although many experts, researchers, authors and the resultant literatures suggests ‘what’ and ‘why’ an organization should incorporate the lean process management into functioning, but fails to short of clearly explaining ‘how’ it should improve the lean process management. Furthermore, past researchers mainly focus on how the individuals can be trained to work efficiently and in a trimmed way, but not as part of a lean process management. Because of these shortfalls, many organizations fail to unlock the infinite potential of their workforce. In that case there will be more overhead, with more layers of management, which in turn could cause slower reaction times in fast changing business. To eliminate all these worst case scenarios, lean process management is the main tool for the organization and its employees. But the problem is, there no clear cut protocols or processes to implement the lean process management.
JIEM, 2010 – 3(3): 447-493 – Online ISSN: 2013-0953 Print ISSN: 2013-8423
3 A proposal for people development system requirements
People Development System involves a range of activities, practices, and procedures that needs to be implemented by the management to empower the company’s people. As mentioned above, it will only provide the direction for the development of people and helps the organization to implement all its plans, strategies, etc, including the lean process. Among the many practices that will be included in the People Development system, few are employee training and programs for the formation of teams within the departments including self-directed work groups. The system also reduces the ‘red tapes’ or biased or unethical behaviour that will be visible in many traditional organizations. Instead, the system will develop the employees and make them part of all the important practices that takes place inside an organization including the decision making practices as part of the lean process management.
JIEM, 2010 – 3(3): 447-493 – Online ISSN: 2013-0953 Print ISSN: 2013-8423
This can only happen with the deeper involvement of each and every employee in an organization. By the part of the employee, each one should understand for what they have been hired and thereby understand their specific roles, and provide the best services by developing themselves. Beside, the management from each department should also play a role in the development of their employees. All the departments from production, engineering, maintenance, human resources, finance, quality assurance to support services, need to identify and develop the people to achieve the goal of being a lean world class manufacturer.
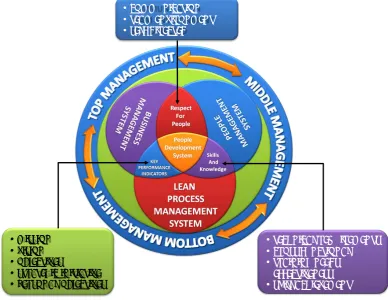
Figure 1. “Framework for enhancing the problem solving capabilities of the employees”. Source: Puvanasvaran et al. (2008)
As part of the training programs, practices such as coaching and mentoring should also be incorporated to develop the employees and make perfectly suitable for the organization’s lean process. “Coaching and Mentoring can be used to effectively unlock the potential that already exists within any organization. The organization’s most valuable resource is its people or put more concretely, the knowledge and passion that resides within the hearts and minds of its people introducing coaching and mentoring within any organization, will reap the benefits to the organization”
• MISSION • VISION • OBJECTIVES
• STRATEGIC INITIATIVE • PERSONAL OBJECTIVES
• COMMUNICATION
• TEAM ENVIRONMENT
• SELF DIRECTED
• TECHNICAL REQUIREMENTS
• CROSS FUNCTIONAL
• TRAINING NEEDS
EFFECTIVENESS
JIEM, 2010 – 3(3): 447-493 – Online ISSN: 2013-0953 Print ISSN: 2013-8423
associated practices will only prepare of employees for the lean process.
The proposed PDS will be use by 3 elements, as stated in the Figure 1, such as Key Performance Indicator, Skill and Knowledge and Respect for People. As illustrated in the figure, the important aspects of lean process, People Management and Business management can be optimized by the common factor of PDS. To compliment PDS role in the three processes, three more elements need to be taken care. The three elements of Key Performance Indicator, Skill and Knowledge and Respect for People should be handled effectively and positively to develop a strong PDS, and thereby lead the processes to a successful end.
3.1 Key Performance Indicator (KPI)
Key Performance Indicators, also known as KPI is a set of financial and non-financial measurements, set by organizations to measure the progress toward organizational goals. That is, after the organization sets its mission, identifies its stakeholders, and defines its goals, it needs to measure the progress it is making toward those goals. This is where KPI comes into the picture and helps the organization to measure the progress. KPI, set by the organizations, during lean process management enables workforce to focus on company’s Mission, Core Value, Vision, Objective, Strategies, Strategic Initiative and Personal Objective. It is one of the crucial factors for people development system. This will align the total workforce of the company to follow one common goal (with the set objectives made visible). At each stage of progress towards the goals, the employees’ performance can be measured based on KPI. Based on the measurement, the employees’ performance can be optimized further, if the performance falls short or if the performance is better, it can be made consistent. So, at each stage, the KPI has its own portion of contribution towards the overall target. The accumulation of success during each stage will reflect in the overall performance of the company towards the set goal, and that overall performance is the cumulative performance of the employees.
3.2 Respect for people
JIEM, 2010 – 3(3): 447-493 – Online ISSN: 2013-0953 Print ISSN: 2013-8423
sense, the employees should not be forced to participate in the lean process management. Instead, they should be made aware of the procedures as part of the lean process management and, importantly their views and suggestions should also be elicited. So, considering the crucial role, the employees will play in the lean process, they should be given ‘respect’. Making the employees’ aware, eliciting their views and thereby respecting them will surely make them contribute optimally to the lean process management. In order to measure the employees’ commitment, leanness level of the company and importantly the perception of employees on lean practices, questionnaire based survey with likert-type scale can be used. Apart from this aspect, the problem solving capabilities of employees also can be measured by counting the number of ideas generated by an employee. As discussed earlier, employees’ or people’s optimal contribution to the lean process management can only make it a success and because of this undisputable fact, the people should be respected through various ways.
3.3 Skills and knowledge
JIEM, 2010 – 3(3): 447-493 – Online ISSN: 2013-0953 Print ISSN: 2013-8423
to measure the skill and knowledge level of employees regarding the lean process. For example, a spider web chart with rating of 1 (beginning to introduce) to 5 (practice with excellent) can also be used.
4 Methodology
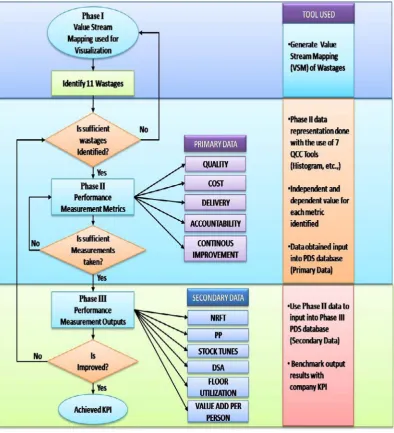
The method of data collection was by action research at kitting department at GLC. To implement the people development system, the researcher was attached with the pilot team throughout the study. Basically, the flowchart in figure 2 shows the overall execution for PDS implementation. Phase I will begin by generating the Value Stream Mapping (VSM) of current state by Value Stream Manager with the help of Functional Manager. VSM was used to show the clear and the overall picture of the current state and not as an assessing tool for wastages. The current state was developed with the help of Value Stream Manager and Functional Manager. The VSM will be created by using information such as run ratios, scrap rates, manpower, work hours & schedules, changeover times, tool change times, and inventory level will be keyed into PDS database. Here value added and non-value added activities will be identified by proposing the future non-value stream mapping. Wastage identified will be categorized under the QCDAC principles.
Each metric will be monitored. Independent & Dependent Variables will be identified for monitoring purposes. Data will be collected manually, and will be inserted into the PDS database. After information has been keyed in into the database, graph will be generated which will become the visual indicator for communication and discussion purpose. As an example, we take a metric of scrap measuring mechanism. This metric will measure the scrap rate produced by the production line. Data of scrap will be collected and graph will be generated for the week and posted onto the PDS board. Brainstorming and problem solving activities will take place among the employees to encounter and discuss the waste occurred.
JIEM, 2010 – 3(3): 447-493 – Online ISSN: 2013-0953 Print ISSN: 2013-8423
achievements. The details of execution implementation of People Development system is explained in following section.
Figure 2. “Flow chart on methodology execution for PDS implementation”. Source: Puvanasvaran et al. (2008)
5 Implementation results and discussion
5.1 Future State Value Stream Mapping (FSVSM)
JIEM, 2010 – 3(3): 447-493 – Online ISSN: 2013-0953 Print ISSN: 2013-8423
reduced using continuous improvement activities. Below are the improvements been made for the future state VSM:
Thawing to cutting process
Based on the future state VSM, figure 3, a section between thawing to cutting have been chosen. Upon analysis, high travel time has been noticed. Initial travel time is around 7.25min.
Thawing Cutting
Cycle time 62 Mins Cycle time 160 Mins
No. of panels 2 Unit No. of panels 2 Unit
No. of shifts 2 Unit No. of shifts 2 Unit
Working hrs shift 505 Mins
I
Working hrs shift 505 MinsNormal break time 75 Mins Name Normal break time 75 Mins Av. working hrs 465.8 Mins 400 Unit Av. working hrs 465.8 Mins
No. of employer 1 Staff No. of employer 1 Staff
No. of defects 0 Unit No. of defects 0 Unit
No. of inspector 0 Unit No. of inspector 1 Unit
No. of rework 0 Unit No. of rework 0 Unit
Mach. reliability 0 % Mach. reliability 0 %
Inventory 0 Unit Inspection time 0 Mins
EPE time 1440 Mins Travel time 7.25 Mins Waiting time 300 Mins Changeover time 0 Mins Setup time 0 Mins 5s time 0 Mins Shift change time 0 Mins Rework time 0 Mins
Figure 3. “Travel time wastages (Thawing to Cutting)”.
JIEM, 2010 – 3(3): 447-493 – Online ISSN: 2013-0953 Print ISSN: 2013-8423
machine feeder. Travel time has been reduced from 7.25 min to 3 min. 4.25 min of motion waste have been removed from the VSM.
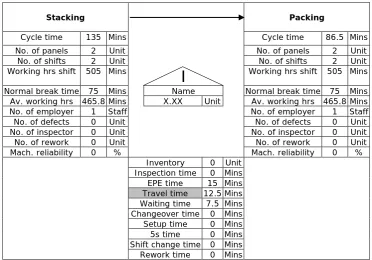
Stacking to packing process
Based on the future state VSM, Figure 4, a section between thawing to cutting has been chosen. Upon analysis, high travel time has been noticed. Initial travel time is around 12.25min.
Stacking Packing
Cycle time 135 Mins Cycle time 86.5 Mins
No. of panels 2 Unit No. of panels 2 Unit
No. of shifts 2 Unit No. of shifts 2 Unit
Working hrs shift 505 Mins
I
Working hrs shift 505 MinsNormal break time 75 Mins Name Normal break time 75 Mins Av. working hrs 465.8 Mins X.XX Unit Av. working hrs 465.8 Mins No. of employer 1 Staff No. of employer 1 Staff
No. of defects 0 Unit No. of defects 0 Unit
No. of inspector 0 Unit No. of inspector 0 Unit
No. of rework 0 Unit No. of rework 0 Unit
Mach. reliability 0 % Mach. reliability 0 %
Inventory 0 Unit Inspection time 0 Mins
EPE time 15 Mins Travel time 12.5 Mins Waiting time 7.5 Mins Changeover time 0 Mins Setup time 0 Mins 5s time 0 Mins Shift change time 0 Mins Rework time 0 Mins
Figure 4. “Travel time wastages (stacking to packing)”.
To overcome this problem, a solution have been proposed which is after each nesting process, the operator needs to walk all the way to packing area and return again once delivery has been done. This process is done a few times. The solutions is to allocate two trolley with inventory whereby operator can simply place the finish nesting into the trolley and wait until the whole trolley is full with nesting then only proceed to packing area.
Calculations New solutions
10 sec per trip (5 sec go and 5 sec back) for 75 times
= 750 sec or 12.5 min
30 sec per trip (15 sec go and 15 sec back) x 10 times
JIEM, 2010 – 3(3): 447-493 – Online ISSN: 2013-0953 Print ISSN: 2013-8423
This is to reduce stacking process due to now stacking been done on the trolley without the operator moving around. This solution have caused 7.5 min of waste been removed.
Packing to paperwork process
Based on the future state VSM, figure 5, a section between thawing to cutting have been chosen. Upon analysis, high travel time has been noticed. Initial waiting time is around 210min.
Packing Paper work
Cycle time 86.5 Mins Cycle time 110 Mins
No. of panels 2 Unit No. of panels 1 Unit
No. of shifts 2 Unit No. of shifts 2 Unit
Working hrs shift 505 Mins
I
Working hrs shift 505 MinsNormal break time 75 Mins Name Normal break time 75 Mins Av. working hrs 465.8 Mins X.XX Unit Av. working hrs 465.8 Mins
No. of employer 1 Staff No. of employer 1 Staff
No. of defects 0 Unit No. of defects 0 Unit
No. of inspector 0 Unit No. of inspector 1 Unit
No. of rework 0 Unit No. of rework 0 Unit
Mach. Reliability 0 % Mach. reliability 0 %
Inventory 0 Unit Inspection time 0 Mins
EPE time 20.3 Mins Travel time 11.25 Mins Waiting time 210 Mins Changeover time 0 Mins Setup time 0 Mins 5s time 0 Mins Shift change time 0 Mins Rework time 0 Mins
Figure 5. “Travel time wastages (packing to paperwork)”.
To overcome this problem, a solution have been proposed, instead of using small packing machine for packing, modified the length of jaw to a longer length so that no multiple packing is required, this actions reduced waiting time from 210 min to 100 min, a reduction of 110 min of waste is been removed.
Paperwork to delivery process
JIEM, 2010 – 3(3): 447-493 – Online ISSN: 2013-0953 Print ISSN: 2013-8423
Paper work Delivery
Cycle time 110 Mins Cycle time 9.3 Mins
No. of panels 1 Unit No. of panels 1 Unit
No. of shifts 2 Unit No. of shifts 2 Unit
Working hrs shift 505 Mins
I
Working hrs shift 505 MinsNormal break time 75 Mins Name Normal break time 75 Mins Av. working hrs 465.8 Mins X.XX Unit Av. working hrs 468.5 Mins
No. of employer 1 Staff No. of employer 1 Staff
No. of defects 0 Unit No. of defects 0 Unit
No. of inspector 1 Unit No. of inspector 0 Unit
No. of rework 0 Unit No. of rework 0 Unit
Mach. reliability 0 % Mach. Reliability 0 %
Inventory 0 Unit Inspection time 4 Mins
EPE time 15.8 Mins Travel time 3.58 Mins Waiting time 1440 Mins Changeover time 0 Mins Setup time 0 Mins 5s time 0 Mins Shift change time 0 Mins Rework time 0 Mins
Figure 6. “Travel time wastages (paperwork to delivery)”.
To overcome this problem, a solution have been proposed, each panel will have multiple of paperwork that must be approved. This procedure is time consuming. Engineering department have done split and batching paperwork to reduce time involve in approving. This solution is estimated to save approving time from 1440 min to 720 min, thus removing 720 min of waste time. From table 1, a conclusion can be made; total VA no changes been made, percentage of VA has been increased from 5.19% to 5.62% which saw an improvement of 0.43%. Lead time and total NVA time have been reduced also.
BEFORE AFTER
Total VA 562.80 min 562.80 min
Percentage of VA 5.19% 5.62%
Lead time 11415 min 10574 min
Total NVA 10853 min 10011 min
Table 1. “Current vs. Future State VSM values”.
5.2 Primary data
JIEM, 2010 – 3(3): 447-493 – Online ISSN: 2013-0953 Print ISSN: 2013-8423
2007 till Jun 2007, and after improvement data have been allocated from July 2007 till December 2007. Below are the improvement trends that can be seen for each and every Performance Measurements (PM) starting from Primary Data.
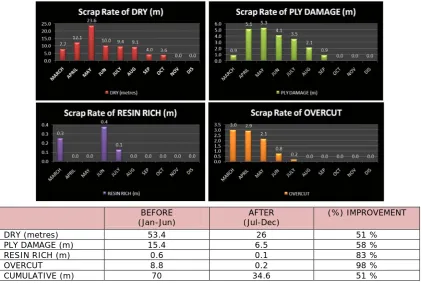
Scrap improvement measuring mechanism
Figure 7 shows the overall percentage of improvement for Scrap Measuring Mechanism for before and after improvement from machine DCS 1, DCS 2, DCS 3 and S91 where the materials scrapped due to Ply Dry, Ply damaged, Resin Rich and Overcut issues are shown in Figure 7 as Overall Scrap Rates each issues. Scrap is measure by the unit meter (m). There are noticeable positive improvements from those machines which are ply damage and ply dry. Both types of scrap have been an issue for kitting department, they do realize that counter-measure need to be done but after so long all their ideas doesn’t seem to help them, until PDS is been implemented.
BEFORE
(Jan-Jun) (Jul-Dec) AFTER (%) IMPROVEMENT
DRY (metres) 53.4 26 51 %
PLY DAMAGE (m) 15.4 6.5 58 %
RESIN RICH (m) 0.6 0.1 83 %
OVERCUT 8.8 0.2 98 %
CUMULATIVE (m) 70 34.6 51 %
Figure 7. “Overall Scrap Measuring Mechanism Graph”.
JIEM, 2010 – 3(3): 447-493 – Online ISSN: 2013-0953 Print ISSN: 2013-8423
ply damage during cutting have been solved by frequent machine maintenance. Overcut problems have also been solved entirely by frequent machine maintenance as the cutting tolerance has been fixed. As a conclusion to scrap performance measurement, it was proven that those improvements have been made. This is true because before PDS has been implemented, there is no scrap monitoring. Scrap are being produced all the time, but are hidden because scrap value are not turned into value that are quantitative such as value for money.
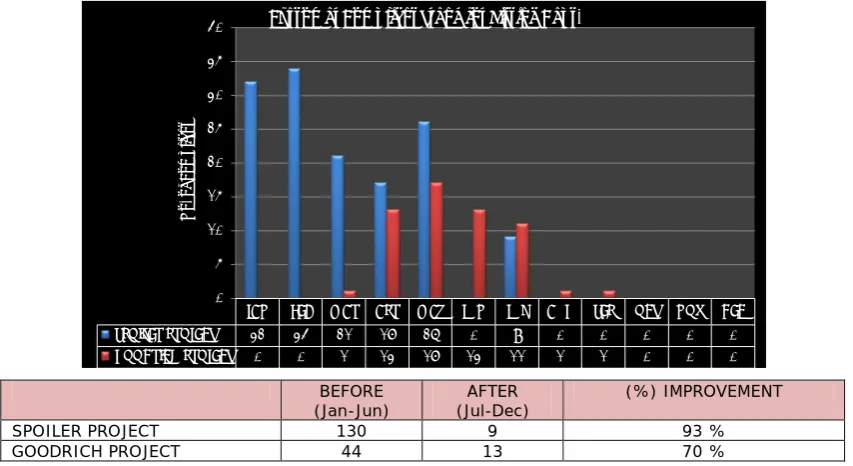
Customer complaint measuring mechanism improvement
There are mainly two categories of customer complaint which are Spoiler and
Goodrich projects. As for spoiler project, 1st half of the year shows that customer
complaint from lay-up department are as high as 130 complaints and for Goodrich
project 44 complaints have been reported. The 2nd half showed the complaint
dropped dramatically, for Spoiler project only 9 complaints and Goodrich only 13 complaints. Customer complaint have been a major issue for kitting department, they customer which is lay-up always sending complaint saying that material is missing from the final packaging produced by kitting department. Group leader from lay-up can be seen frequently come to kitting department asking for the replacement ply that are missing.
BEFORE
(Jan-Jun) (Jul-Dec) AFTER (%) IMPROVEMENT
SPOILER PROJECT 130 9 93 %
GOODRICH PROJECT 44 13 70 %
Figure 8. “Percentage of improvement for Customer Complaint PM”.
JAN FEB MAR APR MAY JUN JUL AUG SEP OCT NOV DEC
SPOILER PROJECT 32 34 21 17 26 0 9 0 0 0 0 0
GOODRICH PROJECT 0 0 1 13 17 13 11 1 1 0 0 0
0 5 10 15 20 25 30 35 40
N
o.
of
C
om
pl
ia
nt
JIEM, 2010 – 3(3): 447-493 – Online ISSN: 2013-0953 Print ISSN: 2013-8423
The problem occur when stacking is done by operators, human factor involves in calculating the ply quantity, although kitting proved that all the quantity demanded are properly supplied and no missing ply, but the problem still occur when product reach at lay-up. PDS provides counter-measure which is do 100% inspection on produced ply, implement check-list, missing log book are properly placed, and the most successful idea is Just in Time (JIT), each finish product will have its color coded verification notify that the date of the product produced. Lay-up inventory will have no excessive material, and no misused actions such as taking extra ply from the material reservoir due to supply the material just in time, when the product is needed at that time. This is why, figure 8 can showed that 2nd half of the year showing that spoiler project have little complaint, just 9 complaints (93.1%) improvement, which is a high achievement have been made.
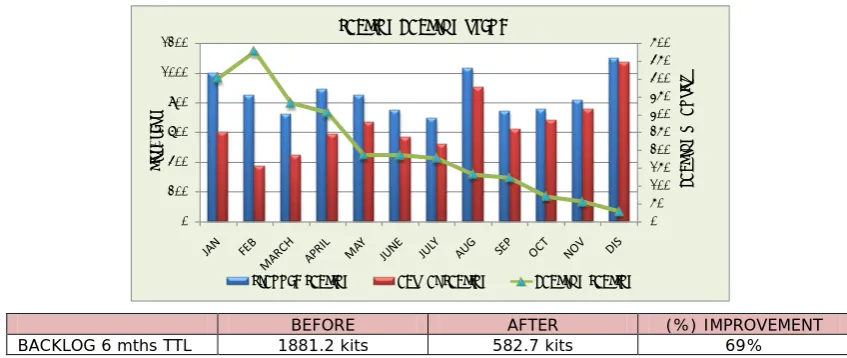
Backlog measuring mechanism improvement
Nesting is a process whereby prepreg are cut into smaller pieces with different shapes and sizes. Each product will have its own nesting to be cut. After the prepreg have undergone the nesting process, the next process is stacking process; here prepreg that have been cut will be arranged according to their kits or sets. The last process it will undergo is the packing process, here kits that have done will be placed into a waterproof plastic bag and will be sealed to prevent moisture from entering the packing. Nesting is a process done by machines while both stacking and packing is done by manually by operators. Figure 9A, 9B, and 9C shows backlog that happened in the three (3) processes. Backlog is the quantity that cannot meet the demand.
0 50 100 150 200 250
0 200 400 600 800 1000 1200 1400 1600
BA
CK
LO
G Q
UA
N
TI
TY
PLY
NESTING BACKLOG TREND
JIEM, 2010 – 3(3): 447-493 – Online ISSN: 2013-0953 Print ISSN: 2013-8423
BEFORE AFTER (%) IMPROVEMENT
BACKLOG 6 mths TTL 494 ply 155.4 ply 68%
Figure 9A. “Percentage of improvement for nesting backlogs”.
BEFORE AFTER (%) IMPROVEMENT
BACKLOG 6 mths TTL 616.9 KITS 226.3 KITS 63%
Figure 9B. “Percentage of improvement for stacking backlogs”.
BEFORE AFTER (%) IMPROVEMENT
BACKLOG 6 mths TTL 1881.2 kits 582.7 kits 69%
Figure 9C. “Percentage of improvement for packing backlogs”.
Nesting process shows that after machine maintenance have been done frequently, less stop time have been recorded for all 4 machines. This is true for the OEE stop time, the stop time have been reduced in par with maintenance of machines. Nesting process shows positive improvement which 494 nesting are recorded and after PDS is been implemented to reduce backlog, the value drops to only 155.4 nesting, this have caused an improvement of 68%. Stacking and Packing process also shows the improvement trend of 63% and 69 % on each.
0 20 40 60 80 100 120 140 160
0 200 400 600 800 1000 1200
BA
CK
LO
G Q
UA
N
TI
TY
KI
TS
/ S
ETS
STACKING BACKLOG TREND
PLANNED STACKING ACTUAL STACKING
0 50 100 150 200 250 300 350 400 450 500
0 200 400 600 800 1000 1200
BA
CK
LO
G Q
UA
N
TI
TY
KI
TS
/ S
ETS
PACKING BACKLOG TREND
JIEM, 2010 – 3(3): 447-493 – Online ISSN: 2013-0953 Print ISSN: 2013-8423
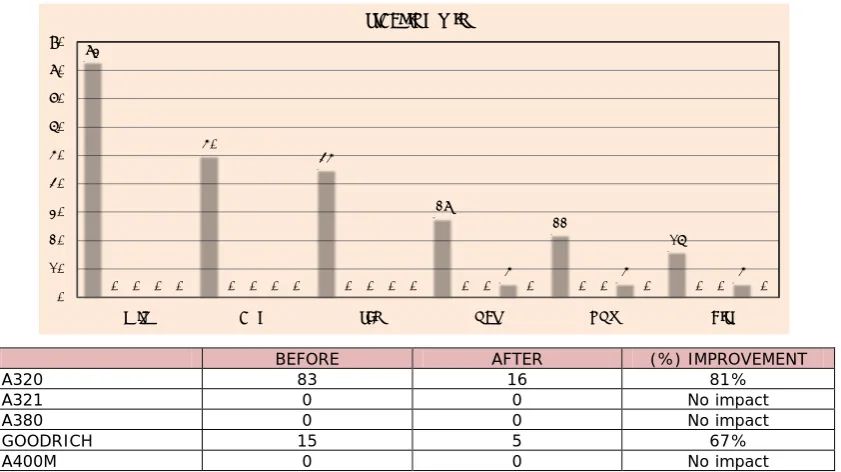
WIP measuring mechanism improvement
Figure 10, clearly shows that no data have been collected from Jan 2007 till June 2007. The reason why no data has been recorded is because WIP measuring
mechanism only started from July 2007. During the 1st six (6) months, kitting
department do not monitor their WIP level in neither stacking or packing processes. These causes high overtime level due to the need of reducing those WIP inventory. After PDS has been implemented, the need of monitoring the WIP has been highlighted.
BEFORE AFTER (%) IMPROVEMENT
A320 83 16 81%
A321 0 0 No impact
A380 0 0 No impact
GOODRICH 15 5 67%
A400M 0 0 No impact
Figure 10. “Percentage of improvement for Stacking WIP PM”.
During each shift before the shift ends; team leader will count the WIP inventories that are left at the stacking and packing process. During monitoring, only two projects were discovered that have contributed to WIP, which is A320 and Goodrich project. This is predictable as these are the most common two projects that are produced. The company do not receive constant demand from their customer monthly, this have caused such high WIP for Goodrich project from month October till December. As a summary, PDS have highlighted to kitting department that WIP monitoring is crucial and that is why this WIP measuring system has been set up and the impact will be less WIP, reduced operating cost, reduce inventory, reduce overtime, and on-time delivery. Rather than stacking WIP, there is only S91 machine that contributing the WIP, while packing WIP happens at all four
83
50
45
28
22
16
0 0 0 0 0 0 0 0 0 0 0 0 0 0 5 0 0 0 5 0 0 0 5 0
0 10 20 30 40 50 60 70 80 90
JULY AUG SEP OCT NOV DIS
JIEM, 2010 – 3(3): 447-493 – Online ISSN: 2013-0953 Print ISSN: 2013-8423
machines. This is because packing done by operators and the cycle time different from each packing project. Human error factor also contributes to the WIP. Miscalculation is one of the issue faced by packing, this causes trackback time losses to recover those missing kits from stacking. This problem also will contribute to WIP. The same stacking WIP situation, as shown on figure 11, will repeat as WIP for Goodrich when the demand is high.
DCS 1 Base
(JULY) (DEC) End IMPROVEMENT (%) DCS 2 (JULY) Base (DEC) End IMPROVEMENT (%)
A320 1003 169 83% A320 391 64 84%
A321 10 6 40% A321 0 0 0%
A380 0 0 0% A380 9 0 100%
GOODRICH 36 10 72% GOODRICH 80 13 84%
A400M 0 0 0% A400M 12 0 100%
DCS 3 Base
(JULY) (DEC) End IMPROVEMENT (%) S91 (JULY) Base (DEC) End IMPROVEMENT (%)
A320 543 141 74% A320 84 20 76%
A321 0 0 0% A321 0 0 0%
A380 0 0 0% A380 0 0 0%
GOODRICH 45 15 67% GOODRICH 59 5 92%
A400M 0 0 0% A400M 0 0 0%
Figure 11. “Percentage of improvement for Packing WIP PM”.
As a summary, PDS have highlighted to kitting department that WIP monitoring is crucial and for this WIP measuring have been set up and the impact will be less WIP, reduced operating cost, reduce inventory, reduce overtime, and on-time delivery.
PACKING WIP MEASURING MECHANISM
0 200 400 600 800 1000 1200
JULY AUG SEP OCT NOV DIS
PL
Y
MONTH DCS 1 PACKING WIP
A320 A321 A380 GOODRICH A400M 0 50 100 150 200 250 300 350 400 450
JULY AUG SEP OCT NOV DIS
K IT S/ SET S MONTH DCS 2 PACKING WIP
A320 A321 A380 GOODRICH A400M 0 100 200 300 400 500 600
JULY AUG SEP OCT NOV DIS
K IT S/ SET S MONTH DCS 3 PACKING WIP
A320 A321 A380 GOODRICH A400M 0 10 20 30 40 50 60 70 80 90
JULY AUG SEP OCT NOV DIS
K IT S/ SET S MONTH S91 PACKING WIP
A320
A321
A380
GOODRICH
JIEM, 2010 – 3(3): 447-493 – Online ISSN: 2013-0953 Print ISSN: 2013-8423
Attendance measuring mechanism improvement
Figure 12 shows before PDS was implemented, the attendance before Jun 90.75% is and after PDS was implemented, the attendance is seen with 98.6% improvement. This cause a positive improvement of 7.96%, which clearly shows a trend, which is after PDS is been implemented, absenteeism is Low from July. Problem such as emergency leave, unpaid leave and annual leave are considerably high before Jun. PDS is aimed to increase people involvement in problem solving and attendance trend chart shows a positive value which can be said that people in kitting department are not resisting the change especially, the operators.
BEFORE AFTER (%) IMPROVEMENT
Man hours 90.75% 98.60% 7.96%
Figure 12. “Attendance Measuring Mechanism Trend and Improvement Percentage”.
As for this, kitting department has started to implement few schemes by rewarding system to increase the attendance rate and motivation rate of its employee. Suggestions are made on giving token with certificate notifying that an employee has achieved its outstanding performance. Suggestion is also been made to increase allowance to RM50 per month. Other countermeasure applied is to limit two leave only per day by kitting staff.
Overtime measuring mechanism improvement
Because of the positive improvement in the absenteeism aspect at the Kitting Department, the overtime levels are obviously controlled as shown in Figure 13.
JAN FEB MARCH APRIL MAY JUNE JULY AUG SEP OCT NOV DEC Standard Man Hours 6925.3 6185.8 4963.8 4646.9 7357.3 6177 5866.3 8649.6 5797 6707.1 7122.8 7122.8 Actual Man Hours 5825.3 5413.6 4462.95 4250.24 6677 5609.7 5500.5 8550.91 5675.7 6628.18 7022.3 7022.3 Man Hours (%) 84.1 87.52 89.91 91.46 90.75 90.81 93.76 98.86 97.9 98.82 98.6 98.6
Company KPI (92%) 92 92 92 92 92 92 92 92 92 92 92 92
75.0 80.0 85.0 90.0 95.0 100.0
0.0 1000.0 2000.0 3000.0 4000.0 5000.0 6000.0 7000.0 8000.0 9000.0 10000.0
Per
cen
ta
ge
(%
)
Ax
is
Ti
tle
JIEM, 2010 – 3(3): 447-493 – Online ISSN: 2013-0953 Print ISSN: 2013-8423
Overtime are caused by WIP and also backlog. Kitting Department has set their 2007 KPI goals for overtime to 12%. Before PDS had been implemented, the overtime percentage for first 6 months was 62% and after it is being implemented, the rate dropped to 38% for following 6 months. This due to the implementation of WIP and backlog monitoring by PDS. Both the measuring mechanisms have highlighted the Kitting Department on their problem, so that each day, they will reduce the WIP and backlog as much as possible. This has contributed to the positive improvement of the overtime to 23%.
BEFORE AFTER (%) IMPROVEMENT
OVERTIME 62% 38% 23%
Figure 13. “Percentage of improvement for Overtime PM”.
OEE measuring mechanism improvement
The Company has implemented their Total Productive Maintenance (TPM) to all machines that are available. The problems are that kitting department OEE calculations are different from OEE calculation from SDD which is a department that are responsible to create a standard OEE for the whole company. PDS have adopted OEE calculations that are used widely around the globe. To achieve acceptable OEE standard, the OEE follow the standard of 85% and above for world class standard. Based on the percentage of improvement as in Figure 14, all four machines haven’t reached world class standard yet as machine DCS 1 with 83%, DCS 2 machine with 82%, DCS 3 machine 83% and lastly S91 machine with 80%. Currently the level is above satisfied level only, more improvement need to be done to improve the utilization of each machine. In terms of percentage of improvement, all four machines show positive improvement after PDS was
JAN FEB MARCH APRIL MAY JUNE JULY AUG SEP OCT NOV DEC Standard Man Hours 6925.3 6185.8 4963.8 4646.9 7357.3 6177 5866.3 8649.6 5797 6707.1 7122.75 7122.75 Overtime Man Hours 809.5 706.5 652 452.5 604.0 458 391.5 441 267 525 528 474 Overtime (%) 11.69% 11.42% 13.14% 9.74% 8.21% 7.41% 6.67% 5.10% 4.61% 7.83% 7.41% 6.65%
Company KPI (12%) 12 12 12 12 12 12 12 12 12 12 12 12
0.00% 2.00% 4.00% 6.00% 8.00% 10.00% 12.00% 14.00%
0 1000 2000 3000 4000 5000 6000 7000 8000 9000 10000
Ax
is T
itl
e
JIEM, 2010 – 3(3): 447-493 – Online ISSN: 2013-0953 Print ISSN: 2013-8423
implemented whereby machine DCS 1 (15%), DCS 2 (13%), DCS 3 (38%) and S91 (16%) show improvements. In summary, all measuring mechanism indicates positive improvement which can been seen before and after PDS has been implemented in kitting department. Few performance measurements that had never been noticed by kitting department to monitor have been highlighted by PDS to start monitoring. Kitting department has benefited from few performance measurements such as the backlog measuring mechanism and WIP measuring mechanism.
DCS 1 BEFORE AFTER (%)
IMPROVEMENT DCS 3 BEFORE AFTER IMPROVEMENT (%)
PROD TIME
% 67.7 82.8 18% PROD TIME % 45.2 82.9 45%
STOP TIME
% 9.0 8.6 4% STOP TIME % 7.7 7.5 2%
DOWN
TIME % 10.6 8.0 24% DOWN TIME % 9.2 7.5 19%
LOOSES
TIME % 13.3 0.5 96% LOOSES TIME % 5.1 2.0 61%
OEE % 67.6 82.8 18% OEE % 45.2 82.9 45%
DCS 2 BEFORE AFTER (%)
IMPROVEMENT S91 BEFORE AFTER IMPROVEMENT (%)
PROD TIME
% 69.9 82.4 15% PROD TIME % 64.2 80.3 20%
STOP TIME
% 8.7 8.0 8% STOP TIME % 11.2 8.2 27%
DOWN
TIME % 10.4 8.7 16% DOWN TIME % 12.8 9.6 25%
LOOSES
TIME % 11.1 0.9 92% LOOSES TIME % 11.8 1.8 85%
OEE % 69.9 82.4 15% OEE % 64.2 80.3 20%
Figure 14. “Percentage of improvement for OEE PM”.
JAN FEB MAR APR MAY JUN JUL AUG SEP OCT NOV DIS
LOOSES TIME % 46.5 9.5 9.2 3.2 4.9 6.6 1.0 0.4 0.6 1.0 0.0 0.3
DOWN TIME % 7.0 16.6 9.1 12.5 8.8 6.6 8.8 8.8 7.8 7.2 8.8 7.1
STOP TIME % 7.2 9.1 8.2 10.5 9.5 9.5 9.5 9.5 9.5 9.5 8.5 5.4
PROD TIME (OEE %) 39.5 64.8 73.6 74.1 76.8 77.3 80.9 81.7 81.9 82.0 83.0 87.5 0% 10% 20% 30% 40% 50% 60% 70% 80% 90% 100% %
DCS-1 OEE TREND
JAN FEB MAR APR MAY JUN JUL AUG SEP OCT NOV DIS
LOOSES TIME % 46.3 2.4 8.9 3.6 3.2 2 1.9 1.3 0.15 0.5 1.2 0.3
DOWN TIME % 6.5 18.8 9.8 9.8 9.1 8.75 9.3 8.8 8.75 8.0 8.8 8.8
STOP TIME % 7.5 10.5 10.8 7.5 7.5 8.5 7.5 8.5 9.5 8.5 6.4 7.5
PROD TIME (OEE %) 40.6 68.0 70.5 79.6 79.8 80.925 81.0 81.1 81.98 83.0 83.5 83.8 0% 10% 20% 30% 40% 50% 60% 70% 80% 90% 100% %
DCS-2 OEE TREND
JAN FEB MAR APR MAY JUN JUL AUG SEP OCT NOV DIS
LOOSES TIME % 0.0 0.0 10.6 9.1 8.3 2.6 5.9 3.7 1.1 0.0 0.8 0.4
DOWN TIME % 0.0 0.0 26.1 9.8 8.8 10.8 8.0 9.8 8.8 8.8 6.8 3.0
STOP TIME % 0.0 0.0 14.5 12.5 10.5 8.5 7.5 7.5 7.5 7.8 7.5 7.5
PROD TIME (OEE %) 0.0 0.0 48.9 68.9 75.5 78.1 78.7 79.2 82.2 83.8 84.8 88.6
0% 10% 20% 30% 40% 50% 60% 70% 80% 90% 100% %
DCS-3 OEE TREND
JAN FEB MAR APR MAY JUN JUL AUG SEP OCT NOV DIS
LOOSES TIME % 26.0 12.7 10.1 7.7 7.7 6.6 2.6 3.0 2.8 0.3 0.5 1.4
DOWN TIME % 10.8 12.8 17.0 15.8 9.8 10.8 11.0 9.8 8.8 9.6 8.9 9.8
STOP TIME % 7.5 17.5 14.5 10.5 9.5 7.5 9.5 9.5 9.5 7.8 7.5 5.3
PROD TIME (OEE %) 56.0 56.9 58.6 65.8 72.8 75.1 76.5 77.4 79.3 82.5 82.9 83.3 0% 10% 20% 30% 40% 50% 60% 70% 80% 90% 100% %
JIEM, 2010 – 3(3): 447-493 – Online ISSN: 2013-0953 Print ISSN: 2013-8423
5.3 Secondary data
The following discussion is made based on the secondary data, which will be reflected to lean goals set by the customers.
Leans goals (Do it Right First Time)
The main purpose of measurement is to detect the rate of defect parts per million. In kitting department Leans goals Do it Right First Time (DRFT) is used to measure defects occurring within the production processes which also known as ‘Internal measurement’. At their external customer, the companies manage to implement DRFT into their system. It is important for kitting department to know its DFRT because it’s related to customer satisfactions. Low defect means lay-up department will receive higher quality kits or sets, and there will be less interruption to the production flow.
DCS 1 JULY AUG SEP OCT NOV DIS
DFRT QUANTITY
(unit) 36394 13121 8808 3178 0 0
DFRT (%) 3.64 1.31 0.88 0.32 0 0
Figure 15. “Relationship of DRFT with product quality”.
From figure 15, DCS 1 machine shows that in the month of July, it produced 3.64% of defects, which is accounted for an amount of 33 units of ply, if convert to parts
JULY AUG SEP OCT NOV DIS Defective Quantity 32.5 14 13 3 0 0 DFRT (%) 3.64 1.31 0.88 0.32 0.00 0.00
0.00 0.50 1.00 1.50 2.00 2.50 3.00 3.50 4.00 0 5 10 15 20 25 30 35 P er cen ta ge K IT S/ SE TS
DCS 1 (DO IT RIGHT THE 1ST TIME)
JULY AUG SEP OCT NOV DIS Defective Quantity 8.5 7 25.5 12 0 0 DRFT (%) 0.76 0.56 1.77 1.27 0.00 0.00
0.00 0.20 0.40 0.60 0.80 1.00 1.20 1.40 1.60 1.80 2.00 0 5 10 15 20 25 30 P er cen ta ge K IT S/ S ETS
DCS 2 (DO IT RIGHT THE 1ST TIME)
JULY AUG SEP OCT NOV DIS Defective Quantity 13 14.3 4.5 0 0 0 DFRT (%) 1.13 1.23 0.31 0.00 0.00 0.00
0.00 0.20 0.40 0.60 0.80 1.00 1.20 1.40 0 2 4 6 8 10 12 14 16 P er cen ta ge K IT S/ SE TS
DCS 3 (DO IT RIGHT THE 1ST TIME)
JULY AUG SEP OCT NOV DIS Defective Quantity 11 15 6 0.8 0 0 DRFT (%) 3.27 4.16 1.32 0.28 0.00 0.00
0.00 0.50 1.00 1.50 2.00 2.50 3.00 3.50 4.00 4.50 0 2 4 6 8 10 12 14 16 P er cen ta ge K IT S/ SE TS
JIEM, 2010 – 3(3): 447-493 – Online ISSN: 2013-0953 Print ISSN: 2013-8423
per million, it will produced an amount of 36394 of ply. From month July to December, the trend of DRFT shows the amount of defect drops by time (trend going down) which is a positive sign of kitting department producing quality parts for its customer which is lay-up department. By the month Nov and Dec, no defects are being detected. As a summary DRFT has helped kitting department to help improve its overall quality, cost and deliver.
Lean goals (people productivity)
People productivity is based on lean goals, which is shown in figure 16. It is the measures of proportion of time spend adding value to the conversion process of raw material transformed into product. Kitting department have realized that People Productivity measuring can encourage them to continuous focus on key element of product cost, stimulate actions to reduce processing time, and reduce wasteful work in order to produce high amount of product in an efficient manner of time. From the chart, the trend of people productivity is fluctuating all the time, up and down all the time.
MONTH JAN FEB MARCH APRIL MAY JUNE JULY AUG SEP OCT NOV DIS
Number of
working day 29.0 22.0 24 22 30 24 24 30 25 26 22 24
No. of man 6 6 6 6 6 5 4 3 3 3 3 3
No. units
made 798.3 881.7 975.2 706.6 977.6 758 732 956.5 673.5 626.8 782.25 1028.75
Man hours 2523 1914 2088 1914 2610 1740 1392 1305 1088 1131 957 1044
Productivity
% 40% 46% 47% 37% 37% 44% 53% 73% 62% 55% 82% 99%
Figure 16. “Relationship between time and units produced (People productivity)”.
The main purpose is to achieve higher percentage of productivity, if possible, a ratio of should be more than 100%. Kitting department productivity is high, not
0% 10% 20% 30% 40% 50% 60% 70% 80% 90% 100%
0 500 1000 1500 2000 2500 3000
JAN FEB MARCH APRIL MAY JUNE JULY AUG SEP OCT NOV DIS
STACKING AREA PRODUCTIVITY
JIEM, 2010 – 3(3): 447-493 – Online ISSN: 2013-0953 Print ISSN: 2013-8423
even half, this means many waste occur, part produced with the time allocated is not fully utilize. Kitting department needs to improve its productivity in order to control people cost associated with manufacturing.
Lean goals (stock turn)
Stock turn ratio can reveal the level of control that kitting department has of the process, because tightly controlled process display low values of raw material and WIP. By contrast, poorly controlled processes involve more work in progress (WIP) in order to accommodate the variations in the process.
MONTH JAN FEB MARCH APRIL MAY JUNE JULY AUG SEP OCT NOV DIS
No. units
made 798 882 975 707 978 758 732 957 674 627 782 1029
WIP 100 67 80 73 75 65 88 50 45 22 16 28
Finish
goods 808 1017 1098 1052 1062 846 978 935 797 703 795 653
WIP+Finish
goods 908 1084 1178 1125 1137 911 1066 985 842 725 811 681
Stock turns 0.88 0.81 0.83 0.63 0.86 0.83 0.69 0.97 0.80 0.87 0.96 1.51
Figure 17. “Stock turn on Kitting department inventory”.
Figure 17 shows the current situation of stock turn on kitting department inventory. It can be noticed that the number of units made are lower than the quantity of finish goods and WIP. The stock turn trend show in red line are going up and down all the time, this clearly shows that kitting department have some problems on controlling its process. Meanwhile from the graph, it is noticed that the stock turn ratio are low, lower than 1.0. During the time this study is conducted, kitting department has been trying to implement Kanban supermarket, to control their process so that no overproduction is done. Kitting department hopes by implementing kanban supermarket the stock turn ratio will be high.
0.00 0.20 0.40 0.60 0.80 1.00 1.20 1.40 1.60
0 200 400 600 800 1000 1200 1400
JAN FEB MARCH APRIL MAY JUNE JULY AUG SEP OCT NOV DIS
RAT
IO
STACKING AREA STOCK TURNS
JIEM, 2010 – 3(3): 447-493 – Online ISSN: 2013-0953 Print ISSN: 2013-8423
Leans goals (Delivery Schedule Achievement)
Delivery Schedule Achievements (DSA) measures how well kitting department matches the planned deliveries requirement of the customers. Late deliveries are regarded as failures compared to the planned delivery schedule. Kitting department sees that DSA will aid them in match the planned deliveries schedule by preventing late deliveries, eliminating factors that contribute to part deliveries.
MONTH JAN FEB MARCH APRIL MAY JUNE JULY AUG SEP OCT NOV DIS
PLANNED 935 797 1098 846 978 1062 1017 653 703 808 1052 653
LATE
DELIVERIES 136 91 122 88 96 84 61 26 29 25 23 26
DSA 0.85 0.89 0.89 0.90 0.90 0.92 0.94 0.96 0.96 0.97 0.98 0.96
Figure 18. “Delivery Schedule Achievement on kitting department inventory”.
Figure 18 above shows the DSA ratio from the month January till December 2007 and a good DSA value was achieved, most of the time 0.90 and above, and the standard DSA value is 1.0. Those figures have proved that kitting department manages to deliver their product most of the time on time. The trend of DSA going up and down is not a major problem as every month the planned deliveries are different from other months.
0.78 0.80 0.82 0.84 0.86 0.88 0.90 0.92 0.94 0.96 0.98 1.00
0 200 400 600 800 1000 1200
JAN FEB MARCH APRIL MAY JUNE JULY AUG SEP OCT NOV DIS
STACKING BACKLOG
JIEM, 2010 – 3(3): 447-493 – Online ISSN: 2013-0953 Print ISSN: 2013-8423
Leans goals (floor space utilization)
Before After
Figure 19. “Floor spaced freed for Value added activity”.
Tooling department need an area for the air pad process. Kitting department has given half of JIT supermarket area to tooling department. These reduce space and maximize existing space usage for JIT supermarket purpose. Reduction on floor
space is 55.06 m2 and total area of kitting department is 1096 m2
Leans goals (Value Added Per Person)
which lead to the improvement around 5% was achieved for year 2007.
JIEM, 2010 – 3(3): 447-493 – Online ISSN: 2013-0953 Print ISSN: 2013-8423
The VAPP measure is important as the production process can be controlled to ensure the maximum differential between output and input values. The output and input values reflect the difference between the final value of the end product and the value of the raw materials and services used. The VAPP has a direct impact on the costs associated with a process and Figure 20 shows specifically how well people are used to transform materials into the finished product.
Figure 20. “Value Added per Person Cost Trend Chart”.
5.4 Total employee involvement in PDS implementation
Type of wastages eliminated
The graph in Figure 21, gives us an idea about different types of wastages of the kitting department eliminated and reflected to the number of ideas generated, where the wastages are classified into 11 types. The highest type of waste eliminated is related to time as around 50 ideas generated to reduce this waste. Without classification of any wastage into performance measurement, no monitoring can be made and no problem solving can be done to reduce the waste, which is the impact of the failure of lean process management at Kitting department. It indicates employees of the company have capabilities to solve waste problem using the performance measurement which act as the visual indicators for them to practice continuous improvement.
JAN FEB MARCH APRIL MAY JUNE JULY AUG SEP OCT NOV DIS
VperPP -67 -172 -121 -44 -44 -46 -64 2 -30 -17 3 22
-180 -170 -160 -150 -140 -130 -120 -110
-100-90
-80 -70 -60 -50 -40 -30 -20
-100
10 20 30 40
R
M
R
ig
gi
t
Value Added per Person Cost Trend
G
OOD
After PDS Implementation RM per PP improved
JIEM, 2010 – 3(3): 447-493 – Online ISSN: 2013-0953 Print ISSN: 2013-8423
Figure 21. “Type of wastages eliminated for year 2007”.
Idea generated and level of involvement
Many studies focus mainly on the creative or idea generation stage of problem solving. In this context, the fact is, employees can help improve business performance by solving problems, through generation of ideas and use these ideas as building blocks for newer and better products, services and work processes. (de Jong and Hartog, 2007)
Figure 22. “Level of employees’ involvement for year 2007”. Material
12%
Inventory 2%
Overproduction 2%
Labor 13%
Complexity 10%
Energy 7% Space
16% Defects
12% Transportation
2% Time 21%
Unnecessary Motion 3%
TYPE OF WASTAGE ELIMINATED FOR YEAR 2007
30 IDEAS
25 IDEAS
17 IDEAS 38 IDEAS
29 IDEAS 5 IDEAS
6 IDEAS
50 IDEAS
38 IDEAS
6 IDEAS
4 IDEAS
BOTTOM 27%
MIDDLE 9%
TOP 1% BOTTOM-MIDDLE
37% BOTTOM-TOP
1%
MIDDLE-TOP 25%
LEVEL OF EMPLOYEES INVOLVEMENT FOR YEAR 2007
35 IDEAS
38 IDEAS
139
Total # of Idea
Generated
=
Total # of Idea
Completed
=
122
1 IDEA
51 IDEAS
12 IDEAS
JIEM, 2010 – 3(3): 447-493 – Online ISSN: 2013-0953 Print ISSN: 2013-8423
From Figure 22, the pie charts shows idea had been generated in the Kitting Department and that reflects the involvement of various levels. In the past one year a total of 139 ideas had been generated. It proves that the Kitting Department was proactively and continually seeking out ideas to solve their problems. This indicates that the employee has the capability to solve problems, which may arise in an organization, and this becomes a central tenet of lean manufacturing’s best practices (Kerrin, 1999).
The employee involvements in idea generation are categorized according to the three main levels which are top, middle and bottom management. The highest contributions came from the bottom level employees which are 38 ideas, and it is followed by the middle level with 12, while the top level employees came up with 2 ideas. Beside this, there is also combination of levels in idea generation. That is, employees from Bottom-middle level management level came up with 52 ideas, middle-top is 35 and bottom-top is 1. Furthermore, the total ideas generated by the group combination are 87 and the ideas from single level are 52. Percentage for combination level is 63% out of the total ideas generated and 3 type levels is 37%. However, if we compare the 2 groups, the result shows that total ideas generated by the group combination level are 35 more than the total ideas generated by single employees. Thus, the result indicates the importance of teamwork at the bottom, the middle and the top management in both sharing as well as applying knowledge for the generation of ideas to solve the problems. (Delbridge, 1998)
Lean tools used in problem solving (reflect on cross functionality and skill matrix)
JIEM, 2010 – 3(3): 447-493 – Online ISSN: 2013-0953 Print ISSN: 2013-8423
problem. So, we can conclude that employee have the capability of problem solving by utilizing the lean tools.
Figure 23. “Lean Tools used in problem solving”.
With the implementation of PDS it was identified that people’s knowledge and skills are limited to the task or function they are trained which have limited the cross-functional capabilities of the shop floor employees. Through PDS, Team members have developed the Skills Matrix competency chart to identify each employee capabilities in PDS Implementation. After the skills development were initiated by the team members they have necessary capabilities to perform cross functional activities which have the flexibilities required in Lean Process Managements. With cross functional capabilities the members also developed their problem solving capabilities with better understanding of the processes and functions in the shop floor to identity waste and work out solutions.
Before PDS was introduced, employee skills base on operational & functions with minimum need to know basis for Management to Shop floor employees. Not all employees in the selected department were selected to participate and developed with necessary training. PDS introduced all the employees involved in the implementation of LPM with PDS with all the necessary training and skills development to develop the problem solving of the employee’s. With this done, the employee’s not only exceeded the hours of per employee and also have received very good cooperation and commitment by all employees in the department and support departments. The training on Team development and team working have
5S 29%
TPM 33% Kaizen
14% Std. Work
12% VSM
2% TQA
4% SMT
6%
Visual Indicator 7%
JIT 1%
LEAN TOOLS & TECHNIQUES USE FOR YEAR 2007
4 IDEAS 8 IDEAS
11 IDEAS
55 IDEAS 2 IDEAS
12 IDEAS
62 IDEAS 27 IDEAS
JIEM, 2010 – 3(3): 447-493 – Online ISSN: 2013-0953 Print ISSN: 2013-8423
helped the team members in learning and applying the various problem solving tools in monitoring and working out solutions. After PDS implements Managements commitment skills developments with the necessary knowledge and skills clearly evident where the total hours per employee have significantly increased exceeding the goal they have set.
Continuous improvement activities (Kaizen and cost savings)
Cost saving is an important standard to indicate the problem solving capability of the organization, especially the workers. The aim of lean manufacturing is elimination of waste in every area of production and it includes customer relations, product design, supplier networks, and factory management. To meet the objectives of saving cost and thereby incorporate lean process manufacturing, Kitting Department has begun a Kaizen Project in 2007 and the total costs saved while reducing the wastages in past one year is RM1, 952,617.98 (Table 2). Thus, achievement of cost saving for a company indicates that the employees had played a major role in coming up with solutions to solve the problem of waste. So, we can conclude that problem solving capability of employee actually has a significant impact on cost savings. The Table 3, indicates the total cost savings of the Kitting Department with the reference to their Kaizen project, which is generated from the problem solving activities.
KITTING CONTINUOS IMPROVEMENT PROJECTS FOR YEAR 2007/2008
2007 2008
REGISTERED TOTAL (RM) REGISTERED TOTAL (RM)
1. REDUCE TIME SET UP
FOR S91 CONTROLLER $19,042.80 1. REDUCE CONSUMABLE USAGE $100,000
2. JIT PRODUCTION
PREPARATION $136,973.44 2. REDUCE SPACE $20,000
*KANBAN REGULATOR *NESTING AND STICKER
RACKS
*REDUCE PLASTICS USAGE *JIT SUPERMARKET
*REDUCE OVERTIME 3. CONVERT WALKWAY INTO
CLEAN ROOM $100,000
*ELIMINATED NIGHT ALLOWANCES
*REDUCE ELECTRICITY USAGE
TOTAL $156,016.24 TOTAL $220,000.00
UNREGISTER TOTAL (RM) UNREGISTER TOTAL (RM)
1. TOOLS TROLLEY $127.70 1. DRY & RESIN RICH ISSUE Under
Monitoring 2. SPLIT AND BATCH
PAPERWORK $1,795,988.16 2. NESTING IMPROVEMENT ON A320 AND A400M Under Monitoring
TOTAL $1,796,115.86 TOTAL
JIEM, 2010 – 3(3): 447-493 – Online ISSN: 2013-0953 Print ISSN: 2013-8423
Degree of leanness and degree of management commitment survey results
Degree of leanness (DOL) was measured as the average of the actual changes taking place as measured by the nine principles of lean manufacturing. (Refer to Appendix A for Questionnaire). Degree of management commitment (DOC) was measured by the level of investment in supporting manufacturing infrastructures, as measured by WEMP, TRAIN, GROUP and QLEAD. The table 3 indicates the mean and index value of DOL and DOC. The results of survey in January 2007 indicates the degree of leanness of the company is low with mean value is 2.90±0.20. However, for the December 2007, the mean value is increase to 3.87±0.47, the increments is 33.4%, and become moderate level. Meanwhile, we can see that when the degree of management commitment is increased, the degrees of leanness also increase. So, we can conclude that the level of management supporting manufacturing infrastructures has been making the company leaner. From the result of the analysis in table 3, the commitment by Top management for leanness in the Kitting Department shows significant improvement. It was found that the increment have strong relationship with problem solving capability of the Kitting Department’s employees, which lead to the achievement of better Leanness level through the following infrastructural investments. This is supported by various researches conducted by researchers on each infrastructural investment.
SURVEY FOCUS METHOD JAN 07
RESULTS RESULTS DEC 07 FINDINGS
LEANNESS -degree of adoption (total 9 practices) - supporting manufacturing infrastructure
• WEMP • TRAIN • GROUP • QLEAD
Average
Mean values
(total is 4) -2.897
-3.264 -3.338 -3.225 -3.460
-3.321
-3.907
-3.578 -3.676 -3.871 -3.786
-3.728
-9 practices of DOA all has significant increment
-All got significant increase, especially GROUP,
increment about 20%
TOP MANAGEMENT COMMIMENT ( 6 practices )
Mean values
(total is 4) -3.32 -3.85
-All practices has significant increment, average
increment is 16%
Variable Mean(JAN) Mean(DEC) SD(JAN) SD(DEC)
DOL 2.90 3.87 0.20 0.47
DOC 3.32 3.85 0.10 0.7
JIEM, 2010 – 3(3): 447-493 – Online ISSN: 2013-0953 Print ISSN: 2013-8423
This is supported by various research conducted by researches on each infrastructural investments.
5.5 Group problem solving capabilities
Group problem solving capabilities are required on the part of the employees to work as team. Team members need training in breadth so that they can perform each others’ jobs and in depth so that they resolve unforeseen problems as they occur (Strauss cited in Heller, Pusic, Strauss, & Wilpert, 1998). Furthermore, a group of people who meet regularly to discuss problems and issues related to quality may examine them and importantly can come up with solutions. The research of Cooper (1999) also indicates that the introduction of true cross-functional teams can dramatically improve the time to solve the problems such as marketing of new products and it surely impacts on the success of the new product development.
5.6 Training
JIEM, 2010 – 3(3): 447-493 – Online ISSN: 2013-0953 Print ISSN: 2013-8423
management, when they have capabilities in technical, analytical, planning skills as well as interpersonal training.
5.7 Worker empowerment
There is consistent empirical support for a positive linkage between the delegation of power and responsibility among the employees and the ability of the workers to come up with ideas, and importantly to exhibit problem solving capabilities. In a study among German middle managers, leaders can influence the innovation process by granting their subordinates freedom and autonomy. She found that granting freedom and autonomy was positively related to various types of innovative behaviour among the employees, including the generation, testing, and implementation of ideas and all of this will work toward the direction of solving the problems. In an early study among NASA scientist with more freedom to explore, discuss and challenge ideas was associated with their higher problem solving performance and innovation.
5.8 Quality leadership
JIEM, 2010 – 3(3): 447-493 – Online ISSN: 2013-0953 Print ISSN: 2013-8423
a promising idea fits within the organization’s vision and importantly is shared by the employees, convincing them of its value and guiding its implementation was believed to be much easier process for the employees and the organization. research and development outcomes of solving the problem. The overall survey results for this study compared with other research findings can bring to a conclusion that the employees’ improve their most practices to achieve higher leanness level. Thus, implementing lean process management after one year for this case study, shows problem solving capability of employees have increased and thus improving lean practice in the department.
6 Conclusion
The three main concepts that play crucial roles during lean process management are Respect for People, Skill and Knowledge and KPI. That is, all these three concepts or elements are integrated to optimize the functioning of the employees and bring out Total employee involvement. All these three elements have been focused only separately in the past studies. In all the past studies regarding lean process management, these three elements and its role in lean process have been studied only separately without being studied in a combined manner. In this study, all these three elements were studied in an integrated manner and how it can be used in unison to build and optimize the problem solving capability of employees. Beside this, the study also proposed a PDS performance measurement model for the company, ABC Company. Importantly, that model could be replicated anywhere in various sectors and industries. Also, it can be modified according to the industries in which it can be implemented. So, this model, formulated in ABC Company, can be implemented in host of industries including the industries in the Public sector.
JIEM, 2010 – 3(3): 447-493 – Online ISSN: 2013-0953 Print ISSN: 2013-8423
provides a lot of knowledge and information about the lean processes that was successfully implemented. So, this study provided a practical as well as theoretical knowledge about the successful PDS practices, which can be implemented in any industry.
The results of this study clearly suggest or even prove, that successful implementation of lean process can provide a wide array of benefits to any company, irrespective of the industry in which it operates. As Womack et al. (1990) and Womack, Jones and Roos (1996) said, lean practices and principles can be applied to all industries and services around the globe. That is, apart from the countless manufacturing companies, the concept of a lean process management has been implemented in many different industries as diverse as insurance, IT, healthcare, etc. But, non-manufacturing industries have not incorporated lean process maximally like the manufacturing organizations.
Appendices
Appendix A: questionnaire survey form (in English and Malay languages)
Department: ………. Please fill the circle Top Level Middle Level Bottom Level N o A do pt io n/ Tid ak D ia m alk an Le ss A do pt io n/ K ur ang D ia m al ka n Pa rti al A do pti on / S er da ha na D ia m al ka n D o A do pt io n/ D ia m al ka n To ta l A do pt io n/ A m at D ia m al ka n Category/
Kategori No.
D egr ee o f l ea n n es s/ T aha p “ Le anne ss ”
Rate the degree of adoption of the following lean production principles.
Nilaikan tahap pengamalan prinsip “Lean Production” berikut.
1 Elimination of waste 2 Continuous improvement 3 Zero defects
JIEM, 2010 – 3(3): 447-493 – Online ISSN: 2013-0953 Print ISSN: 2013-8423
No C om m it m