ISSN: 2146-4138 www.econjournals.com
188
R&D Expenditures and Economic Growth Relationship in Turkey
Cuma BOZKURT Department of Economics,
The Faculty of Economics and Administrative Sciences, Gaziantep University, Gaziantep, Turkey.
Email: cbozkurt@gantep.edu.tr
ABSTRACT: In today's world, globalization has reached to such an extent that, investment in information and technology is inevitable to be integrated with global system and increase competitive power. Therefore, R&D investments are of high importance and priority for growth process of economy. This paper investigates the long-run relationship between R&D expenditure and economic growth using the Johansen co-integration and the vector error correction models. The research findings indicate that there is a unidirectional causal relationship running from economic growth to R&D. the long-run coefficients for the variable R&D is strongly statistically significant and has positive value. The growth rate of GDP will increase 0, 2630% if R&D shares in the GDP increases 1%.
Keywords: R&D Expenditures; Economic Growth; Turkey; Co-integration JEL Classifications: F43; O30; O32; O40
1. Introduction
Growth brings along an improvement in life standard. According to economy theory, even slight differences in growth rate may pose drastic changes in the welfare level of countries. It is necessary to efficiently use and develop knowledge and information technologies in order to achieve a high rate of growth, which is one of the basic desires of every society. It is obvious that processes which contribute to economic growth, such as introducing new products, developing production techniques, obtaining more output with the same input and more rapid production methods can not achieve any goals without R&D in today's world.
Over the course of time, also with the effect of globalization, and changing of certain factors such as social, political, economic and physical factors, people's tastes, preferences, needs and expectations also change and expectations are shaped accordingly. In today's world, globalization has reached to such an extent that, investment in information and technology is inevitable to be integrated with global system and increase competitive power. Therefore, R&D investments are of high importance and priority. It is a known fact that world's leading developed countries allocate more fund to R&D. The share of R&D expenditures in Internal Revenue, which is considered to be the most significant indicator in this regard, is more than 2% in developed countries. In Turkey, on the other hand, this rate is currently 0.95%. For this reason, countries, which attach more importance to R&D development, develop new technologies and have competitive advantage and superiority. This condition leads to the fact that these countries place more emphasis on R&D development and encourage relevant studies thereby spreading R&D awareness.
189 2. Theoretical Framework
Economic growth, which is one of the most important aspects of macroeconomics, affects people's life standard and welfare level directly. Introducing the underlying key determinant of growth process also constitutes the basis of studies on this subject. While neoclassical growth models assume that increase of efficiency is an external phenomenon, this conviction changed in the early 1980's. New development theory suggests that long-term growth is affected by human activities and planned economic behaviours (Verbic et al., 2011:67). R&D expenditures are regarded as incentive factor of developments in science and technology.
Investments in research and development in the areas of science and technology are considered to be one of the essential criteria for a nation to evaluate its economic development and competitive power. Because these investments affect economic growth through various channels such as innovation, capital accumulation and development of human resources. All of these factors pave the way for economic development by degrees (Bor et al., 2010:171).
Solow(1956) and Swan(1956) suggested that technology and science are two key factors in the growth process of countries. Later, Romer (1990) and Lucas (1988) pioneered internal growth models, which incorporated R&D development into economic growth model as an endogenous variable. In these models, it is suggested that R&D investments lead to technological innovations and developments thanks to human capital and accumulation of knowledge. These models were afterwards developed by Grossman and Helpman (1991) and Aghion and Howwit (1992) and survived until today. In a globalizing world, situations, pleasures, preferences and expectations have changed rapidly. This situation becomes more important in the growth process for an economy.
Economic growth can be considered as the primary concern of policy-makers and economy management, who make significant endeavours in this regard. Many attempts have been made to evaluate the effect of different factors on economic growth. Therefore, there is an extensive literature on growth theory, which can be classified into three categories (Evenson, 1997:3):
First Post-Keynesian growth models (Harrod-Domar growth theory and its variants) emphasized the importance of investment and savings for encouraging growth.
Neo-classical growth models laid emphasis on the significance of external technical progress as the most important determinant of economic growth.
New growth theory, which is also known as endogenous growth theory, laid emphasized on R&D, human capital accumulation and externalities as the most important factors for determining long-term economic growth. In this context, the significant aspect is the fact that the interest of new growth theories in growth rate as an internal factor depends on determining investment rate endogenously.
Technological developments have played a significant role in encouraging growth and scientific and technological innovations since 1980's. Most countries drove R&D investments forward in order to increase economic growth and national competitiveness. State factor has become the most important initiative to reinforce scientific and technological R&D investments in certain fields and achieving industrial development afterwards. R&D development investments in science and technology fields affect economic growth in direct and indirect ways. While purchase and consumption of products produced in domestic market was within the scope of budget in the past, this situation has changed as follows over the course of time (Bor et al., 2010:171):
Reductions, which leads to higher levels of market competition in terms of production costs.
A progress in the labour productivity of producers and therefore emergence of more income and value,
Creating the spillover effect, which generated more added-value through high production value and industrial correlation effect. However, evaluating the effect of R&D investments on the economy as a whole is a complicated and elaborated process.
190 in factor inputs. Primary determinant of efficiency increase is investments in education, that is, investment in human capital and R&D (Verbic et al., 2011:67).
In terms of policy implementations, endogenous growth models generally agree with the argument that long-term growth rate depends on saving / investment rates. This aspect implies that a public policy, which increases saving rates can have an effect on the growth of economies (such as R&D subventions, investments in education). Key element of endogenous growth theory is endogeneity of gross domestic product's growth rate. Accordingly, production can not be explained only in terms of material aspects of physical capital such as building and equipment; intangible capital such as human capital and R&D must also be taken into account. R&D development and indirectly, information, are very important aspects in the new growth theory models. R&D not only generates profitability, but also contributes to the other actors of economy. Therefore, they solicit the spillover effects of knowledge, information and know-how (Idea, 2008:39).
Two main functions of R&D activities are doing and learning. In this process, the knowledge transmission is known as a “spillover effect”. Knowledge causes an innovation and it enables producers to make new product, to reduce costs and to improve the quality of product. Therefore R&D is closely linked to productivity (Kim, 2011:26). R&D investments are irreversible investments and subject to an uncertainty (Sadraoui et al, 2014:7).
R&D and innovation are the driving forces of change, and key determinants of growth for most industrial and service sectors (Gerybadze, 2010:11). R&D is the key point of efficiency and economic growth (Samimi and Alerasoul, 2009:3464). R&D is the key determinant of consumer wealth and efficiency in the long term (Jones and Williams, 1999:1). Theoretical and empirical literature has shown that investments in R&D expenditures are very important for economic growth (Pessoa, 2010:152). R&D must be regarded as a driving force for science and technology, which play a highly significant role for economic growth in future (Peng, 2010: 1725). Investments in R&D expenditures can be considered as the key strategies of secure technology potential, and therefore innovation and economic growth. R&D investment increase the possibility that they achieve a higher standard in terms of companies and regions, which introduce them to new and advanced products and/or processes, and as a result of this, higher income and growth levels (Bilbao and Rodriguez, 2004:3). Ensure competitiveness is required for a country’s ability to achieve high rates of growth in per capita income which is the most important indicator of economic prosperity.
3. Literature Review
Falk (2000) examined the effect of R&D expenditures on economic growth for OECD countries with panel data analysis method by using the data related to the period 1970-2004. According to the findings, both the ratio of company's R&D expenditures to GDP, and the share of R&D investments in advanced technology sectors, have strong positive effects on both per capita income and average hourly earnings per capita in the long term.
Zachariadis (2004) investigated R&D related growth condition between the period 1971-1995 for 10 OECD countries by using manufacturing industry data. Models used in this study are related to R&D intensity in efficiency increase and the following output increase. According to the findings, R&D intensity has a positive effect on efficiency and output increase.
Nadiri and Kim (1996) analyzed the spread of international R&D, commerce and efficiency for G-7 countries. In this context, he analyzed the effect of international R&D spill-over on the increase of total factor productivity, effect of spill-over on the production structure, effect of technology transfers on export and import models, and calculating the private return rates of R&D investments and physical capital as well social return rates of R&D for seven major industrialized countries. As a result of the study, it was concluded that there are significant differences between a country's own R&D efforts and the level of benefit gained from the R&D investments of other countries. It was also concluded that the direction of international spill-over effects on factor demands and output is consistent between the countries, but their magnitude vary according to different countries and periods.
191 levels. However, R&D intensity restricts the growth of enterprises without high technology regardless of the level of R&D level.
In their studies on international R&D spill-over and organizations, Coe et al. (2008) reached to the conclusion that organizational differences are significant determinants for total factor productivity and R&D spillover affects its level.
Horowitz (1967) has analysed the relations between R&D increase and regional economic growth for various states in United States using the data for the period between 1920-1964 and concluded that growth equation, correlation measurement coefficients are consistent with growth, and regions are satisfied with the fact that R&D activities are quite consistent with growth rates.
Kim (2009) analysed the effect of R&D activities on economic growth for Korea by using R&D based Cobb-Douglas production function and the data for the period between 1976-2009. According to empirical findings obtained as a result of the study, traditional production factors (labour and capital) make a contribution to economic growth by approximately 65%. Also, contribution rate of R&D stocks on economic growth is approximately 35%. When analysed in detail, it is seen that approximate contribution of private and public R&D stocks on economic growth are respectively 16% and 19%.
Funke and Niebuhr (2000) analysed the relationship between R&D spillover and economic growth for West Germany using the data for the period between 1976-1996. According to the data obtained, dissemination of information is beyond regional boundaries. Also, in geographical terms, spill-overs between close regions were mainly considered important.
Segerstrom (2000) analysed the effect of R&D incentives on long-term growth. According to the data obtained, R&D incentives surprisingly either support the long-term economic growth or delay it. The result which delays the growth is based on a range of reasonable parameter values. This study also suggests a new perspective related to the question of why R&D incentives affect long-term economic growth (both positively and negatively).
Sadraoui et al. (2014) analysed the causality between R&D collaboration and economic growth by using the data of 32 industrialized and developed country for the period between 1970-2012. Results obtained support the argument that there is a strong causality between economic growth and R&D collaboration. On the contrary, the noncausality between R&D collaboration and economic growth couldn't be refused in several contexts. However, these results show that, if there is such a relationship, a Granger causality test with one or two variants can't be defined easily.
Peng (2010) analysed the relationship between R&D expenditures and economic growth for China and reached the conclusion that GDP will increased by approximately 0.92% if R&D expenditures increase by 1%.
Yanyun and Mingqian (2004) analysed the relationship between R&D expenditures and economic growth for 8 ASEAN (Association of South East Nations) countries and Korea, Japan and China for the period between 1994-2003 by using panel data set. According to the data obtained, there is an interactive relationship between R&D expenditures and economic growth. Therefore, every country must aim to increase its competitive power and achieve sustainable economic growth, and increase its R&D expenditures.
Ulku (2004) analysed the relationship between R&D, innovation and economic growth with panel data method for 20 OECD countries and 10 countries, which are not members of OECD by using patent and R&D data for the period between 1981-1997. The data obtained suggest that effect of R&D stocks on innovation is significant only in OECD countries with broad markets, and there is a positive relationship between GDP per capita and innovation in both OECD countries and countries, which are not members of OECD.
Altın and Kaya (2009) analysed the relationship between R&D expenditures and economic growth by using the data for Turkey for the period between 1990-2005 and found that there is not a causality relationship between R&D expenditures and economic growth in the long term, but there is a causality relationship from R&D expenditures to economic growth in the long term.
Korkmaz (2010) analysed the relationship between R&D investments and economic growth with cointegration method by using the data for the period between 1990-2008 and came to the conclusion that there is a cointegration between both variants and both variants affect each other in the long term.
192 between 1999-2002 and came to the conclusion that Turkey lags behind OECD countries with regard to R&D indicators.
Taban and Şengür (2013) analysed the relationship between R&D and economic growth by using the data for the period between 1990-2012 in Turkey and cointegration models, and reached to the conclusion that R&D expenditures affect economic growth positively in the long term.
Gülmez and Yardımcıoğlu (2012) analysed the relationship between R&D expenditures and economic growth in OECD countries by using the data for the period between 1990-2010 and came to the conclusion that there is a significant interactive relationship between R&D expenditures and economic growth variants in the long term.
Genç and Atasoy (2010) analysed the relationship between R&D expenditures and economic growth by using the data for the period between 1997-2008 and causality method, and found that there is an unilateral causality relationship from R&D expenditures to economic growth.
4. Material and Methodology
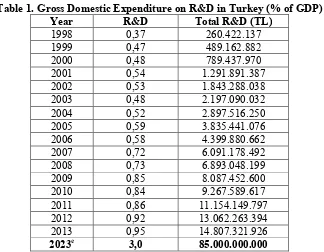
According to the survey results in public sector, foundation universities and business enterprise sector and calculations based on higher education sector registers for state universities, Gross Domestic Expenditure on Research and Development increased in Turkey in 2013 compared to the previous year by 13.4% and reached to 14 billion 807 million TL. In Turkey, share of R&D in GDP was 0.95% in 2013. It was 0.92% in 2012 (see Table 1). Despite the share of R&D in GDP has increased by years which are still less than 1% in Turkey. This ratio is above 2% in the Euro Area, approximately 3% in United States, over 3% in Japan and %4 in South Korea. The countries where this share is high are developed countries. So that there are many distance to reach the 2023 targets as a nation.
Table 1. Gross Domestic Expenditure on R&D in Turkey (% of GDP) Year R&D Total R&D (TL)
1998 0,37 260.422.137
1999 0,47 489.162.882
2000 0,48 789.437.970
2001 0,54 1.291.891.387
2002 0,53 1.843.288.038
2003 0,48 2.197.090.032
2004 0,52 2.897.516.250
2005 0,59 3.835.441.076
2006 0,58 4.399.880.662
2007 0,72 6.091.178.492
2008 0,73 6.893.048.199
2009 0,85 8.087.452.600
2010 0,84 9.267.589.617
2011 0,86 11.154.149.797
2012 0,92 13.062.263.394
2013 0,95 14.807.321.926
2023e 3,0 85.000.000.000
Sources: http://ec.europa.eu/eurostat/tgm/table.do?tab=table&plugin=1&language=en&pcode=t2020_20 http://www.tuik.gov.tr/PreHaberBultenleri.do?id=16163
http://www.turkstat.gov.tr/PreTablo.do?alt_id=1082
http://www.tubitak.gov.tr/tubitak_content_files/BTYPD/BTYK/btyk23/2011_101.pdf
193 Statistical Institute (Turk Stat). The annual data are selected to cover the period from 1998 to 2013. We see that increased GDP and R&D outside a few breaks which occur after crisis (see Figure 1).
Figure 1. Real GDP per capita (Natural Logarithm) and RD expenditure (% of GDP) in Turkey
8.6 8.7 8.8 8.9 9.0 9.1
1996 1998 2000 2002 2004 2006 2008 2010 2012
GDP 0.3 0.4 0.5 0.6 0.7 0.8 0.9 1.0
1996 1998 2000 2002 2004 2006 2008 2010 2012
RD
Integration Analysis
In this study we employ the Augmented Dickey-Fuller (hereafter, ADF) unit root test to examine for the stationarity of variables. The regression models of the ADF unit root test below:
1 1 k
t t i t i t
i
y
y
y
0 1
1 k
t t i t i t
i
y
a
y
y
0 1 2
1 k
t t i t i t
i
y
a
y
a t
y
where
a
0 is intecept, t is linear time trend, k is the number of lagged first differences, and
t is error term. The null hypothesis is unit root and the alternative hypothesis is level stationarity. (Enders, 2004: 183). If the coefficient of the lag ofy
t1 (
) is significantly different from zero, then the nullhypothesis is rejected. Cointegration Test
Johansen (1988) and Johansen and Juselius (hereafter, JJ) (1990) maximum likelihood (ML) procedure is a very popular cointegration test and useful method to determine the long-run relationship among nonstationary variables. The model is based on the error correction representation given by
1 1 1 p i t t i t it
X
X
X
where Xt is an (nx1) column vector of p variables, μ is an (nx1) vector of constant terms, Γ and Π represent coefficient matrices, Δ is a difference operator, k denotes the lag length, and εt is p-dimensional Gaussian error with mean zero and variance matrix (white noise disturbance term). The coefficient matrix Π is known as the impact matrix and it contains information about the long-run relationships. This Equation resembles a vector autoregressive (hereafter, VAR) model in first differences, except for the inclusion of the lagged level of Xt-1, an error correction term (hereafter, ect), which will contain information about the long run among variables in the vector Xt. The vector error correction (hereafter, VEC) method equation above allows for three model specifications:
(a) If Π is of full rank, then X
194 number of variables in the system), there exists matrices α and β, with dimensions (p x r), such that βα′=Π. In this representation β contains the coefficients of the r distinct long run cointegrating vectors that render β'Xt stationary, even though Xt is itself non-stationary, and α contains the short-run speed of adjustment coefficients for the equations in the system (see Awokuse, 2003).
Johansen’s methodology requires the estimation of the VAR equation (2) and the residuals are then used to compute two likelihood ratio (LR) test statistics that can be used in the determination of the unique cointegrating vectors of Xt. The first test which considers the hypothesis that the rank of Π is less than or equal to r cointegrating vectors is given by the trace test below:
nr i
i
T
Trace
1
)
1
ln(
The second test statistic is known as the maximal eigenvalue test which computes the null hypothesis that there are exactly r cointegrating vectors in Xt and is given by:
λmax = -T ln(1-λr)
The distributions for these tests are not given by the usual chi-squared distributions. The asymptotic critical values for these likelihood ratio tests are calculated via numerical simulations (see Johansen and Juselius, 1990; and Osterwald-Lenum, 1992).
5. Empirical Results
The integration analysis of variables was examined using of ADF unit root test. The optimal lags for unit root tests are to include lags sufficient to remove any serial correlation in the residuals. The optimal lags for unit root tests are determined according to the Schwarz Criterion. Results from the ADF unit root tests are presented in Table 2. These results show that the null hypothesis of a unit root in each time series were failed to reject at 5 percent significance level but strongly rejected at their first difference. This implies that all variables are non-stationary at levels but stationary at the first differences.
Table 2. ADF Unit Root Test Results
Variable Level First Difference Result
GDP -2.0325 (-3.7105) [ 0, c+t ] -3.9792 (-3.0656) [0, c ] I (1) RD -2.4849 (-3.7105) [ 0, c+t ] -5.8842 (-3.0656) [0, c ] I (1)
Notes: MacKinnon critical values at 5% are in ( ) and number of lags, and model specification, are in [ ],
respectively. The optimal lags for unit root tests are determined according to the Schwarz Criterion. Models c+t,
c and none c+t contain constant and trend; only intercept, and none of constant and trend, respectively.
Table 3. Johansen-Juselius Cointegration Tests Results Trend assumption: Linear deterministic trend
Sample (adjusted): 1998 2013
Included observations: 16 after adjustments
H0 H1
Trace Statistics
5 % Critical
Value p-value
λ-max Statistics
5 % Critical
Value p-value r=0 r=1 16.6196 15.4947 0.0337 16.1352 14.2646 0.0250 r≤1 r=2 0.4843 3.8415 0.4865 0.4843 3.8415 0.4865 Notes: Number of optimal lags, 1, based on FPE, AIC, SIC and HQ information criteria’s results. r is # of cointegrating vectors. Critical values used are taken from Osterwald-Lenum (1992).
195 Table 4. The Long-Run and Vector Error Correction Estimates
The Estimated Long-run Coefficients
Dependent Variable : GDP Dependent Variable : RD
Variables Coefficients (Standard Errors) [t-Statistics] Coefficients (Standard Errors) [t-Statistics]
Constant 8.4544 -13.8862
RD 0.2630 (0.0800) [7.6076]
GDP 1.6425 (0.1638) [10.0261]
The Estimated Short-run Coefficients
Dependent Variable : ∆GDP Dependent Variable : ∆RD
Variables Coefficients (Standard Errors) [t-Statistics] Coefficients (Standard Errors) [t-Statistics] Constant 0.0093 (0.0166) [0.5616] 0.0602 (0.0137) [ 4.3776] ∆GDP(-1) 0.2630 (0.3248) [0.8097] -0.7590 (0.2692) [-2.8196]
∆RD(-1) 0.2354 (0.2053) [1.1466] -0.4396 (0.1702) [-2.5935] ECT(-1) 0.1577 (0.1362) [1.1580] -0.4963 (0.1129) [-4.3967]
R2 0.1849 0.6880
F-Test 0.9072 8.8186
Diagnostic Tests
Statistics (P-Value) Statistics (P-Value)
LM 6.0736 (0.1937) 6.0736 (0.1937)
HET 7.2216 (0.9881) 7.2216 (0.9881)
NORM 2.6344 (0.6207) 2.6344 (0.6207)
Notes: LM, HET and NORM are the Lagrange multiplier statistics for serial correlation, heteroskedasticity and normality of residuals, respectively. ∆ and (-1) are the first difference operator and the first lag, respectively. ECT(-1) is the first lag of the error correction term.
Impulse-response analysis employed the response to Cholesky one standard deviation innovations. An impulse response function traces the effect of a one-time shock to one of the innovations on current and future values of the endogenous variables. While the responses of GDP per capita (constant 2005 US$) to research and development expenditure (% of GDP) are positive and about 1%. In addition, the responses of research and development expenditure to GDP per capita are positive at first years and then its responses increase. Namely, R&D are more sensitive to changes in GDP (see Figure 2). Results from VAR Granger Causality/Block Exogeneity Wald Tests indicate that there is an evidence of Granger Causality from GDP to RD, while there is no evidence of Granger Causality from RD to GDP (see Table 5). As real economic activities and growth rate increase, R&D must also increase for sustainability.
Figure 2. Impulse-Response Analysis
.00 .01 .02 .03 .04 .05
1 2 3 4 5 6 7 8 9 10
Response of GDP to RD
.00 .01 .02 .03 .04 .05 .06 .07
1 2 3 4 5 6 7 8 9 10
Response of RD to GDP
196 Table 5. VAR Granger Causality/Block Exogeneity Wald Tests
Null Hypothesis Chi-sq (df) Probability
RD ↛ GDP 2.2768 (1) 0.1313
GDP ↛ RD 7.9743 (1) 0.0047
↛ : Granger Non-Causality
6. Conclusion
It's not a coincidence that countries which allocate more resources to R&D are developed countries with high income levels. The significant relationship between technological developments, innovation and R&D activities, and economic growth is observed in many studies in the literature. In this study, the relationship between R&D expenditures and economic growth in Turkey was tested and explained with Johansen cointegration tests and vector error correction model by using the data for the period between 1998-2013. Empirical findings obtained suggest that there is causality from economic growth to R&D. As real economic activities and growth rate increase, R&D must also increase for sustainability.
Although information economy and sectors with high technology are very important for economic development, it is also obvious that achieving development and growth will not be easy without R&D. Technological development is an essential for efficiency increase and competitiveness, and R&D is an essential for technological development. Therefore, we have to place emphasis on R&D investments and get rid of economic dependency by reaching a position to produce our own technologies. Creating and spreading R&D consciousness is of vital importance in this process. Human capital investments must be encouraged, the collaboration between universities and industry must be developed and incentive facilities provided to companies and organizations, which will make R&D investments, must be revised and sustained. The state must increase R&D expenditures, allocate more resources to R&D activities; in this context, R&D expenditures, the rate of which is 0.95% in GDP per capita, must urgently be increased.
References
Aghion, P., Howwit, P. (1992). A model of growth through creative destruction. Econometrica 60(2), 323-351.
Altın, O., Kaya, A. (2009). Türkiye’de Ar-Ge Harcamaları ve Ekonomik Büyüme Arasındaki Nedensel İlişkinin Analizi. Ege Akademik Bakış 9(1), 251-259.
Awokuse, T.O., (2003). Is the export-led growth hypothesis valid for Canada? Canadian Journal of Economics, 36, 126–136.
Bilbao, B.O., Rodriquez P.A. (2004). From R&D to innovation and economic growth in the EU.
Gatton College of Business and Economics, University of Kentucky in its journal Growth and Change, 35(4), 434-455.
Bor, J.Y., Chuang Y.C., Lai, W.W., Yang, M.C. (2012). OECD A dynamic general equilibrium model for public R&D investment in Taiwan. Economic Modelling 27, 171-183.
Coe D.T., Helpman, E., Hoffmaister, A.W. (2008). International R&D Spillovers and Institutions.
IMF Working Paper WP/08/104.
Dickey, D.A., Fuller W.A. (1979). Distribution of the estimators for autoregression time series with a unit root. Journal of the American Statistical Association, 74(366), 427-431.
Enders, W. (2004). Applied Econometric Time Series, 2nd Edition. John Wiley & Sons: USA.
Evenson, R.E. (1997). Economic Growth, International Technological Spillovers and Public Policy: Theory and Empirical Evidence from Asia. Yale University, Economic Growth Center, Discussion Paper No. 777.
Falk, M. (2007). R&D spending in the high-tech sector and economic growth. Research in Economics, 61, 140-147.
Funke, M., Niebuhr, A. (2000). Spatial R&D Spillovers and Economic Growth-Evidence from West Germany. Hamburgiches Welt-Wirtschafts-Archiv Discussion Paper 98.
Genç, M.C, Atasoy, Y. (2010). Ar-Ge Harcamaları ve Ekonomik Büyüme İlişkisi: Panel Veri Analizi.
197 Gerybadze, A. (2010). R&D Innovation and Growth: Performance of the World’s Leading Technology
Corporations. Innovation and International Corporate Growth. 7, 11-30.
Grossman, G.M., Helpman, E. (1991). Innovation and Growth in the Economy. MIT Press, Cambridge, MA.
Gulmez, A., Yardimcioglu, F. (2012). OECD Ülkelerinde Ar-Ge Harcamaları ve Ekonomik Büyüme İlişkisi: Panel Eşbütünleşme ve Panel Nedensellik Analizi (1990-2010). Maliye Dergisi, 163, 335-353.
Horowitz, I. (1967). The Relationship Between Interstate Variations in the Growth of R&D and Economic Activity. IEEE Transactions of Engineering Management, EM-14, No.3.
Idea Consult (2008). A Time Series Analysis of the Development in National R&D Intensities and National Public Expenditures on R&D. http://ec.europa.eu/invest-in-research/pdf/download_en/spa4_final_report_final.pdf, (11.03.2014).
Johansen, S. (1988). Statistical analysis of cointegration vectors. Journal of Economic Dynamics and Control,12(4), 231-254.
Johansen, S., Juselius, K. (1990). Maximum likelihood estimation and inference on cointegration - with applications to the demand for money. Oxford Bulletin of Economics and Statistics, 52(2), 169-210.
Jones C.I., Williams, J.C. (1999). Too Much of a Good Thing? The Economics of Investment in R&D.
NBER Working Paper 7283. http://www.nber.org/papers/w7283, (11.03.2013).
Kim, L.W. (2011). The Economic Growth Effect of R&D Activity in Korea. Korea and the World Economy, 12(1), 25-44.
Korkmaz, S. (2010). Türkiye’de Ar-Ge Yatırımları ve Ekonomik Büyüme Arasındaki İlişkinin Var Modeli ile Analizi. Journal of Yasar University 20(5), 3320-3330.
Lucas, R. (1988). On the Mechanics of Economic Development. Journal of Monetary Economics, 22, 3-42.
Nadiri, M.I., Kim, S. (1996). International R&D Spillovers, Trade and Productivity in Major OECD Countries. NBER Working Paper 5801. http://www.nber.org/papers/w5801, (27.02.2013). Nunes, P.M., Serrasqueiro, Z., Leitao, J. (2012). Is there a linear relationship between R&D intensity
and growth? Empirical evidence of non-high-tech vs high-tech SMEs. Research Policy 41, 36-53.
Osterwald-Lenum, M. (1992). A note with quantiles of the asymptotic distribution of the maximum likelihood cointegration rank test statistics: Four cases. Oxford Bulletin of Economics and Statisitics, 54(3), 461-72.
Peng, L. (2010). Study on Relationship between R&D Expenditure and Economic Growth of China.
Proceedings of the 7th International Conference on Innovation & Management, 1725-1728. Pessoa, A. (2010). R&D and economic growth: How strong is the link? Economic Letters 107,
152-154.
Romer, P.M. (1990). Endogenous Technological Change. Journal of Political Economy, 98(5), 71-101.
Sadraoui, T., Ali, T.B., Deguachi, B. (2014). Economic Growth and International R&D Cooperation: A Panel Granger Causality Analysis. International Journal of Econometrics and Financial Management, 2(1), 7-21.
Samimi, A.J., Alerasoul, S.M. (2009). R&D and Economic Growth: New Evidence from Some Developing Countries. Australian Journal of Basic and Applied Sciences 3(4), 3464-3469. Segerstrom, P.S. (2000). The Long-Run Growth Effects of R&D Subsidies.
http://www2.hhs.se/personal/segerstrom/hor.pdf, (04.03.2014).
Solow, R.M. (1956). A Contribution to the Theory of Economic Growth. The Quarterly Journal of Economics, 70(1), 65-94.
Swan, T.W. (1956). Economic Growth and Capital Accumulation. Economic Record 32(63), 334-361. Şimşek, M., Behdioğlu, S. (2006). Araştırma-geliştirme (AR-GE) faaliyetlerinin Türkiye-OECD
ülkelerinde kümeleme analizi ile incelenmesi ve ekonomik büyümedeki önemi. İktisat İşletme ve Finans 21(245), 123-137.
198 Ulku, H. (2004). P.S. (2000). R&D, Innovation, and Economic Growth: An Empirical Analysis. IMF
Working Paper, WP/04/185.
Verbic, M., Majcen, B., Ivanova, O., Cok, M. (2011). R&D and Economic Growth in Slovenia: A Dynamic General Equilibrium Approach with Endogenous Growth. PanoEconomicus, 2011(1), 67-89.
Yanyun, Z., Mingqian, Z. (2004). R&D and Economic Growth-Panel Data Analysis in ASEAN+3 Countries. Seoul Conference 2004, Korea and the World Economy III.
http://faculty.washington.edu/karyiu/confer/seoul04/seoul04-papers.htm, (06.07.2014).
Zachariadis, M. (2004). R&D R&D-induced Growth in the OECD? Review of Development Economics, 8(3), 423-439.
http://www.turkstat.gov.tr/PreHaberBultenleri.do?id=16163
http://ec.europa.eu/eurostat/tgm/table.do?tab=table&plugin=1&language=en&pcode=t2020_20 http://www.tuik.gov.tr/PreHaberBultenleri.do?id=16163