Develop
1Gazi Faculty 2Kalecik Meh Corresponden
Received: Nov doi:10.11114/j
*This study w
Abstract
The aim of th physics lesson opinions of 10 these opinions opinions some tested on 698 analysis from anxiety, impor carrying out c observed that developed we
Keywords: ph
1. Introductio
The vision of fundamental t interactions b behaviors tow by the inform with themselv [MoNE], 2007 one part of s previously ob ‘affective prin learn physics important affe of the student science and in In measuring science, learn objectives the 2007; Krough Şentürk & Öz attitudes towa science lesson chemistry and projects in wh
pment of
of Education, met Doğan Sc nce: Pervin Ün
vember 10, 20 jets.v5i1.1974
was developed
his study was ns. The resear 05 high school s. Expert opini e items were c
high school s the data that w rtance, and sel confirmatory
the factor mo re calculated a hysics lessons,
on
f the 2007 Ph to life itself, w
etween ‘Physi wards themselv mation society, ves and in ha
7). From this v society. In fac
ligatory for 9t nciples’ of the have a great e ective areas ar ts but also eng n enhancing the
attitudes while ning science, a
e one most stu h & Thomson
zdemir, 2014) ards the subje ns were investi d biology lesso hich the attitud
an Attitu
Gazi Universi cience High Sc lü Yavaş, Gazi
016 Acc U
from the secon
to develop a L rch was carrie l students abou ions were soug corrected and tudents. The f were gathered lf-efficacy), wa
factor analysi odel is approp and it was deci , attitude scale
ysics Curricul who can solve ics, Technolog ves and the env
who can expr rmony with th vision it can b ct, the Physics th grade studen e 2013 Physics ffect on learni re attitude and
ages their affe eir motivation e teaching scie a topic or a the udied is the at
, 2005; Osbor ). In these stu ect of science. igated. What i ons. The studie des towards sci
ude Scale
Pervin Ünlü Y ity, Ankara, Tu chool, Ankara,i Faculty of Ed
cepted: Decem URL: http://dx.
nd author’s the
Likert type att ed out with h ut physics lesso ght for the lang some were ta factor structure d. The variance as 60%. The c s. Since the f priate. The Cr ided that the sc e, scale develop
lum in Turkey e problems the gy, Society and
vironment, wh ress their opin heir environm be inferred tha s Curriculum nts, were also s Curriculum t ing physics (M motivation. S ective qualities to learn scienc ence Reid (200 eme within les ttitudes toward rne, Simon & udies, attitudes
. There are al s meant here b es of Nuhoğlu
ience lessons a
towards
Yavaş1, Sultan urkeyTurkey ducation, Phys
mber 5, 2016 doi.org/10.111
esis.
titude scale fo high school st ons were obtai guage and con aken out of the
e of the scale w e of the scale, consistent betw fit indices of t ronbach-alpha
cale is reliable pment, high sc
y was to educ ey encounter b d the Environm ho possess the nions objective ment, and who at to learn phys
was updated made obligato that students’ MoNE, 2013). A
Science teachin s, has animpo
ce (Huyugüzel 06) speaks of ssons, and me ds the subject
Collins, 2003 s towards scie lso researches by science less
(2008), Shah a are investigate
Jo I
High Sch
n Çağan2sics Education
Online Pu 114/jets.v5i1.1
r high school tudents who w ined and then 5 ntent validity o
e scale. The d was ascertaine which consist ween the mode the scale ensu
reliability coe .
chool students
cate individual by using scien ment’, who ha e skills for info ely and in the o are productiv
sics should no in 2013 and ory for 10th gr
beliefs about As in other fie ng, which not ortant role in im
l Çavaş & Çav four objective thods within t of science (K 3; Pell & Jarv ence lessons w in which onl sons are either
and Mahmood ed; the analyse
ournal of Educa Vol. SSN 2324-805X Published URL
hool Phys
Department, A ublished: Dece 974 students with were studying55 scale items of these items. draft scale, wh ed by carrying ts of 28 items
l and the scale ure the accept efficients of th
ls who have in ntific methods,
ave developed ormation litera most efficient ve (Ministry o ot just be an is
physics lesso rade students. I whether or no elds, in science
only engages mproving stud vaş, 2014). es within, respe
the subject of Kaya, 2012; K vis, 2001; Rei were viewed a
ly the attitude general scienc d (2011) can be s of Bennett (2
ation and Trainin 5, No. 1; Janu X E-ISSN 2 by Redfame P L: http://jets.redf
sics Less
Ankara, Turkey
ember 11, 2016
regard to hig in Ankara. F were determin In line with th hich had 44 ite out explorato and 4 factors ( e data was obs tability criteria he factors of t
nternalized ph , who can ana d positive attitu acy which are
t way, who are of National E sue that conce ons, which w It is emphasize ot they will be e teaching too
the cognitive dents’ attitudes
ectively, the su science. Amo Kind, Jones & d & Skryabin as a sub-dime es of students
ce, or specific e given as exam 2001), Hançer ng Studies uary 2017 324-8068 Publishing fame.com
ons*
y. 6 h school First, the ned from he expert ems, was ry factor (interest, erved by a, it was the scaleand Yılmaz (2007), Kan and Akbaş (2005) can be given as examples of works which research attitudes towards chemistry lesson; the studies of Atik, Kayabaşı, Yağcı and Erkoç (2015), Ekici and Hevedanlı (2010), Koçakoğlu and Türkmen (2010), Pehlivan and Köseoğlu (2010) and Prokop, Tuncer and Cluda (2007) can be given as examples of projects in which attitudes towards biology lesson are researched, and the works of Demirci (2004), Kaya and Böyük (2011), Kurnaz and Yiğit, (2010), Özyürek and Eryılmaz (2001) and Tekbıyık and Akdeniz (2010) can be given as examples of ideas which investigate attitudes towards physics lesson. There are a number of studies that have researched the effects of a hypothesis, an approach, a method, a model or specific teaching activities on the attitudes of the students (Azar, Presley & Balkaya, 2006; Baran, 2009; Bilgin, 2006; Bozkurt & Aydoğdu, 2009; Korucuoğlu, 2008; Orçan, 2013; Taş, 2015; Türer & Kunt, 2015; Zacharia, 2003). The fact that there are a lot of such studies reveals the need for attitude scales.
In Turkey, some researches of attitude scale development and adaptation have been carried out with regard to physics lessons and subjects. An attitude scale aimed at introductory physics lessons was developed by Demirci (2004) and an attitude scale for lessons in introductory optics was developed by Kaya Şengören, Tanel and Kavcar (2006) for university students. From among the scale development studies carried out for high school students, Tekbıyık and Akdeniz (2010) can be considered as an attitude scale aimed at physics Kurnaz and Yiğit (2010) can be considered as an attitude scale aimed at physics, subjects related to physics and the studies that are carried out within these, and Taşlıdere and Eryılmaz (2012a) can be considered as an attitude scale aimed at the topic of simple electric circuits. Scale adaptation studies have also been carried out for high school students. Akyüz (2004) adapted attitude scales for the topic of heat and temperature; Kaya and Böyük (2011) adapted attitude scales towards physics lesson and physics experiments, and Taşlıdere and Eryılmaz (2012b) adapted attitude scales for optics lessons.
The aim of this study was to develop an attitude scale for students with regard to high school physics lessons. The content of the scale developed is important since it is different from the above-mentioned scales and can therefore be put to use by researchers as an alternative tool.
2. Method
The process of developing the attitude scale towards physics lessons consisted of four stages. These were: item-writing and creating a draft form, pre-practice studies, the practice stage and the analysis stage. These stages are discussed respectively below.
2.1 Item-writing and Creating a Draft Form
First, it was decided that the scale would be a Likert-type scale. To create the items for the Likert scale, 105 students studying in the 9th, 10th, 11th and 12th grades in an Anatolian high school in Ankara were asked to write sentences expressing their feelings and opinions with regard to physics lessons. Those sentences which could be used as an attitudinal item were determined by examining these writings and 55 scale items were created. While developing the items attention was paid to ensure that each item was written in simple language and was clear, that the sentences were not too long, and that each item only included one feeling or opinion. When scale items that had been used in the previous literature were examined it was seen that some of the items were extremely similar to the items obtained from the students’ writings (e.g. I like it, I get bored etc.) and that some of the items were aimed at university students. Hence no item was added to the item pool from the literature. In this way it was ensured that the factors which were going to be developed in the study were authentic. It was determined that the scale would consist of five grades. The gradations were “Strongly agree”, “Agree”, “Neutral”, “Disagree” and “Strongly disagree”, and a draft form was subsequently created.
2.2 Pre-practice Studies
To ensure the comprehensibility of these items in terms of language, the expert opinions of two Turkish language teachers were obtained, and for their appropriateness in terms of measuring the attitudes towards physics lesson, the expert opinions of three physics teachers and two physics education lecturers were obtained. Some items were corrected in line with the expert opinions and it was decided to take some items out of the scale. With the aim of determining the students’ comprehension of the 44 items that remained after the expert opinions, opinions were obtained from three students with high, medium and low achievement levels respectively, according to their physics exam results. The opinion of the lesson teacher was obtained as a basis for determining the success levels of the students. Each student was interviewed separately and they were asked how they understood each item. It was found that the students understood the items no differently than how they were meant to be understood.
Journal of Education and Training Studies Vol. 5, No. 1; January 2017
determine the students’ response time for the scale, the scale was practiced on 30 students and the response time was determined to be 20 minutes. However, to allow the students to answer all the questions on the scale, no rigid practices were enforced in terms of response times.
2.3 Practice Stage
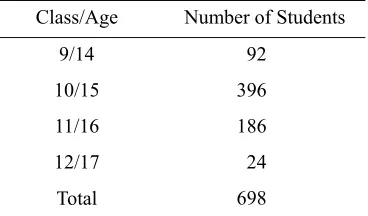
The item pool development stage was carried out with students who were studying in an Anatolian high school in Ankara. It was decided that the population of the research should consist of students studying in Anatolian high schools in Ankara. The sample was created according to the maximum variation sampling method so that it could best represent the province of Ankara. In the responding stage of the scale some parts of the implementation were managed in person by the teacher who was carrying out the research. The management of the other test, however, was given to the teachers of the classes in which they were going to be performed. Whether the teachers would carry out the test properly with regard to the method was instrumental in selecting the classes to make up the sample. The sample of the research consisted of students who were studying in the 9th, 10th, 11th and 12th grades of Anatolian high schools in six different areas of Ankara. The draft scale was practiced on 845 students. Some students were found to have answered questions without reading them, or were leaving too many questions blank; therefore the data from 147 students were excluded from the analysis. The distribution of the students by classes is shown on Table 1
Table 1. The distribution of the students who participated in the analysis with reference to their classes Class/Age Number of Students
9/14 92 10/15
11/16 12/17 Total
396 186 24 698
Since they were preparing for matriculation, an adequate number of twelfth grade students could not be found. A major part of the data excluded from the analysis consisted of that from ninth grade students.
2.4 Analysis Stage
The analysis of the data that were gathered following the implementation of the scale was carried out by exploratory and confirmatory factor analyses. The purpose of using exploratory factor analysis is to determine the implicit structure of the scale, and the purpose of using the confirmatory factor analysis is to verify the determined implicit structure (Seçer, 2015). In the exploratory factor analysis the factor structure of the scale is ascertained and the construct validity is viewed. In confirmatory factor analysis the construct validity is viewed with the verification of the previously determined scale factor structure (Büyüköztürk, Çakmak, Akgün, Karadeniz & Demirel, 2009). Exploratory factor analysis is used for the reliability of the scale, whereas confirmatory factor analysis is used for the reliability of the model (Şencan, 2005). The analysis was completed by calculating the reliability for the scale after factor analyses were completed.
2.4.1Exploratory Factor Analysis
Exploratory factor analysis helps the researcher to understand the relations between the concepts used within the data set by revealing the basic factors (relation structure) that belong to a data set which consists of a great number of variables that are related to each other (Coşkun, Altunışık, Bayraktaroğlu & Yıldırım, 2015).
To determine the factor structure of the scale, the data gathered from the implementation of the scale were analyzed by SPSS packaged software. The positive items which were used in the scale were graded as follows: Strongly agree (5 points), agree (4 points), neutral (3 points), disagree (2 points) and strongly disagree (1 point). However, the negative items were graded as strongly agree (1 point) and strongly disagree (5 points).
sample should reach a size sufficient to answer at least two of the criteria used in the literature (Çokluk, Şekercioğlu & Büyüköztürk, 2014). Since the sample of this study consisted of 698 individuals, it was large enough to cover at least two of these criteria.
The Kaiser-Meyer-Olkin (KMO) test and Bartlett’s Test of Sphericity measure of sampling adequacy was used to examine the appropriateness of factor analysis. The KMO test is the measure of sampling adequacy, which varies between 0 and 1. When this value comes out high it means that each and every variable in the scale can be estimated perfectly by the other variables in the scale. If the test result is bigger than 0.5, the factor analysis can be continued (Şencan, 2005, p.384). Kaiser (1974) stated that if that value is lower than 0.5 it is not acceptable, if it is in the 0.5’s it is miserable, in the 0.6’s it is mediocre, in the 0.7’s it is middling, in the 0.8’s it is meritorious, and in the 0.9’s it is marvelous. The KMO value attained from the present study is 0.953 and it is marvelous. The Bartlett’s Test gives the value of the chi-square statistics. As is in other chi-square tests, in this test the search is for the significance value. If the significance value is lower than 0.05, it means that the factor analysis can be carried out (Şencan, 2005). On the other hand, the Bartlett’s Test results of this study revealed that the chi-square value was significant ( 1). These values show that factor analysis can be continued to develop the scale.
Some criteria are used in the determination of the appropriate factor numbers for the scale to be developed. These are the eigenvalue, total variance explained and scree plot graphic, which is created based upon the eigenvalues of the factors (Büyüköztürk, 2002). The eigenvalue criterion is widely used, factors which have an eigenvalue of bigger than 1 are determined (Özdamar, 2016). The other criterion takes into consideration the variance rate explained by the factors. For example, if the load of a factor is 0.3, it shows that the explained variance is 9%. In determining the factor number, the explained variance rate is asked to cover 2/3 of the total variance (Büyüköztürk, 2002). The factor number is determined by lowering this rate to 60% in social and educational sciences and even to 50% in some research (Özdamar, 2016). The examination of the scree plot graphic is the last criterion in deciding the factor number. This graphic helps the factors to decrease by showing the dominant factors. In the graphic, the vertical axis shows the eigenvalues and the horizontal axis shows the factors, and the factor in which there are rapid declines shows the number of important factors (Çokluk et al., 2014). There are also other criteria in deciding the factor numbers (Şencan, 2005, Özdamar, 2016). However, the above-mentioned three criteria are used in this study.
In factor analysis the items which do not measure the same structure are eliminated. The loadings of the factors in which the items take place should be high. It is suggested that the factor load value should be 0.45 or higher but in practice the limit values can be as low as 0.30 (Büyüköztürk, 2016). The factor loadings in this study was considered to be >0.40. Another criterion in the elimination of items is that the item has a high value in one factor and low load values in other factors. It is suggested that except for the high load value an item gives to a factor, the difference between the load values it gives to another factor should be at least 0.10. In a multi-factor structure, the item which gives high load values to more than one factor is defined as a cross-loading item and it is appropriate to exclude this item from the scale (Büyüköztürk, 2016).
Rotation operations are used so that the solution can be interpreted after factorizing and so that scientific benefits can be improved (Çokluk et al., 2014). There are innumerable methods of rotation, but the most commonly used method is varimax. The aim of varimax rotation is to bring out the factor load variances at the uppermost by making the high ones higher for each factor and the low ones lower (Tabachnick & Fidell, 2013). The varimax rotation operation was used in this study.
2.4.2 Confirmatory Factor Analysis
Journal of Educ
A series of sta the computer freedom ( /d cases uncertai because of th uncertainties ( indices. Fit ind If the fit indic modifications 2.4.3 Reliabili It is appropri consistency, in strong relation consistent the measure the f coefficients o performed sep evaluation of not reliable, generally acce
3. Results
3.1 Results of It was explain analysis to pe analysis, the K result was For the factor gathered unde After taking in factor number
When the gra does not show other. For this which occur i
cation and Train
atistical value analyses, com df) rate. The ch
inties arise ab he inadequacy
(Şencan, 2005 dices and acce ces do not mee , which have e ity
iate to use th n determining ns with each o e items which factors of the of the factors, parately for e
the size of the 0.40< α<0.50 epted, 0.60< α<
f the Explorat ned in the met erform an exp KMO and the B
r analysis, the er 6 factors wh nto considerat r was examined
aphic is viewed w a significant
s reason it was in the scale to
ning Studies
is attained tha mplies with th hi-square value
out this, stemm of the sample 5). These param
eptance criteria et the acceptab emerged as a re
he alpha coeff the level of re other have a hi take place in
same feature which took t each dimensio e reliability co 0 low-level re
<0.75 highly r
tory Factor An thods section ploratory facto Bartlett’s test r 1 eigenvalues an hose eigenvalu
tion the factors d, which is the
d it is seen tha decline, and t s decided that o be gathered
at shows to wh he data structu e is should be s
ming from wh e size. Differe meters which a will be discu ble model fit it
esult of the ana
fficient, which eliability in a L igh alpha coeff the scale are (Tavşancıl, 2 their final form on by taking t
efficient for a eliable, 0.50< reliable, α≥ rel
nalysis that it was ne or analysis. In
results were co 1 showed that t nd the commu es are bigger t s whose eigen e scree plot gra
Figure 1. S at after the fift the contributio
the number of under 4 facto
hat extent the m ure. The most
small but since hether the stati ent statistical t
show the mod ussed in the fin t will be hard alysis, will be
h was develop Likert attitude ficient. The hi with each oth 2014). For this ms by factor their factor st scale in educa
α<0.60 medi iable to a perfe
ecessary to det order to dete onsulted. The f the factor anal unalities of the than 1. These 6 nvalues were b
aphic. The scre
Scree Plot Gra fth point the ge ns of the fifth f factors would ors was theore
model, which i basic statistic e it is responsi istics are sign techniques hav del’s accordanc ndings section a to redefine the examined (Ço
ped by Cronb scale. The sca gher the alpha her and it show
s reason the C analysis, are tructures into ational and soc ium-level reli fect level (Özda
termine that th ermine that the
fact that KMO lysis can contin e items were fi
6 factors expla bigger than 1, t ee plot graphic
aphic
eneral tendenc and other fact d be 4. The fa etically estima
Vo
is created as a al value is the ive to the size o ificant becaus ve been develo
ce to the data along with the e model. In thi okluk et al., 20
bach and is a ales which con a coefficient of
ws that they c Cronbach-alph calculated. R consideration cial sciences i able, 0.60< α amar, 2016).
he data were i e data were in O value is 0.953 nue to be carri irst of all calcu ained 62.588% the next criter c is given in Fi
cy of the graph tors to the vari act that it is ap
ated beforehan
l. 5, No. 1; Janu
result of the r e chi-square/d of the sample, e of poor mod oped because structure are c e results of the is case sugges 014).
criterion for nsist of items th f the scale is, t consist of item ha internal con Reliability anal n (Şencan, 200
s as following α<0.75 reliabl
in accordance n accordance 3 and the Bartl ied out. ulated. The ite % of the total v
rion in determi igure 1.
hic is horizont iance are close propriate for t nd. The factor
uary 2017
results of degree of in many del fit or of these called fit research. tions for internal hat show the more ms which nsistency lyses are 05). The : α<0.40 e in the
with the with the lett’s test ms were variance. ining the
which was determined as a result of the analysis was the same as the number previously estimated. It can be seen that the factor loadings of the items were between 0.347 and 0.810. The four items whose factor load values remained under 0.4 (items number 7, 26, 35 and 43) were excluded from the scale. Varimax rotation was performed to investigate the distribution of the remaining 40 items to the factors. After rotation, 12 items (items number 1, 10, 13, 14, 15, 21, 22, 24, 28, 34, 39 and 42) were excluded from the scale because they were cyclical items since they had less than 0.1 differences between the loads they gave to more than one factor. The eigenvalues, the variance percentages and the total variance percentages of the remaining 28 items are shown in Table 1.
Table 2. Total Variance Explained
Factor Eigenvalues % of Variance Cumulative %
1 11.406 40.736 40.736
2 3 4
2.865 1.425 1.229
10.231 5.089 4.389
50.967 56.056 60.445
The variance explained by the four factors constituted 60% of the total variance. According to Streiner (1994) the variance that remaining factors explain should be over 50%. The total variance rate which the factors of the developed scale explain was higher than this limit value.
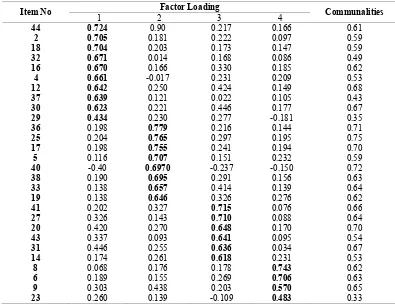
The factor pattern, the factor loadings of the items and the communalities that were attained as a result of the analysis are shown in Table 2.
Table 3. The Factor Pattern of the Attitude Scale towards Physics Lessons
Item No 1 2Factor Loading3 4 Communalities
44 0.724 0.90 0.217 0.166 0.61
2 0.705 0.181 0.222 0.097 0.59
18 0.704 0.203 0.173 0.147 0.59
32 0.671 0.014 0.168 0.086 0.49
16 0.670 0.166 0.330 0.185 0.62
4 0.661 -0.017 0.231 0.209 0.53
12 0.642 0.250 0.424 0.149 0.68
37 0.639 0.121 0.022 0.105 0.43
30 0.623 0.221 0.446 0.177 0.67
29 0.434 0.230 0.277 -0.181 0.35
36 0.198 0.779 0.216 0.144 0.71
25 0.204 0.765 0.297 0.195 0.75
17 0.198 0.755 0.241 0.194 0.70
5 0.116 0.707 0.151 0.232 0.59
40 -0.40 0.6970 -0.237 -0.150 0.72
38 0.190 0.695 0.291 0.156 0.63
33 0.138 0.657 0.414 0.139 0.64
19 0.138 0.646 0.326 0.276 0.62
41 0.202 0.327 0.715 0.076 0.66
27 0.326 0.143 0.710 0.088 0.64
20 0.420 0.270 0.648 0.170 0.70
43 0.337 0.093 0.641 0.095 0.54
31 0.446 0.255 0.636 0.034 0.67
14 0.174 0.261 0.618 0.231 0.53
8 0.068 0.176 0.178 0.743 0.62
6 0.189 0.155 0.269 0.706 0.63
9 0.303 0.438 0.203 0.570 0.65
23 0.260 0.139 -0.109 0.483 0.33
Journal of Education and Training Studies Vol. 5, No. 1; January 2017
indicator contributes to the variance to a high extent, but if it is closer to 0 then it means that the indicator contributes to the variance to a low extent (Çokluk et al., 2014). If the communalities is lower than 0.20 then that item is excluded from the scale and the analysis has to be performed once again (Şencan, 2005). It can be seen that the communalities of items on Table 2 have readings between 0.75 and 0.33. There were no problematic items in terms of communalities. The factors were named after the completion of the analysis. The factors were named by examining the items that had been placed in the factors. The names given to the items which had a similar content to those found in the literature were examined while labeling the factors. The items in the first factor consisted of statements about physics lessons such as “I like them, I think they are boring, I want to learn”. This factor was named “interest”. The items in the second factor consisted of statements about physics lessons such as worry, fear, playing truant, so this factor was named “anxiety”. The items in the third factor consisted of statements about physics lessons expressing that they are unnecessary, or related to everyday life, or a waste of time, so this factor was named “importance”. The items in the fourth factor consisted of statements about physics lessons such as “I know; I can understand them” which had meanings relevant to self-confidence, so this factor was named “self-efficacy”. The categorizing of the interest, importance and self-efficacy factors was inspired by the studies of Taşlıdere and Eryılmaz (2012a).
3.2 Results of Confirmatory Factor Analysis
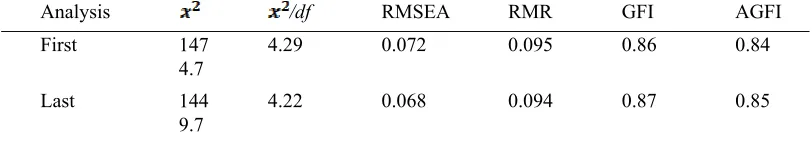
The factor model, which consisted of the 28 items and 4 factors attained by exploratory factor analysis and its consistent with the data structure, was examined by confirmatory factor analysis. The confirmatory factor analysis was carried out with the LISREL packaged software. The items that belonged to the factors attained by exploratory factor analysis were identified in the LISREL packaged software and a path diagram was drawn. When we look at the fit indices that were calculated for the appropriateness of the model we see that the value of /df was 4.66 and that it provided for the agreed value. In the case of ideal fit this value is expected to be 2 or less. On the other hand an /df value which is between 2 and 5 shows acceptable thresholds (Özdamar, 2016, p. 185). The modifications suggested by the analysis were applied at this stage and there was a minor improvement in the fit indices. The first analysis and the fit indices after the modification can be seen in Table 4.
Table 4. The fit indices of the model for the confirmatory factor analysis
Analysis /df RMSEA RMR GFI AGFI First 147
4.7
4.29 0.072 0.095 0.86 0.84
Last 144 9.7
4.22 0.068 0.094 0.87 0.85
Figure 3.3 Results of The Cronbach Cronbach-alph evaluated as h The Cronbach Table 5. The r
4. Discussion
In this study, the scale, whi students. The analysis. As a
e 2. The Confir f Reliability h-alpha reliabil
ha value betw highly reliable h-alpha reliabil reliability coeff
Factors Interes Anxiet Import Self-Ef an Attitude Sc ich it was dec data that wer a result of this
rmatory Factor
lity coefficient ween 0.60 and
e and a value w lity coefficient fficients and ev
s t ty tance fficacy cale towards P cided would b re gathered by analysis a fact
r Analysis Path
ts are calculate 0.70 is evalu which is 0.90 ts and evaluati valuations of th
Cronbac 0.881 0.906 0.898 0.707 Physics Lesson be a Likert sca y applying this tor structure th
h Diagram of t
ed to assess the uated as suffic
and over is e ons of the scal he factors ch-alpha
ns was develop ale, were deve s scale to 698 hat consists of
the Attitude Sc
e reliability of ciently reliable evaluated as ve
le factors are g
Evaluati High Very Hi High High ped for high sc eloped by eva 8 individuals w f 28 items and
cale towards P
the factors of e, a value betw
ery-highly reli given in Table
ion igh
chool students aluating the op were analyzed
4 factors was
hysics Lesson
the developed ween 0.70 and iable (Özdama
5.
(ASPL). The pinions of high d by explorator
formed. Conf s
scale. A d 0.90 is ar 2016).
Journal of Education and Training Studies Vol. 5, No. 1; January 2017
factor analysis was carried out for the model fit of this structure and it was found that the data of the scale were in consistent with the model. The construct validity of the scale was asserted by exploratory factor analysis, the reliability of the factors were calculated by the Cronbach-alpha coefficient and it was observed that the scale provides very high reliability for the anxiety factor and high reliability for other factors. The interest factor consists of 10, the anxiety factor consists of 8, the importance factor consists of 6 and the self-efficacy factor consists of 4 items. The reason that the self-efficacy factor has a lower reliability compared to the others is because this factor has fewer items. Necessary studies can be undertaken to further strengthen this factor in subsequent research.
When compared with the scales developed towards physics lessons and topics, ASPL maintains distinctness within the body of literature in terms of its extent, factors and appropriateness for high school students. In terms of their scope, in the physics attitude scales developed by Kurnaz and Yiğit (2010) and Tekbıyık and Akdeniz (2010), as well as the attitude items aimed at physics lessons, there are also items aimed at the field of physics as a whole. This study has tried to ensure that the ASPL consists of items that are only directed towards physics lessons and that the extent of this scale remains physics lessons alone. When compared in terms of factors, in the Physics Attitude Scale that was developed by Kurnaz and Yiğit (2010) it can be seen that there are three factors which take the form of ‘valuing physics’, ‘making physics habitual’ and ‘point of view towards physics’. The factor of ‘giving importance to physics’ in their scale resembles the importance factor of the ASPL but it is entirely different in terms of its item contents. The Physics Attitude Scale developed by Tekbıyık and Akdeniz (2010) consists of 30 items and 4 factors. The factors are named importance, comprehension, necessity and interest. The interest and importance factors in this scale have the same names as two of the factors in the ASPL. Though the items in the interest factor resemble those in the ASPL, the importance factor includes items that place importance mainly on physics and are therefore different from the importance factor in the ASPL. The Attitude Scale towards Simple Electric Circuits Subject developed by Taşlıdere and Eryılmaz (2012a) consists of 24 questions and 5 factors. The factors of this scale are interest, importance, interest related behavior, achievement-motivation, and self-efficacy. In terms of naming the ASPL factors, it provided some benefit in regard to the interest, importance and self-efficacy factors. Although there are some similar items when the items that constitute these factors are compared it can be seen that they consist of different items. The Attitude Scale towards Optics Lessons developed by Kaya Şengören and others (2006) consists of 43 items and 3 factors. The factors of the scale are liking, fear and valuing. The fact that there is a factor named ‘fear’ in this scale creates a distinctness when compared to other scales. Although the factor of fear in this scale reminds us of the anxiety factor in ASPL, it is quite different in terms of its items. The biggest difference is that in ASPL the anxiety factor has a strong position within the scale. In creating an item pool for ASPL, the scale drew only on the opinions of high school students and no item was added from the body of the literature. Thus, it was ensured that the scale is only aimed at high school students. ASPL can be used in further research to determine the attitudes of high school students towards physics lesson. With the results that will be attained, research can be carried out into the reasons why the students have these attitudes. ASPL is also a valid and a reliable scale that can be used in experimental studies in which changes in attitudes are investigated.
References
Akyüz, V. (2004). The effects of textbook style and reading strategy on students’ achievement and attitudes towards heat and temperature. Unpublished Master thesis. Ankara: Middle East Tecnical University.
Atik, A. D., Kayabaşı, Y., Yağcı, E., & Erkoç, F. Ü. (2015). The secondary school students biology science and course attitude scale: analysis of reliability and validity. Mehmet Akif Ersoy University Journal of Education Faculty, 36, 1-18.
Azar, A., Presley, A. İ., & Balkaya, Ö. (2006). Effect of multiple intelligence theory based instruction on students’ achievement, attitude, retention, and process skills. Hacettepe University Journal of Education, 30, 45-54.
Baran, M., & Maskan, A. K. (2009). The effect of project based learning approach on the second year’s pre-service physics teachers’ atitudes towards electrostatics. Dicle University Journal of Ziya Gökalp Faculty of Education, 12, 41-52.
Bennett, J. (2001). The development and use of an instrument to assess students’ attitude to the study of chemistry.
International Journal of Science Education, 23(8), 833-845.http://dx.doi.org/10.1080/09500690010006554
Bilgin, I. (2006). The Effects of Hands-On Activities Incorporating a Cooperative Learning Approach on Eight Grade Students’ Science Process Skills and Attitudes toward Science. Journal of Baltic Science Education, 1 (9), 27–37. Bozkurt, O., & Aydoğdu, M. (2009). A comparative analysis of the effect of Dunn and Dunn learning styles model and
traditional teaching method on 6th grade students’ achievement levels and attitudes in science education lesson. Elementary Education Online, 8(3), 741-754.
Theory and Practice, 32, 470-483.
Büyüköztürk, Ş. (2016). Sosyal Bilimler İçin Veri Analizi El Kitabı. Ankara: Pegem Akademi.
Büyüköztürk, Ş., Kılıç Çakmak, E., Akgün, Ö. E., Karadeniz, Ş., & Demirel, F. (2009). Bilimsel Araştırma Yöntemleri. Ankara: Pegem Akademi.
Büyüköztürk, Ş., Kılıç Çakmak, E., Akgün, Ö. E., Karadeniz, Ş., & Demirel, F. (2009). Scientific Research Methods. Ankara: Pegem Akademi.
Çokluk, Ö., Şekercioğlu, G., & Büyüköztürk, Ş. (2014). Multivariate Statistics for Social Sciences SPSS and Lisle
Practices. Ankara: Pegem Akademi.
Comrey, A. L., & Lee, H. B. (1973). A first course in factor analysis. NewYork: Academic Press.
Coşkun, R., Altunışık, R., Bayraktaroğlu, S., & Yıldırım, E. (2015). Research Methods in Social Sciences. Adapazarı: Sakarya Publishing.
Demirci, N. (2004). Students’ attitudes toward introductory physics course. Hacettepe University Journal of Education, 26, 33-40.
Ekici, G., & Hevedanlı, M. (2010). Examination of the attitudes of high school students towards biology course in terms of different variables. Journal of Turkish Science Education, 7(4), 97-109.
Hancer, A. H., Uludag, N., & Yilmaz, A. (2007). The evaluation of the attitudes of science teacher candidates towards chemistry lesson. Hacettepe University Journal of Education, 32, 100-109.
Hogarty, K. Y., Hines, C. V., Kromrey, J. D., Ferron, J. M., & Mumfor, K. R. (2005). The quality of factor solutions in exploratory factor analysis: The influence of sample size, communality, and over determination. Educational and
Psychological Measurement, 65(2), 202-226. https://doi.org/10.1177/0013164404267287
Huyugüzel, Ç. P., & Çavaş, B. (2014). Science Teaching. Anagün, Ş.S. & Duban, N. (Ed.). Affective Characteristics in Science Education: Attitude and Motivation. Ankara: Anı Publishing.
Kaiser, H. F. (1974). An index of factotial simplicity. Psycmetrika, 39(1), 31-36. https://doi.org/10.1007/BF02291575 Kan, A., & Akbaş, A. (2005). A Study of Developing an Attitude Scale towards Chemistry. Mersin University Journal of
the Faculty of Education, 1(2), 227-237.
Kaya, H. (2012). An investigation into upper elementary students’ attitudes towards science. European Journal of Physics Education, 3(2), 22-33.
Kaya, H., & Böyük, U. (2011). Attitude towards physics lessons and physical experiments of the high school students. European Journal of Physics Education, 2(1), 38-49.
Kaya, Ş. S., Tanel, R., & Kavcar, N. (2006). Development of attitude scale towards optics lessons. Pamukkale University Journal of Education, 20(20), 63-68.
Kind, P., Jones, K., & Barmby, P. (2007), Developing attitudes towards science measures. International Journal of
Science Education, 29(7), 871-893. https://doi.org/10.1080/09500690600909091
Kline, R. B. (2011). Principles and Practice of Structural Equation Modeling. New York: The Guilford Press.
Koçakoğlu, M., & Türkmen, L. (2010). Developing a biology attitude scale. Journal of Kırşehir Education Faculty, 11(2), 229-245.
Korucuoğlu, P. (2008). Evaluation of Correlation Between Scientific Process Skills’ Usage Level of Physics Teacher Candidates with The Attitudes Towards Physics, Gender, Class Level, and High School Type Which They Graduated From, Unpublished Master thesis. İzmir: Dokuz Eylül University.
Krough, L. B., & Thomson, P. V. (2005). Studying students’ attitudes towards science from a cultural perspective but with quantitative methodology: border crossing into the physics classroom. International Journal of Science
Education, 27(3), 281-302. https://doi.org/10.1080/09500690412331314469
Kurnaz, M. A., & Yiğit, N. (2010). Physics attitude scale: development, validity and reliability. Necatibey Faculty of Education Electronic Journal of Science and Mathematics Education, 4(2), 32-49.
Ministry of National Education (MoNE) (2007). Turkish High School Physics Curriculum, Ankara. Ministry of National Education (MoNE) (2013). Turkish High School Physics Curriculum, Ankara.
Journal of Education and Training Studies Vol. 5, No. 1; January 2017
Orçan, A. (2013). The effect of science-fiction stories developed by comics technique, on creative thinking skills and physics attitudes of students. Unpublished Master thesis. Ankara: Gazi University.
Osborne, J., Simon, S., & Collins, S. (2003). Attitudes towards science: a review of the literature and its implications.
International Journal of Science Education, 25(9), 1049-1079. http://dx.doi.org/10.1080/0950069032000032199
Özdamar, K. (2016). Scale and Test Development Structural Equation Modeling. Ankara: Nisan Publishing.
Özyürek, A., & Eryılmaz, A. (2001). Factors affecting students’ attitudes towards physics. Education and Science, 26(120), 21-28.
Pehlivan, H., & Köseoğlu, P. (2010). The reliability and validity study of the attitude scale for biology course. Procedia Social and Behavioral Sciences, 2, 2185–2188. https://doi.org/10.1016/j.sbspro.2010.03.304
Pell, T. & Jarvis, T. (2001). Developing attitude to science scales for use with children of ages from five to eleven years.
International Journal of Science Education, 23(8), 847-862.http://dx.doi.org/10.1080/09500690010016111
Prokop, P., Tuncer, G., & Chuda, J. (2007). Slovakian students’ attitudes towards biology. Eurasia Journal of Mathematics, Science & Technology Education, 3(4), 287-295.
Reid, N. (2006). Thoughts on attitude measurement. Research in Science & Technological Education, 24(1), 3-27. http://dx.doi.org/10.1080/02635140500485332
Reid, N., & Skryabina, E. A. (2002). Attitudes towards physics. Research in Science & Technological Education, 20(1), 67-81. http://dx.doi.org/10.1080/02635140220130939
Seçer, İ. (2015). Psychological Test Development and Adaptation Process. Ankara: Anı Publishing.
Şencan, H. (2005). Reliability and Validity in Social and Behavioral Measurements. Ankara: Seçkin Publishing.
Şentürk, E., & Özdemir, F. (2014). The effect of science centres on students’ attitudes towards science. International Journal of Science Education, Part B, 4(1), 1-24. http://dx.doi.org/10.1080/21548455.2012.726754
Shah, Z. A., & Mahmood, N. (2011). Developing a scale to measure attitude towards science learning among school students. Bulletin of Education and Research, 33(1), 71-81.
Streiner, D. L. (1994). Figuring Out Factors: The Use and Misuse of Factor Analysis. Canadian Journal of Psychiatry, 39(3), 135-140.
Tabachnick, B., & Fidell, L. S. (2013). Using Multivariate Statistics. Sixth Edition, Pearson Education Limited.
Taş, E. (2015). The effects of activity and gain based virtual material on students’ success, permanency and attitudes towards science lesson. Journal of Education and Training Studies, 3(5), 155-164. https://doi.org/10.11114/jets.v3i5.817
Taşlıdere, E., & Eryılmaz, A. (2012a). Development of attitude scale for simple electrical circuits and evaluation of attitudes of students. Journal of Turkish Science Education,9(1), 31-46.
Taslıdere, E., & Eryılmaz, A. (2012b). The relative effectiveness of integrated reading study strategy and conceptual physics approach. Research in Science Education, 42, 181-199. https://doi.org/10.1007/s11165-010-9194-1
Tavşancıl, E. (2014). Measuring Attitudes and Data Analysis with SPSS. Ankara: Nobel.
Tekbıyık, A., & Akdeniz, A. R. (2010). Physics attitude scale for secondary school students: development, validity and reliability. Journal of Turkish Science Education, 7(4), 134-144.
Türer, B., & Kunt, H. (2015). A Review of Relationship between Prospective Science Teachers’ Attitudes towards Science Education and Their Self-Efficacy. Journal of Education and Training Studies, 3(6), 166-178. https://doi.org/10.11114/jets.v3i6.983
Zacharia, Z. (2003). Beliefs, attitudes, and intentions of science teachers regarding the educational use of computer simulations and inquiry‐based experiments in physics. Journal of Research in Science Teaching, 40(8), 792-823. https://doi.org/10.1002/tea.10112
Copyrights
Copyright for this article is retained by the author(s), with first publication rights granted to the journal.