Issues
ISSN: 2146-4138
available at http: www.econjournals.com
International Journal of Economics and Financial Issues, 2016, 6(S6) 60-66.
Special Issue for "IPN Conferences, May 2016"
A Strategy to Increase the Competitiveness of Leading Industries
in Central Java Province to Face ASEAN Economics Community
2015
Fafurida Fafurida
1, Avi Budi Setiawan
2*, Setyani Irmawati
31Department of Economics, Semarang State University, Indonesia, 2Department of Economics, Semarang State University,
Indonesia, 3Department of Economics, Semarang State University, Indonesia. *Email: [email protected]
ABSTRACT
The competitiveness of industry in the Central Java Province need to increased in view of the implementation of the ASEAN Economics Community (AEC) is getting closer.The purpose of this research are identifying leading industry in Central Java Province, knowing condition of leading industry competitiveness, and formulating strategy to improve that industry’s competitiveness to face AEC 2015. Results of this research shows that leading industry in Central Java Province are beverage, tobacco processing, textile, apparel, wood, printing, furniture and other processing industry. Textile, apparel, wood, printing, and furniture industry has competitiveness, both at national and ASEAN. The strategy formulated among others S-O strategies that optimize the use of local raw materials and the appropriate technologies, W-O strategies that improve production efficiency, S-T strategy is to improve the quality of products and ensure the supply of raw materials continuously and W-T strategy is provide incentives to industry are increasing the proportion of local raw materials.
Keywords: ASEAN Economics Community, Competitiveness, Leading Industry JEL Classifications: R11, R50, R58
1. INTRODUCTION
Economics globalization require each countries to have a high competitiveness to compete with other countries. To improve global competitiveness, several countries in a region establishs a domestic economic integration. Arifin (2008) said, an agreement of integration are needed to achieve a larger market access and boost the economics growth to arise the prosperity of countries member.
According to the statement above, a countries in south east asia agreed to implement ASEAN Economics Community (AEC) in the end of 2015. AEC 2016 are expected to bring a new hopes and obstacles to Indonesia (Djaafara, 2012).
In the othe side, AEC offers a larger market access, incentive for increasing production scale and efficiency, and raising works opportunities. However, many peoples worried about the low level of Indonesian competitiveness index compare to other countries.
Nowadays, AEC has been implemented. However, according to World Economic Forum (2014) and United Nations Industrial Development Organization (2010), Indonesia still under competitive comparing to ASEAN countries. Regionally, Central Java provinces has a highly potential industry scale. This indicated by domestic gross domestic product manufacturing of industry sector who placed on third rank in Java Island base on BPS measurement.
is prove to the nett export of Central Java Provinces who placed on the last rank in Java Island.
Djaafara (2012) state that AEC will beneficial if local industry could compete with another ASEAN countries, moreover if the target is a regional market. Therefore, it is important to create a strategies to increase the competitiveness of industry sector in Central Java Provinces. And also, it could provide an alternativesolutions to improve the competitiveness for Central Java local industries to face AEC in the beginning of 2016. Finally, the beneficial of AEC implementation will affected by all of the economic actors.
According to the research problems, this research aims to identified a types of manufacturing industries that become a leading industries in Central Java Provinces. This research also purpose to formulate a strategy to increase the competitiveness of industry sectors. The research result are expected to conduct a strategies who can be implemented to improve the competitiveness.
2. LITERATURE REVIEW
2.1. The Theory of Growth Pole and the Growth CentrePerroux and Boudeville defined that the growth pole as the industrial group which can drive the economic growth of a country since the industries have the strong forward and backward linkages with the superior industry. They said that the industry group tend to choose the centralized location in the big cities which is supported by the strong hinterland area. The growth pole, the city centre and the development axis are the main type of concentration pole (Vinuela-Jimenez et al., 2010).
Perroux (1970) said that the economic growth would not appear in various areas in the same time. The growth only happens in several places which is calles the growth center. The theory of the growth centre is in the development process, there will be a leading industry which can be the main driver of regional economic development. Since the linkage among industries is tight so the development of the leading industry will affect the development of other industries which have the close relationship with it.
The theory of growth pole also states that the centralized industry in a region will accelerate the economic growth. The centralized industries will makes the different consumption pattern among regions. Therefore, the industry development in a region will affect the development of other regions.
This theory also states that the economy is the combination of active industrial system (leading industry) and passive industry (the industry which depends on the leading industry or the growth pole). The developed and active region will actively affect the passive regions.
The growth pole will make the trickling down and polarization effects on an economic growth. These effects were found by Hirschman (1958). He argued that the disimilarity potential of natural resources among regions will make the each region grow
heterogenity. To grow faster, a country needs to choose one or more economic growth centres which have the strongest potencies.
If the strong regions grow up, it will influence the weak regions. This growth spread will affect positively (trickling down effect), i.e., the strong development and give more jobs/employment in weak regions. Then, the weak region can produce the complementry product of the strong region’s products. Whereas; the negative effect (polarization effect) happens if the production activities in the strong region are competitive with the same product produced in the weak region, which actually needs the guidance.
2.2. Economics Base Theory
The theory states that economic growth in a region depends on its ability to export the goods or services. North (1975) in Temenggung (1999) argued that the regional economic growth in long-term depends on its export industry. The main power of regional growth is the demand of produced and exported good and services. The demand from the outside will affect the using of capital, labour and technology to produce the export commodity. So, it will create the economic backward or forward linkages.
Hoover (1984) stated that the growth of several base sectors could decide the comprehensive regional economic growth, whereas; the non-base sectors only became the consequences of regional development. The base sectors commodities which are exported will give the regional income and increase the consumption and investment. The increasing income does not only make the demand increase on the base sectors but also demand increase on non-base sectors which consequently push the non-base sectors investment. The using of economic base theory on this study is intended to identify the development sectors either on base or non-base sectors in a region.
3. DATA AND ESTIMATION TECHNIQUE
3.1. DataThe data compilation method in this research is a literature review. This method used to compile a secondary data such quantitative and qualitative information. This research also set an interview session to guess the external and internal factors that affecting towards leading industries in Central Java Province.
3.2. Estimation Technique
One of the analysis method is location quotient and shift share. These analysis needs to decide the leading industries. Then, revealed comparative advantage (RCA) analysis that used to know the competitiveness each industries for facing AEC. And finally, strengths, weaknesses opportunities, threat (SWOT) analysis will complete this research to arrange an strategies to increase the competitiveness of industry sector in AEC era.
4. EMPIRICAL RESULT
4.1. SWOT Anyalisisto minimize weaknesses and threats. This analysis needs SWOT matrix and these matrix could provide four strategy possibilities. The Figure 1 tells the SWOT matrix regarding to the research.
4.2. Result
An industries will become a leading sectors if it have a competitive and comparative advantages. If the static location quotient and dynamic locationa quotient >1, it means that sector has a comparative advantages. While competitive advantages had showed with Cij that is worth positive.
According to the analysis inTable 1, it concluded that the leading sector in Central Java Province is a beverages, tobacco manufacturing, textile, clothing, wood, printing, furniture and others manufacturing. Kusumantoro (2009) states the most active of industry activities in Central Java is food and beverages, textile, wood and chemical. In addition, the local government also classify textile industry and furniture as a leading sectors in Central Java Provinces in accordance with the industrial ministry rules No. 146/M-IND/PER/12/2012.
4.3. The Analysis of Leading Industry in Central Java Province to Face AEC 2016
The competitiveness of leading industry in Central Java Provinces could be seen base on the competitiveness in national and ASEAN level. In addition to compete with other provinces in Indonesia, the leading industries in Central Java also compete with similar industries from ASEAN countries in AEC 2016.
Figure 2 explains the beverages industry has a competitiveness in the national level. It shows with the RCA averages point that more than 1. The competitiveness also became stronger that characterized by RCA index who tend to increase. However, in the ASEAN level, the industry could not compete because the RCA point is <1. The competitiveness in the ASEAN level also tend to decrease slightly due to the downward of RCA point.
Tobacco industry does not has a competitiveness in national and ASEAN level because the RCA averages is <1 in accordance to the Figure 3. However, the competitiveness tend to increase sharply in national and ASEAN level, due to the RCA index that tend to arise.
Table 1: The comparation between location quotient and shift share analysis of industry in Central Java Provinces from 2007 to 2012
Code KBLI Type of industry Average of SLQ DLQ Cij Criteria
10 Food industry 0.699 0.570 −1,612,706,195,560 Not superior
11 Beverages industry 1.476 1.252 48,339,645,032 Superior
12 Tobacco manufacturing industry 5.214 1.085 861,012,633,923 Superior
13 Textile industry 3.552 1.233 954,075,888,316 Superior
14 Clothing industry 1.797 1.079 142,367,610,862 Superior
15 Leather and socks industry 0.226 1.126 23,514,069,328 Not superior
16 Wood industry 2.556 2.390 851,809,413,283 Superior
17 Paper industry 0.325 0.947 4,758,585,279 Not superior
18 Printing industry 1.199 2.273 175,420,225,254 Superior
19 Coal and oil industry 0.217 0.155 −29,388,215,168 Not superior
20 Chemical industry 0.280 0.459 −584,586,753,612 Not superior
21 Pharmacy industry 0.920 1.117 71,018,065,177 Not superior
22 Rubber and plactic industry 0.569 0.953 28,650,993,708 Not superior
23 Mining exclude metal industry 0.821 1.215 152,274,097,833 Not superior
24 Basic metal industry 0.365 0.952 7,180,029,181 Not superior
25 Metal exclude machine industry 0.261 1.313 60,497,673,295 Not superior
26 Computer, electronics and optic 0.239 1.196 31,216,170,154 Not superior
27 Electrical equipment industry 0.104 0.636 −44,213,397,956 Not superior
28 Machine and equipment industry 0.555 0.190 −265,582,967,243 Not superior
29 Motoric vehicle industry 0.158 2.588 115,455,434,768 Not superior
30 Others vehicle industry 0.194 1.135 26,611,500,080 Not superior
31 Furniture industry 3.063 1.126 95,391,705,941 Superior
32 Others manufacture industry 1.090 2.511 138,858,428,280 Superior
33 Machine setting and reparation services 0.791 0.504 −28,409,718,930 Not superior
Source: Central Statistic Bureau of Central Java and Indonesia (2007-2012), data processed. SLQ: Static location quotient, DLQ: Dynamic locationa quotient
Source: Rangkuti (2009)
IFAS
EFAS
STRENGTHS (S) Decide the strength of internal factors
WEAKNESS (W) Decide the weaknesses of internal factors OPPORTUNITIES (O)
Decide 5-10 opportunities factors
STRATEGY S-O Create a strategies using the strengths to utilize the opportunities
STRATEGY W-O Create a strategies to minimize weaknesses and to utilize an opportunities THREATS (T)
Decide 5-10 opportunities factors
STRATEGY S-T Create a strategies using the strengths to overcome the threats
STRATEGY W-T Create a strategy to minimize weaknesses and avoid threats
Base on the Figure 4, a textile industry in Central Java has a competitiveness in national level, even in ASEAN level. Therefore, in ASEAN the competitiveness tend to increase because the strengthen of RCA index. However, the competitiveness has nationally decreasing.
Then the Figure 5 explains the clothing industry performance in Central Java. Actually, clothing industry has a competitiveness
nationally and in ASEAN level due to the RCA point that more than 1. Unfortunately, the competitiveness has slightly decreasing. That condition shows by the RCA index that often decrease in the last 4 years.
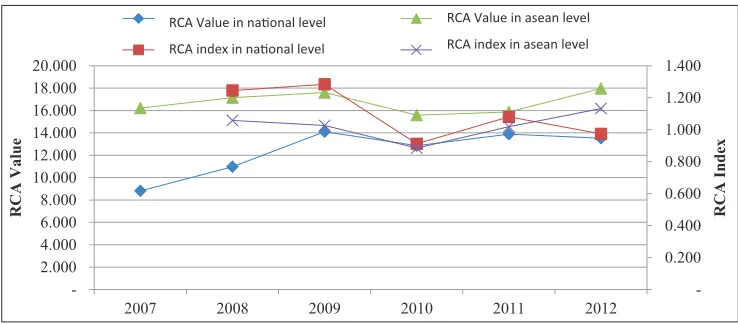
The competitiveness of wood industry had a same condition with clothing industry. It shows at Figure 6. Actually, wood industry has a competitiveness nationally and in ASEAN level due to the RCA
Figure 2:Beverages industry competitiveness index
Source: Central Java Central Statistic Bureau (2007-2012) and UN Comtrade Database, the data processed by researcher
Figure 3:Tobacco industry competitiveness index
Source: Central Java Central Statistic Bureau (2007-2012) and UN Comtrade Database, the data processed by researcher
Figure 4: Textile industry competitiveness index
point that more than 1. However, the competitiveness has slightly decreasing. That condition shows by the downward of RCA index.
According to the Figure 7, Printing industry competitiveness had a same condition with clothing and wood industry. These industry has a competitiveness nationally and in ASEAN level due to the RCA point that more than 1. However, the competitiveness has slightly decreasing. That condition shows by the downward of RCA index.
Furniture industry is a one of the biggest industry in Central Java Provinces. The data shows in Figure 8 above. These industry has a competitiveness nationally and at ASEAN level. It shows with the RCA point that more than 1. In ASEAN, the competitiveness are strengthen cause the RCA index are increasing. However, the different condition just happen nationally. The competitiveness index of furniture industry decreased slightly.
4.4. The Analysis of Strategy to Increase the Leding
Figure 5: Clothing industry competitiveness index
Source: Central Java Central Statistic Bureau (2007-2012) and UN Comtrade Database, the data processed by researcher
Figure 6: Wood industry competitiveness index
Source: Central Java Central Statistic Bureau (2007-2012) and UN Comtrade Database, the data processed by researcher
Figure 7:Printing industry competitiveness index
Figure 8: Manufacture industry competitiveness index
Source: Central Java Central Statistic Bureau (2007-2012) and UN Comtrade Database, the data processed by researcher
Internal factors
External factors Strengths
(S) Weakness (W)
1. Supporting from financial institution towards production sectors
2. Already improve the infrastructure facility 3. The product has guaranteed by Indonesian
national standard
4. One stop services. 5 Good economics climate
6. An opportunity for a brand new industries to enter the market
7. A large number of raw material but have not been maximize
8. Government incentive towards textile industries to upgrade the technology 9. Human capital training program 10. Certified to legalize the wood as a raw
material
11. Have the biggest wood industries
1. Weak infrastructure quality at port 2. Expensive logistic cost
3. Increasing price of energy cost 4. There was a gap between researcher
and industries
5. Rely on import of raw material 6. There are unclear regulation of
water management system 7. Low productivity of textile
industries due to inefficient machine 8. Limited of electricity
9. Over supply of textile industry 10. A limited of downstream industry
that produce a raw material to the leading industry
11. Industrial park have not support
the investment climate
12. Low quality of human resources
Opportunities (O) Strategi S-O Strategi W-O
1. Large of market potential 2. No tariff obstacles 3. Online export services
4. Laboratory references for food and beverages in Asean
level
5. Involved at the fair in region and overseas to promote local product
6. A prohibition of raw wood export
7. In several part of industries already operating a high technology
8. A big potential of wood as a raw material
9. A new central park of industry had been established 10. Already built a natural gas station to fulfil the electricity
1. Guaranteeing all of food ad beverages laboratory test in Asean level
2. Improve the quality of one window sevices to increase the brand new industry 3. Utilize online media to boost import 4. Promotion strategy
5. Control the stock at warehouse 6. Make a cooperation and agreement
between industries with human resources supplier
7. Optimizing wood materials to make a creative handycraft
8. Implement the applied technology
1. Repair the port infrastructure 2. Cut the supply chain to optimizing
the distribution line
3. Improve the production efficiency 4. Launch a consistent regulation to
make sure the market certainly 5. Improve education quality to boost
the human resources ability
Threats (T) Strategy S-T Strategy W-T
1. A large numbers of competitor
2. A better quality product of competitor countries 3. The competitors price is cheaper due to not rely on raw
materials import
4. The logistic cost for competitors is cheaper
5. The quality standard of import purpose country is higher 6. The damaged forest issues due to deforestation
7. More competency of Asean labour than local
8. A stigma from international market that Indonesian wood industry uses illegal wood as a raw material
9. Local people prefer to consump an import product
1. Increase the product quality
2. Make a research and development to maximize agriculture commodity as a good quality of raw material.
3. Improve a partmership between farmers
and industries
4. Product diversification 5. Upgrade the machines
6. Guaranteeing the SVLA implementation to boost the wood industry
7. Socialization towards society to use a local product
8. Make it sure the raw material supply
1. Maps the logistic needs 2. Learnt the the others country to
downgrade the logistic price 3. Gives an incentive to the import
substitution industries
4. Gives an incentives to the industry that uses local raw materials 5. Gives an incentives to the industry
that implement research and development
6. Train the employers to increase their productivity
Industry Competitiveness in Central Java Provinces to Face AEC 2016
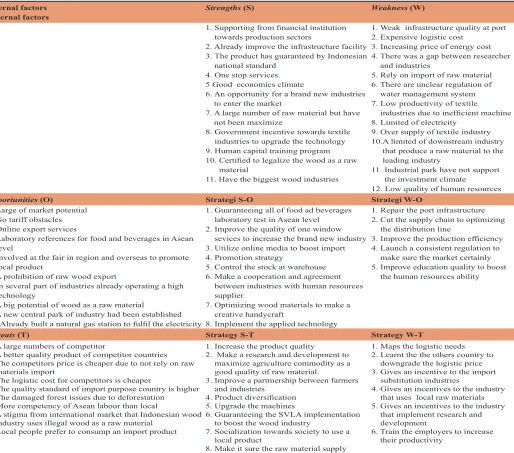
A strategy to increase the leading sectors industry to face AEC arranged by internal and external findings that obtained from the research. The strategies formulated in SWOT matrix that combined the internal and external factors.
Base on the SWOT matrix in the Figure 9 above. There is a four of possibilities strategies that possibly implemented to increase the competitiveness of leading industry in Central Java. The strategies has choosen in accordance with the condition of each industries.
5. CONCLUSION
According to the research, a leading Industries in Central Java provinces is beverages, tobacco, textile, clothing, wood, printing, furniture and others manufacturing industries. A textile, clothing, wood, printing and furniture have a competitiveness in ASEAN level. Beverages industry has a competitiveness in national level. However, its industry does not compete in ASEAN level. While tobacco industry does not compete in national and ASEAN level. The competitiveness level of almost leading industries are decrease slightly.
The strategy formulation such S-O strategy i.e., optimizing local raw materials and applied technology. W-O strategy i.e. increase the production efficiency and improve the education quality. S-T i.e., increase the product quality and make sure the supply of raw materials. And W-T strategies i.e., maps the logistic facilities and increase the local material proportion.
Regarding to the research result, there are several recommendation i.e., (1) focuss on the development of leading industries. However, non-leading industries should be improved, (2) maintain the leading industries performances that already has a competitiveness in the other side, the government should support the less competitiveness industries to has a competitiveness in the future, (3) improve the quality product, and (4) use an update data for the next research and use more complex data analysis for the better quality of research.
REFERENCES
Arifin, S., Rizal A.D., dan Aida S.B., editors. (2008), ASEAN Economics Community (AEC) 2015 Strenghtening Synergy ASEAN in the Middle of Global Competition. Jakarta: Elex Media Computindo. Bank of Indonesia. (2008), Profile and Mapping of Regional
Economics Competitiveness Each region in Indonesia. Jakarta: Rajawali Pers.
Central Java Bureau of Statistics. (2007), Central Java Export Statistic. Semarang: Badan Pusat Statistik Provinsi Jawa Tengah.
Central Java Bureau of Statistics. (2011), Central Java Export Statistic. Semarang: Central Java Bureau of Statistics.
Central Java Bureau of Statistics. (2012), Central Java Export Statistic. Semarang: Central Java Bureau of Statistics.
Central Java Bureau of Statistics. (2012), Statistic of large and medium manufacture industry in Central Java Province Book I. Semarang: Badan Pusat Statistik Provinsi Jawa Tengah.
Direktorat Jenderal Industri Agro (2015). Peraturan Direktur Jenderal Industri Agro Nomor 20/IA/PER/3/2015 Tentang Petunjuk Teknis Pelaksanaan Kegiatan Melalui Dana Dekonsentrasi Pengembangan Industri Agro Unggulan Daerah Direktorat Jenderal Industri Agro Tahun 2015. Jakarta: Direktorat Jenderal Industri Agro.
Djaafara, R.A. (2012), ASEAN Economic Community 2015. Hamonization Process in the Middle of Competition. Jakarta: Bank Indonesia.
Hirschman, A.O. (1958), The Strategy of Economic Development In Developing Countries. New Haven, Connecticut, USA: Yale University Press.
Hoover, E.M. (1984), An Introduction to Regional Economics. 2nd,3rd ed.
New Yark: Knopf.
Indonesia Federal Reserves. (2013), Economics Statistic of Indonesia. Indonesia Federal Reserves,
Kusumantoro, K. (2009), Disparity and specialization of manufacturing industry regions in central java provinces. Jurnal Ekonomi dan Kebijakan, 2(2):104-113.
Kuncoro, Mudrajad. (2012). Regional Planning: How to develop Local Economics, Urban and Region?. Jakarta: Salemba Empat.
North, G.R. (1975), Theory of Energy-balance Climate Model. Journal of The Atmospheric Science. 32 (11). 2033-2043.
Perroux, F. (1970), Economic space: Theory and applications. Quarterly Journal of Economics 64, 89-104.
Rangkuti, F. (2009), SWOT Analysis: A Technic for Explore Business Case. Jakarta: Gramedia Pustaka Utama.
Temenggung, S.A. (1999), Regional Economics Paradigm: Theoretical purpose and Regional Economics Practise and Development Policy Implication, on BTS. European Planning Studies, 8 (4), 487-501. Tambunan, Tulus T.H. (2001), Indonesian Economics Transformation: A
Theory and Empirical Findings. Jakarta: Salemba Empat.
UN Comtrade Database. Available from: http://www.comtrade.un.org/ data/. [Last accessed on 2015 Jun 17].
United Nations Industrial Development Organization. (2010), Competitive Industrial Performance Index. Available from: http://www.unido.org/ data1/Statistics/Research/cip. html. [Last accessed on 2014 Dec 25]. Vinuela-Jimenez, A., Rubiera-Morollon, F. and Cueto, B. (2010), An
analysis of urban size and territorial location effects on employment probabilities: The spanish case. Growth and Change 41(4), 495-519. Warpani, Suwardjoko. (1980), Region and Urban Analysis . Bandung:
Penerbit Institut Teknologi Bandung.