The Thirty-Third AAAI Conference on Artificial Intelligence (AAAI-19)
Predicting and Analyzing Language Specificity in Social Media Posts
Yifan Gao,
∗‡Yang Zhong,
∗‡Daniel Preot¸iuc-Pietro,
♦Junyi Jessy Li
†‡Department of Mathematics,†Department of Linguistics, The University of Texas at Austin
{yifan233@,yang.zhong@,jessy@austin.}utexas.edu ♦Bloomberg LP
Abstract
In computational linguistics, specificity quantifies how much detail is engaged in text. It is an important characteristic of speaker intention and language style, and is useful in NLP ap-plications such as summarization and argumentation mining. Yet to date, expert-annotated data for sentence-level speci-ficity are scarce and confined to the news genre. In addition, systems that predict sentence specificity are classifiers trained to produce binary labels (general or specific).
We collect a dataset of over 7,000 tweets annotated with specificity on a fine-grained scale. Using this dataset, we train a supervised regression model that accurately estimates speci-ficity in social media posts, reaching a mean absolute error of 0.3578 (for ratings on a scale of 1-5) and 0.73 Pearson correlation, significantly improving over baselines and previ-ous sentence specificity prediction systems. We also present the first large-scale study revealing the social, temporal and mental health factors underlying language specificity on so-cial media.
1
Introduction
Texts vary in their levels of detail and their involvement of particular concepts, objects and events, i.e., theirspecificity. Consider the two posts below from Twitter; the first one is very specific, while the other is rather general:
[1]:I was eating a cookie over the trashcan to catch the crumbs. One of the chocolate chips jumped ship. I considered diving after it. #Finals
[2]:How curious that I, looking at you, am thinking exactly what you, looking at me, are thinking and yet... we both cannot understand
Specificity is a pragmatic concept of text whose signif-icance spans across various fields of research. Studies in cognitive linguistics showed that the organization of gen-eral and specific information in text impacts reading com-prehension speed (Dixon 1987). In discourse analysis, speci-ficity is connected with several discourse relations (Mann and Thompson 1988; Prasad et al. 2008), making it a co-herence device. Several works also highlighted the role of
Copyright c2019, Association for the Advancement of Artificial Intelligence (www.aaai.org). All rights reserved.
* Equal contribution.
specificity in serving effective communication, e.g., in polit-ical discourse (Cook 2016), argumentation (Swanson, Ecker, and Walker 2015) and classroom discussions (Luo and Lit-man 2016; Lugini and LitLit-man 2017). Prior work in clinical psychology explored potential links between specificity and autism (Li et al. 2017).
Findings from these studies, though encouraging, relied on either hand-coded analysis of limited scale, or sen-tence specificity prediction systems (Li and Nenkova 2015; Lugini and Litman 2017) that are trained to produce 2-3 cat-egories of specificity sentences, which is too coarse to be analyzed (Li et al. 2016). Furthermore, the only open-source tool (Li and Nenkova 2015) is trained from news sentences, a genre vastly different from the spontaneous and expres-sive text from social media which can reveal more about the writer (Schwartz et al. 2013). Because of these bottlenecks, our understanding of text specificity and its relationship with an individual’s traits, as well as its utility in automated text processing, is still in its infancy.
To this end, we first introduce a large dataset of 7,267 tweets annotated with text specificity on a fine-grained scale of 1-5. The tweets are sampled from an existing dataset with demographic information such as age, gender, education, income, political ideology, and religion obtained through survey-based methods (Preot¸iuc-Pietro et al. 2017), making it ideal for large-scale sociolinguistics studies. The dataset is also sufficiently large to train supervised systems for ficity prediction that enable the automatic analysis of speci-ficity in informal, spontaneous text. Our dataset and system are openly available online.2
Using this dataset, we train regression models that can ac-curately estimate the specificity of tweets. The models use hand crafted features that capture the lexical, content, and emotional aspects of the data. Our system achieves a mean absolute error of 0.3578 and 0.73 Pearson correlation, sub-stantially improving upon several baselines and existing sys-tems for sentence specificity.
We also present a series of analyses that reflect the cial and temporal dynamics of language specificity on so-cial media. We uncover that specificity is significantly as-sociated with demographic factors such as age and educa-tion level. Specificity displays distinct temporal patterns that
2
vary throughout the day as a reflection of different activities. Finally, we observe that specificity is related to depression— a major mental health issue: moderately and severely de-pressed people are more likely to tweet with less specificity. In sum, this work presents a dataset, a predictive model and insights that advance the computational modeling of text specificity as well as our understanding of its various inter-actions with social and temporal factors.
2
Related Work
Louis and Nenkova (2011a) developed the first sentence specificity prediction system. They repurposed discourse re-lation annotations (Prasad et al. 2008) as training data to classify whether sentences are general or specific. Li and Nenkova (2015) later developed and open-sourced an im-proved system. However, both studies used the same news sentences with binary labels as training data. In reality, analyses involving text specificity routinely use real-valued estimates (from classifier posterior probabilities), instead of the predicted binary labels (Louis and Nenkova 2011b; Swanson, Ecker, and Walker 2015; Cook 2016; Luo and Lit-man 2016; Kleinberg et al. 2017). The intuition of treating specificity as a real-valued variable conforms with findings from Li et al. (2016). Recently, Lugini and Litman (2017) predicted specificity of classroom discussion conversations; however they also used coarse labels (low/medium/high specificity), and the system and data are not available.
Our data annotation effort is partly inspired by Li et al. (2016) and Li et al. (2017), who annotated sentence speci-ficity on a fine-grained scale and reported good agreement. Li et al. (2017) further demonstrated two potential demo-graphic and psychological factors that influence the percep-tion of specificity. However these studies are limited to a small number of manually analyzed news sentences; our work contributes a large scale dataset. We analyze multiple demographic, mental health and temporal factors.
3
Data
We first present a corpus of tweets annotated with speci-ficity. We follow insights from Li et al. (2016) who argued that specificity should be annotated on a fine-grained scale. The tweets are sampled from an existing data set, introduced and used in past research (Preot¸iuc-Pietro et al. 2017), where users self-reported demographic information. The data col-lection process received approval from the Institutional Re-view Board (IRB) of the University of Pennsylvania. We an-notated 7,267 tweets for analysis and modeling.
3.1
Data Sampling
We sample tweets from users who have posted at least four tweets. From each user, we uniformly sample 2 tweets that contain at least 3 unique tokens. Re-tweets are ex-cluded as they mostly carry information posted by others and would thus impact the demographic analysis. URLs and usernames are replaced by special tokens following Cachola et al. (2018). All emojis are preserved and can be viewed in a browser. There are a total of 7,330 tweets sampled from 3,665 users.
3.2
Demographic Information
The user demographics from our dataset are obtained using surveys and include gender, age, faith, political ideology, an-nual income, and education level.
Genderis represented as a binary value with 0 for Male
and 1 for Female.
Age is an integer value calculated by taking the differ-ence between the year when the tweet is posted and the self-reported year of birth.
Faithis represented as an ordinal variable with 6
differ-ent levels to measure the degree of a user’s participation in religious events. The value is the frequency a user attends religious events in a week ranging from 1 (“Never”) to 6 (“Multiple times a week”).
Political ideologyis measured over the US
conservative-liberal spectrum: Very conservative (1), Conservative (2), Moderately conservative (3), Moderate (4), Moderately lib-eral (5), Liblib-eral (6), Very liblib-eral (7); Other (8) and Apa-thetic (9) (Ellis 2012). Users whose political ideology is ei-ther “Oei-ther” or “Apathetic” are excluded from the dataset following Preot¸iuc-Pietro et al. (2017).
Annual incomeis measured with 8 values ranging from
“less than $20,000” to “more than $200,000”.
Education levelis measured as an ordinal variable that
represents the highest degree obtained, from 1 (“No high school degree”) to 6 (“Most advanced degree, e.g. PhD or MD”).
3.3
Data Annotation
Instructions for annotating specificity are based on sentence specificity annotation from Li et al. (2016). Specific instruc-tions for each coding option are as follows:
1 = Very General: posts that do not make references to
any specific person, object or event, e.g.,“Always too much.”
2 = General: posts that make references to a
per-son, object or event, but rely on the personal, spatio-temporal or external context to understand, e.g.,“I’ve been waiting all of August for tomorrow.”
3 = Specific: posts that make references to a person,
object or event, and can be mostly understood even with some missing information, e.g.,“So many people at the Turner Center. That will be over by next week.”
4 = Very specific: posts that mention concrete persons,
objects or events, and do not rely on any context to un-derstand or to identify the subjects and actions in the post, e.g.,“The dance this morning on GMA with Ali-cia Keys made my day”
5 = Extremely Specific: posts that mention concrete
persons, objects or events, and do not rely on any con-text to fully understand and, additionally, provide sig-nificant levels of detail, e.g.,“Mascara is the most com-monly worn cosmetic, and women will spend an aver-age of$4,000 on it in their lifetimes”
1.0 1.5 2.0 2.5 3.0 3.5 4.0 4.5 5.0 score
0 100 200 300 400 500 600
count
Figure 1: Distribution of specificity of annotated tweets.
of at least90%. Furthermore, for each worker we calculate their Cronbach’s alpha (Cronbach 1951) of their ratings with the consolidated rating and exclude those whose alpha val-ues are below 0.3, which we analyzed to be of low qual-ity. Each tweet was annotated by at least 5 workers after all quality control measures. The intra-class correlation coeffi-cient is 0.575, indicating moderate agreement (Koo and Li 2016). The Krippendorf’s Alpha (interval) value is 0.507, again moderate agreement (Artstein and Poesio 2008), on par with other annotations using non-expert crowds (Hol-gate et al. 2018). Finally, we exclude tweets where more than half of the annotators mark as not understandable. This yields a total of 7,267 qualified tweets posted by 3,665 users. The consolidated specificity rating for each tweet is the average of the ratings from each annotator. The distribution of rated specificity is summarized in Figure 1. Clearly, most tweets are of mid-specificity, i.e., they contain a mixture of general and specific information. The graph is bell-shaped, similar to that found in Li et al. (2016). This further war-rants datasets and systems that do not treat sentences as ei-ther general or specific.
4
Predicting Specificity
We develop and evaluate a regression model to predict lan-guage specificity of tweets.
4.1
Model Training
Unlike prior work that trainedclassifiersto predict sentence specificity (Louis and Nenkova 2011a; Li and Nenkova 2015; Lugini and Litman 2017), we train aregressionmodel that treats specificity as a continuous value. Specifically, we use Support Vector Regression (SVR) with Radial Basis Function (RBF) kernel3 for sentence specificity prediction.
We experimented with other models, including linear regres-sion, SVR with linear kernel, and neural networks that use CNNs and LSTMs to generate tweet representations. They all led to significantly worse performance on our develop-ment set.
3
Implemented with Scikit-Learn.
4.2
Features
We design features to capture lexical, semantic, and emotion aspects of tweets.
Surface and lexical features Since specificity captures
“the quality of belonging or relating uniquely to a particular subject” (from Oxford Dictionary), we use named entities as one feature group. Indicators of named entities from seven categories (Location, Person, Organization, Money, Percent, Date, and Time) are included. We use the Stanford Name Entity Recognizer (Finkel, Grenager, and Manning 2005) to extract these features.
Word categories are very useful in identifying discourse relations related to specificity (Li and Nenkova 2016). For example, specific sentences contain more proper nouns and general sentences contain more adjectives. We extract part-of-speech (POS) tags using the Stanford POS Tag-ger (Toutanova and Manning 2000) with a pre-trained twit-ter model (Derczynski et al. 2013). We then group POS tags into eight categories: determiners, nouns, proper nouns, pro-nouns, adjectives, prepositions, and punctuation. For each category, we calculate the number of tags in that group pre-sented in a tweet as a feature.
We also derive a concreteness score for each tweet as a feature. Concreteness reflects the degree to which the con-cept expressed by a word refers to a percon-ceptible entity, hence reflecting word specificity. We use the lexicon from Brys-baert, Warriner, and Kuperman (2014) consisting of 37,058 English words rated from 1 (very abstract) to 5 (very con-crete). The tweet concreteness score feature is calculated by taking the average of the concrete score of each word (if present in the lexicon).
Finally, we use several string surface features from Li and Nenkova (2015): the length (number of tokens) in a tweet (in general longer sentences carry more information); av-erage word length (to measure the complexity of a tweet on word level); percentages of capital letters, numbers, and non-alphanumeric symbols including punctuation marks
(special symbols and capital letters are more likely to be-long to a particular entity). In our experiments, we use tweet length as one of the baselines.
Distributional word representations To capture the
overall content of a tweet, we average the embeddings of words in the tweet; this method is simple yet shown to be surprisingly effective in many text classification tasks (Coates and Bollegala 2018; Iyyer et al. 2015). We use the pre-trained GloVe word embedding of 27 billion tokens trained on 2 billion tweets (Pennington, Socher, and Man-ning 2014)4.
We also use Brown clusters as features, which prior work showed to be effective in both sentence specificity predic-tion (Li and Nenkova 2015) and social media classifica-tion tasks (Preot¸iuc-Pietro et al. 2015a; Holgate et al. 2018). Brown clusters partition words into compact word clusters
4
where words in adjacent positions are likely to appear in the same context. We use pre-computed Brown clusters from Turian, Ratinov, and Bengio (2010). Those clusters are com-puted on the RCV1 corpus with roughly 37 million words of news text. This feature group is represented as the count of words in each cluster mentioned in a given tweet normalized by the tweet length.
Social media content We capture sentence features that
are prominent in social media posts, including indicators of URLs and mentions of other Twitter users (@users). The presence of these features may indicate an existing context of the post, which can impact specificity of utter-ances (Djalali et al. 2011). For URLs, we include an indica-tor variable of whether an URL is present. For tweets with user mentions, we further categorize them into two classes: whether a tweet is a reply to another user or not. To approx-imate reply tweets, we simply check if an @user is men-tioned at the beginning of a tweet.
Emotion features We also explore if emotional
fea-tures carry additional specificity information, as prior work showed that subjectivity and adjectives may indicate a lack of specificity (Li and Nenkova 2015; 2016). In social me-dia posts, emotion is manifested in both words and emojis. To this end, we include features as follows: (1) indicators of positive and negative words, using Hu and Liu (2004)’s sentiment lexicon of around 6,800 English words labeled as either positive or negative; (2) the percentage of tokens that are emojis.
4.3
Settings
We use the dataset described in Section 3 for training (5,767 examples), validation/development (500 examples) and test-ing (1,000 examples). The dimension for word embeddtest-ings and the number of Brown clusters are 100, tuned on valida-tion set.
Three baselines are used to benchmark our model:
1. Average: the average annotated specificity from the
train-ing data, since most of the probability mass of specificity distribution concentrates in the middle (c.f. Figure 1).
2. Length: using tweet length as the only feature in the SVR
model.
3. Speciteller: using the only available sentence specificity
predictor (Li and Nenkova 2015) trained on news cor-pora. Speciteller returns its posterior probabilities, so we multiply the results by 4 and add 1 to fit our scale of 1-5.
4.4
Results
For evaluation, we report the mean absolute error (MAE) values and the Pearson correlations with annotated speci-ficity on the test set. We also perform Wilcoxon signed-rank test on the absolute errors for each tweet for model compar-ison and feature ablation. Results are shown in Table 1.
Overall, our model performs significantly better than all baselines and achieves a MAE of 0.3578 (with the highest
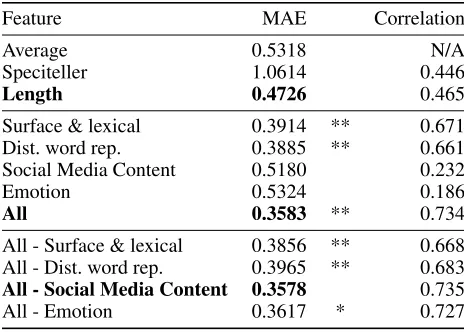
Feature MAE Correlation
Average 0.5318 N/A
Speciteller 1.0614 0.446
Length 0.4726 0.465
Surface & lexical 0.3914 ** 0.671 Dist. word rep. 0.3885 ** 0.661 Social Media Content 0.5180 0.232
Emotion 0.5324 0.186
All 0.3583 ** 0.734
All - Surface & lexical 0.3856 ** 0.668 All - Dist. word rep. 0.3965 ** 0.683
All - Social Media Content 0.3578 0.735
All - Emotion 0.3617 * 0.727
Table 1: Baseline and supervised training results (MAE and Pearson correlations). Showing significance testing results for: individual feature vs. best baseline; all vs. best baseline; all vs. excluding each feature group. (*) p<.05, (**) p<
.01 using Wilcoxon on absolute errors.
possible value of 4.0). This is 32.72% lower than just pre-dicting the average specificity, and 24.29% lower than using sentence length alone. Correlation reaches 0.73, a strong re-lation with the annotated specificity and at least 0.27 greater than the best baseline approach.
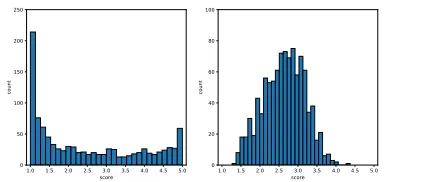
Among the baselines, sentence length (SL) is the best pre-dictor, indicating that long text is one of the most important factors for it to be more detailed. The MAE of Speciteller is much higher than the others, but the correlation is not con-sistently lower. A possible explanation is that Speciteller, as a classifier, aims to predict a binary value of either specific or general. Figure 2 shows that the posterior distribution of Speciteller is highly polarized, making the distribution par-ticularly inadequate at estimating specificity whose values are more concentrated around the mid-range (Figure 1). This effect is less obviously noticed from correlations.
For the four groups of features, using any of them individ-ually significantly outperforms all baselines (p <0.01). Dis-tributional word representations perform the best; however surface and lexical features perform comparable to word representations (<0.01difference in MAE).
The feature ablation study shows that all groups except Social Media Content bring significant predictive power to the model. Removing surface/lexical or word representation features has a significant impact on the MAE: excluding those two features increases the error by 7.6% and 10.66% respectively. Emotion feature themselves are not powerful, but removing them results in significantly worse predictions, hence they are valuable to the model. Finally, Social Media Content related features such as URLs and user mentions does not bring additional predictive power to the model. These findings show that specificity is mostly related to se-mantic content and word use.
4.5
Qualitative Analysis
Tweet Score Speciteller Length Our Model
IM HYSTERICALLY CRYING IM SO PROUD OF THEM 1.86 4.91 2.33 2.15
<USER>Its November!!!!! Crunch Time Bro!!!! Lets Do It!!! #Cueupu 2.43 4.92 2.96 2.37
just reached level 15 on Paradise Island on my Android <URL> #Android #Androidgames
3.63 3.77 2.50 3.59
I’m at Macadams Bar & Grill (5833 SW Macadam Ave, Portland)<URL> 4.25 4.96 2.86 3.87
Table 2: Examples from testing results with their predictions.
1.0 1.5 2.0 2.5 3.0 3.5 4.0 4.5 5.0 score
0 20 40 60 80 100
count
1.0 1.5 2.0 2.5 3.0 3.5 4.0 4.5 5.0 score
0 50 100 150 200 250
count
Figure 2: Distribution of specificity on 1,000 testing data. Left: Speciteller (rescaled); right: Our model.
shown in Figure 1. Figure 2 shows the distribution of pre-dictions from Speciteller (left) and our model (right). No-tice that the result from Speciteller is highly polarized. More than 51% of tweets are rated in the range 1.00 to 1.50 and 4.50 to 5.00 when the mean is calculated as 2.47. In our model, the average is computed to be 2.64 and more than 66% and 96% of scores fall within one or two standard de-viation from the average. The shape is much more similar to the distribution from human judgments.
Next we show some examples from the testing set to il-lustrate the difference in predictions, shown in Table 2. The first two examples illustrate the domain discrepancy that led Speciteller to mispredict specificity. For the first tweet, Spe-citeller gives an extremely high score 4.91, indicating that this tweet is very specific. However, this tweet has an av-erage rating of only 1.86, which is rather general. This is possibly because all letters in the tweet are upper cases. The number of capitalized letters is used as a feature in Spe-citeller. In news (where Speciteller was trained), text is well-formated, so capital letters are good approximations for spe-cific named entities. In social media posts however, capital letters can often be used for expression of emotion, as in this tweet, or emphasis. Speciteller also made an extremely spe-cific (4.92) prediction for the second tweet. This is because the tweet consists of 13 symbols: the number of symbols is again a feature in Speciteller, motivated by the style of news sentences. In social media text, symbols—like capital letters—have different pragmatic functions.
Examples 3 and 4 illustrate how length alone can be in-adequate to estimate specificity. The length baseline gives the two tweets scores of 2.50 and 2.86 respectively, which results in absolute errors of 1.13 and 1.39. In general, sen-tence length is positively related to text specificity. The lim-ited length of these tweets (13 and 14 tokens in total,
com-w/o length control length controlled
Corr. p-value Corr. p-value
Gender -0.002 0.91 -0.021 0.26
Age 0.219 2.5e-33 0.181 5.2e-23
Faith 0.004 0.82 0.008 0.64 Politics 0.011 0.55 -0.002 0.88 Income 0.005 0.77 0.002 0.89 Education 0.064 4.8e-4 0.036 0.045
Table 3: Partial correlation controlled by age and gender be-tween each feature and specificity scores (with and without controlling by sentence length). Bold font denotes signifi-cance (α= 0.01/6)with Bonferroni correction.
paring with average tweet length of 15.25 in annotated data) restricted the baseline model from assigning higher scores. Combining length with other features led to a much more accurate prediction.
5
Analysis
We now present the first analysis uncovering social and tem-poral factors that influence text specificity in social media. The first two studies in this section are done using annotated data, as there are enough data for a large-scale analysis. The third study looks into the relation between mental health (de-pression) and specificity, and is a use case for our regression model as we have a limited number of tweets associated with user mental health information.
5.1
Demographics and Specificity
Demographic traits have been shown to be reflected through writing style in social media (Rao et al. 2010; Burger et al. 2011; Schwartz et al. 2013; Preot¸iuc-Pietro et al. 2015b). We first consider the influence of user demographic traits on tweet specificity.
0 5 10 15 20 Hour
0 50 100 150 200 250 300
Count
Figure 3: Tweet count over hour on annotated data.
Table 3 shows the original and length controlled correla-tion analyses. Significance results are presented with Bon-ferroni Correction. Without controlling for length, age and education level are significant factors with positive correla-tion, showing that older and more educated people tend to post tweets with more details. The result that age is pos-itively correlated to specificity corresponds to Pennebaker and Stone (2003)’s finding that certain linguistic categories (e.g., word length, sentence length) are linearly related to age. Education is correlated with reading levels, which in turn is partially reflected by an individual’s vocabulary size and difficulty of words used. After controlling for length, the correlations between specificity and age/education decrease slightly although the statistical significance for age remains. This indicates that older people not only post longer tweets, but also presented more specific content.
We do not find significant correlations between text speci-ficity and other demographic traits, including gender, faith, political ideology, and income level.
5.2
Time and Specificity
Temporal variation of text style has been studied before to bring new insights into psychological behavior (Flekova, Ungar, and Preot¸iuc-Pietro 2016). We now present insights from a temporal analysis of text specificity, exploring influ-ences of the hour of day when a tweet is posted.
We first extract the exact posted time from the tweet meta-data (obtained via Twitter API). Since the post time of tweets are stored in UTC, we convert it back to user local time by checking self-reported time zone from the meta-data. Tweets with unknown time zone are excluded. 4,716 tweets in our specificity dataset are recovered to their local post time. Figure 3 is a histogram of number of tweets posted across hour-of-the-day. The number of tweets posted at each hour steadily increases during the day, with a slight decrease ap-pearing around lunch break. The number peaks after dinner, then decreases during the night hours.
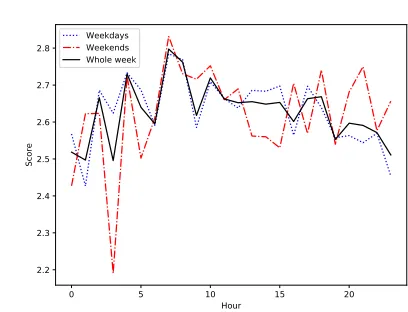
To illustrate the influence of time over the specificity of posts, we plot the average specificity with posting hour (scaled from 0 to 23). Figure 4 shows three distributions of
0 5 10 15 20
Hour 2.2
2.3 2.4 2.5 2.6 2.7 2.8
Score
Weekdays Weekends Whole week
Figure 4: Distribution of specificity scores over hours on an-notated data.
Time Interval Entire week Weekdays Weekends
before dawn 2.581 2.595 2.548 early morning 2.733 2.722 2.771
morning 2.657 2.646 2.691
afternoon 2.637 2.651 2.598 early evening 2.640 2.638 2.644 late evening 2.552 2.526 2.624
Table 4: Average specificity score over time intervals on an-notated data.
average specificity: (1) of each hour (solid black line); (2) for weekdays only (dotted blue line); (3) for weekends (dash red line).
Clearly, the relation between specificity and time is not linear. In particular, the specificity of tweets posted from night till dawn is lower than those posted during day-time. For those that are posted during the night, notice that the drop in the frequency of tweets between midnight and early morning does not mean that people are express-ing less details—in fact, the specificity of early mornexpress-ing posts are much higher than those from evenings (when people tweet most frequently). The average tweet speci-ficity increases dramatically at around 7-9 am. This increase matches with Shellenbarger (2012)’s summary over tweet posting trend that people choose to read and write longer and positive emotional tweets to refresh at the beginning of each day.
0 5 10 15 20 time
2.1 2.2 2.3 2.4 2.5 2.6 2.7 2.8 2.9
score
Not Depressed Depressed
Figure 5: Specificity scores over hours in people with defer-ent depression conditions.
from before dawn to early morning (mostly before work), conforming with the per-hour analysis earlier.
When comparing weekdays vs. weekends (the type of ac-tivities people engage in are typically different), the levels of details engaged in Twitter posts are strikingly similar. This is illustrated in Table 4. That said, people tend to write less specific tweets during weekend afternoons and before dawn, and more specific ones after dinner. During weekdays, there is a significant drop (p= 0.002) in text specificity between early evening and late evening; this can presumably due to change of activities (work vs. leisure) that happen more of-ten during weekdays than weekends.
5.3
Depression and Temporal Changes in
Specificity
Temporal activity patterns are also related to mental health, with insomnia or hypersomnia being one of the diagnos-tic criteria for depression (Association 2013). Having found that the production of text—engaging a lot of details vs not—varies across time, we also aim to uncover interactions between time, specificity and depression.
Specifically, a subset of 538 users in our dataset took the Beck Depression Inventory-II (BDI-II) questionnaire (Beck, Steer, and Brown 1996) to assess depression tendencies. BDI-II is one of the most widely used inventory for mea-suring the level of depression for people older than 13. It contains 21 questions and each answer is scored for 0 to 3. The raw score is scaled from 0 to 63 and is interpreted as 4 different classes from minimal to severe depression.
Since we do not have enough tweets annotated for these users (only 1,065), we usepredictedspecificity for this anal-ysis. For each user, we sample up to 100 tweets5and label them with our best model.
First, we inspect whether there is any general relationship between depression level and the level of details engaged by an individual. We calculate the partial Pearson correla-tion between depression level and specificity controlled by
5
The median # tweets posted by these users is 621.5.
age and gender. We observe a small, negative correlation of−0.01with both categorized depression levels (c.f. Sec-tion 3.2) and raw BDI-II scores. The correlaSec-tions are sta-tistically significant using two-tailed t-test. This is a weak indication that the more depressed a user is, the less specific their tweets.
The trend is much clearer between people without depres-sion and those who are moderately or severely depressed when we also observe temporal changes. A total of 349 users who filled out the depression inventory with correct time zone information are sifted out. We have 95 users in the moderately/severely depressed group and 197 users in the non-depressed group. Again, we sample up to 100 tweets from each users and label tweet specificity using our model. Figure 5 depicts the average specificity versus hours in the day for the two groups; there is significant difference on the specificity of posts (Wilcoxon signed-rank test,p= 3.43e−05), showing that people with moderate or severe depression tend to write less specific posts. In addition, the scores among depressed people have a larger variance (0.057 vs. 0.052), with a substantial spike in the morning (around 7 am) and a larger drop in the afternoon (around 2 pm).
6
Conclusion
This paper presented an analysis and a prediction model for language specificity of social media posts. We collected a dataset of 7,267 tweets labeled for specificity on a 5 point scale. We built a regression model for tweet specificity pre-diction, achieving a mean absolute error of 0.3578 (max pos-sible value is 4), significantly better than baselines. Social and temporal analyses over the dataset showed that speci-ficity interacts with age and education, and displays distinct patterns throughout the day. Applying our model on men-tal health analysis revealed that people with moderate/severe depression would write less specific social media posts.
References
Artstein, R., and Poesio, M. 2008. Inter-Coder Agreement for Computational Linguistics. Computational Linguistics
34(4):555–596.
Association, A. P. 2013. Diagnostic and statistical manual of mental disorders (DSM-5)R . American Psychiatric Pub.
Beck, A. T.; Steer, R. A.; and Brown, G. K. 1996. Beck Depression Inventory-II. San Antonio78(2):490–498. Brysbaert, M.; Warriner, A.; and Kuperman, V. 2014. Con-creteness Ratings for 40 thousand generally known English Word Lemmas.Behavior Research Methods46(3):904–911. Burger, D. J.; Henderson, J.; Kim, G.; and Zarrella, G. 2011. Discriminating Gender on Twitter. EMNLP, 1301–1309. Cachola, I.; Holgate, E.; Preot¸iuc-Pietro, D.; and Li, J. J. 2018. Expressively Vulgar: The socio-dynamics of Vulgar-ity and its Effects on Sentiment Analysis in Social Media. COLING, 2927–2938.
Cook, I. P. 2016. Content and Context: Three Essays on Information in Politics. Ph.D. Dissertation, University of Pittsburgh.
Cronbach, L. J. 1951. Coefficient Alpha and the Internal Structure of Tests.Psychometrika16(3):297–334.
Derczynski, L.; Ritter, A.; Clark, S.; and Bontcheva, K. 2013. Twitter Part-of-Speech Tagging for All: Overcoming Sparse and Noisy Data. RANLP, 198–206.
Dixon, P. 1987. The processing of organizational and com-ponent step information in written directions. Journal of Memory and Language26(1):24.
Djalali, A.; Clausen, D.; Lauer, S.; Schultz, K.; and Potts, C. 2011. Modeling Expert Effects and Common Ground Us-ing Questions under Discussion. InAAAI Fall Symposium: Building Representations of Common Ground with Intelli-gent AIntelli-gents.
Ellis, C. 2012. Public Ideology and Political Dynamics in the United States. American Politics Research40(2):327– 354.
Finkel, J. R.; Grenager, T.; and Manning, C. 2005. Incor-porating non-local information into information extraction systems by Gibbs sampling. ACL, 363–370.
Flekova, L.; Ungar, L.; and Preot¸iuc-Pietro, D. 2016. Ex-ploring Stylistic Variation with Age and Income on Twitter. ACL, 313–319.
Holgate, E.; Cachola, I.; Preot¸iuc-Pietro, D.; and Li, J. J. 2018. Why swear? Analyzing and inferring the intentions of vulgar expressions. EMNLP, 4405–4414.
Hu, M., and Liu, B. 2004. Mining and Summarizing Cus-tomer Reviews. KDD, 168–177.
Iyyer, M.; Manjunatha, V.; Boyd-Graber, J.; and Daum´e III, H. 2015. Deep Unordered Composition Rivals Syntactic Methods for Text Classification. ACL, 1681–1691.
Kleinberg, B.; Mozes, M.; Arntz, A.; and Verschuere, B. 2017. Using Named Entities for Computer-Automated Ver-bal Deception Detection. Journal of Forensic Sciences
63(3):714–723.
Koo, T. K., and Li, M. Y. 2016. A Guideline of Selecting and Reporting Intraclass Correlation Coefficients for Reliability Research.Journal of Chiropractic Medicine15(2):155–163. Li, J. J., and Nenkova, A. 2015. Fast and accurate prediction of sentence specificity. AAAI, 2281–2287.
Li, J. J., and Nenkova, A. 2016. The Instantiation Discourse Relation: A Corpus Analysis of Its Properties and Improved Detection. NAACL, 1181–1186.
Li, J. J.; O’Daniel, B.; Wu, Y.; Zhao, W.; and Nenkova, A. 2016. Improving the Annotation of Sentence Specificity. LREC, 3921–3927.
Li, J. J.; Parish-Morris, J.; Bateman, L.; and Nenkova, A. 2017. Autism Quotient Scores Modulate the Perception and Production of Text Specificity in Adult Females. In Interna-tional Meeting for Autism Research.
Louis, A., and Nenkova, A. 2011a. Automatic Identification of General and Specific Sentences by Leveraging Discourse Annotations. IJCNLP, 605–613.
Louis, A., and Nenkova, A. 2011b. Text Specificity and Impact on Quality of News Summaries. In Workshop on Monolingual Text-To-Text Generation.
Lugini, L., and Litman, D. 2017. Predicting Specificity in Classroom Discussion. InProceedings of the 12th Workshop on Innovative Use of NLP for Building Educational Appli-cations.
Luo, W., and Litman, D. 2016. Determining the quality of a student reflective response. InFlorida Artificial Intelligence Research Society Conference.
Mann, W. C., and Thompson, S. A. 1988. Rhetorical struc-ture theory: Toward a functional theory of text organiza-tion. Text-Interdisciplinary Journal for the Study of Dis-course8(3):243–281.
Pennebaker, J. W., and Stone, L. D. 2003. Words of Wisdom: Language use over the Life Span.Journal of Personality and Social Psychology85(2):291.
Pennington, J.; Socher, R.; and Manning, C. D. 2014. GloVe: Global Vectors for Word Representation. EMNLP, 1532–1543.
Prasad, R.; Dinesh, N.; Lee, A.; Miltsakaki, E.; Robaldo, L.; Joshi, A.; and Webber, B. 2008. The Penn Discourse Treebank 2.0. LREC, 2916–2968.
Preot¸iuc-Pietro, D.; Sap, M.; Schwartz, H. A.; and Ungar, L. H. 2015a. Mental Illness Detection at the World Well-Being Project for the CLPsych 2015 Shared Task. In Pro-ceedings of the 2nd Workshop on Computational Linguistics and Clinical Psychology, NAACL, 40–45.
Preot¸iuc-Pietro, D.; Volkova, S.; Lampos, V.; Bachrach, Y.; and Aletras, N. 2015b. Studying User Income through Lan-guage, Behaviour and Affect in Social Media. PLoS ONE
10:1–17.
Preot¸iuc-Pietro, D.; Liu, Y.; Hopkins, D.; and Ungar, L. H. 2017. Beyond Binary Labels: Political Ideology Prediction of Twitter Users. ACL, 729–740.
Rao, D.; Yarowsky, D.; Shreevats, A.; and Gupta, M. 2010. Classifying Latent User Attributes in Twitter. In Proceed-ings of the 2nd International Workshop on Search and Min-ing User-generated Contents, SMUC, 37–44.
Schwartz, H. A.; Eichstaedt, J. C.; Kern, M. L.; Dziurzyn-ski, L.; Ramones, S. M.; Agrawal, M.; Shah, A.; KosinDziurzyn-ski, M.; Stillwell, D.; Seligman, M. E.; et al. 2013. Personal-ity, Gender, and Age in the Language of Social Media: The Open-Vocabulary Approach. PloS ONE8(9).
Shellenbarger, S. 2012. The Peak Time for Everything. Swanson, R.; Ecker, B.; and Walker, M. 2015. Argument Mining: Extracting Arguments from Online Dialogue. SIG-DIAL, 217–226.
Toutanova, K., and Manning, C. D. 2000. Enriching the Knowledge Sources Used in a Maximum Entropy Part-of-speech Tagger. EMNLP, 63–70.