Reprinted from the Soil Science Society of America Proceedings Volume 36, no. 4, July-August 1972
677 South Segoe Rd., Madison, Wis. 53711 USA
Effect of Phosphorus Fertilization on the Selenium Concentration
in Alfalfa
(Medicago sativa) i
Effect of Phosphorus Fertilization on the Selenium Concentration
in Alfalfa (Medicago sativa)
D. L. CARTER, C. W. ROBBINS, AND M. J. BROWN"'
ABSTRACT
A study was conducted to determine the effect of P fertiliza-tion on the Se concentrafertiliza-tion in alfalfa. Adding P to the soil in-creased the Se concentration in alfalfa grown in the greenhouse on six of 14 soils from the northwestern United States. The Se concentration increase in alfalfa resulting from P addition was noted on some alkaline and some acid soils. Phosphorus addi-tion increased the availability to alfalfa of both native and applied Se in the Portneuf silt loam. Applying 160 kg P/ha either as H3PO4 or concentrated superphosphate to Gooding
sandy loam in the field increased the Se concentration in alfalfa
from a level marginal for animal requirements to an adequate level.
Additional Index Words: white muscle disease (WMD), P response, P concentration in alfalfa, P x Se interaction.
1111-1E DISCOVERY that Se is required to prevent white muscle
1 disease (WMD) in calves and lambs (15) stimulated Se research activity. One area of research has been concerned with the minimal Se concentration required in the diet to prevent WMD (1, 9, 10, 11, 18). Results from studies in this research area indicate that the critical deficiency level in the diet is actually a range from 0.03 to 0.07 ppm, depending upon the vitamin E level and other factors. Some investigators have suggested that 0.10 ppm may be a reasonable practical level. A second area of research has been concerned with determining the Se concentration in forage and hay crops throughout the United States, and has provided maps (5, 7, 13) delineating areas of differ-ent Se concdiffer-entrations in forage and hay. Unfortunately, unexplainable farm-to-farm variability required labelling some areas on these maps as variable in Se concentration. The available information on the Se concentration in soils (14), the different Se forms and their reactions in soils, and the Se uptake by plants (4, 6, 8, 12, 17) indi-cated that some farm-to-farm variability in the Se
concen-'Contribution from the Northwest Branch, Soil & Water Conservation Research Division, ARS, USDA; Idaho Agr. Exp. Sta. cooperating. Received Jan. 7, 1972. Approved March 1,
1972.
2 Soil Scientists, Snake River Conservation Research Center, Kimberly, Idaho 83341.
tration in forage resulted from different management prac-tices. Crop rotations and fertilizer practices used in the variable areas indicated that some of the variability may be related to P fertilization. We investigated the Se con-centration in P fertilizer materials and the associated uptake by plants (17), and results established that some P fertilizers contain sufficient Se to enhance concentrations in plants. However, the proportion of the P fertilizers con-taining significant amounts of Se appeared too small to explain much of the observed variability in the field.
This paper reports the effects of P fertilization on the uptake of indigenous and applied Se, and the resulting Se concentrations in alfalfa (Medicago sativa L. Ranger).
MATERIALS AND METHODS
Five separate investigations, four in the greenhouse and one in the field, were conducted. These will be referred to as Stu-dies 1, 2, 3, 4, and 5 for identification purposes. Procedures and materials applicable to all studies will be discussed first, fol-lowed by a discussion of treatments and experimental proce-dures associated with specific studies.
General Procedures and Materials
Portneuf silt loam was used exclusively in Studies 1, 2, and 3, and was one of 14 soils used in Study 5. The soil for Study 1 was collected from one site, and that for Studies 2 and 3 from another, but all measured properties were the same. The avail-able P determined by NaHCO3 extraction (16, 19) was 7.5 ppm on a scale where values above 10 ppm are probably ade-quate. Soil from still a different site was used in Study 5, and it will be discussed later. The available P levels in the Gooding sandy loam at the field study site (Study 4) were 8.8 and 6.0 ppm for the 0= to 15- and 15- to 30-cm depths, respectively. All soils used in Studies 1, 2, 3, and 4 were P deficient. Both the Portneuf and Gooding soils have pH values from 7.8 to 8.2 and contain free CaCO 3, particularly below the 15-cm depth. Pots used in the four greenhouse studies each contained 3 kg of soil. All pots were placed in a water bath table where the water temperature was maintained at about 21C. Selenium-free water was added according to pot weight to maintain between 20 and 100% of available water.
5.0
Se-0.50pprn A P- 0 ppm 0 P• 4appm O P- 8Opprri
4.0
3.0
2.0
1.0
x C
0 0
0
0.20
040
a 0.30
cy 0.10
0 00
1st 2nd 3rd
Alfalfa Crop
1st 2nd 3rd
Alfalfa Crop
4th 4th
CARTER ET AL.: EFFECT OF P FERTILIZATION ON THE SE CONCENTRATION IN ALFALFA 625
The interval between harvests in the greenhouse was about 30 days. Field plots were sampled 48 days after application of P materials. Selenium-free fertilizer materials were used in Stu-dies 2, 3, 4, and 5. All five stuStu-dies were set up in triplicate randomized complete block designs.
Specific Treatments and Procedures
Study I—This study was carried out simultaneously with our investigation of the plant uptake of Se contained in P fertilizer materials (17). Treatments were: (i) control, (ii) raw rock phosphate at a rate sufficient to provide 22 ppm P and 0.008 ppm Se, (iii) raw rock phosphate treated with enough H3PO4
to provide 79 ppm P and 0.008 ppm Se, (iv) raw rock phos-phate treated with H2504 applied at a rate sufficient to provide
44 ppm P and 0.016 ppm Se, and (v) raw rock phosphate treated with H3PO4 equivalent to the H2SO4 used in (iv) to
provide 156 ppm P and 0.016 ppm Se.
Study 2—The treatments were: 0, 40, and 80 ppm P as con-centrated superphosphate at Se levels of 0, 0.25, and 0.50 ppm applied as H2Se03.
Study 3—Treatments were: (i) control, (ii) no P applied until after the second alfalfa crop was removed and then 80 ppm P applied as concentrated superphosphate by distributing the pellets into five holes about 5 to 7 cm deep, and (iii) 80 ppm P applied initially.
Study 4—FieId plots, 4m by 5m, in an established alfalfa stand on Gooding sandy loam were treated with P immediately following removal of the second alfalfa crop in 1969. Treat-ments were: (i) control, (ii) concentrated superphosphate broadcast on the surface at a P rate of 160 kg/ha, and (iii) H3PO4 shanked into the soil approximately 10 cm deep and
about 30 cm apart at a P rate of 160 kg/ha.
Study 5—Soils were collected from 14 locations in the North-west and prepared for a greenhouse study as previously de-scribed. The soils and some characteristics are given in Table 3 (Results section). Available P was determined on those soils
having pH values of 7.0 and above by NaHCO3 extraction (16, 19). The acid soils were extracted with NaOAc for determining available P (The extraction method is used by the University of Idaho Soil Testing Laboratory and it has been adapted from several published methods). Response to P applications gener-ally occurs on soils with extractable P levels < 10 ppm when using these methods. Treatments were (i) control, and (ii) 100 ppm P applied as concentrated superphosphate, except that 50 ppm P was added later to both treatments on Blodgett and Deschutes, and 100 ppm P was added to both treatments on the
Jory (see Results section).
Table 1—The Se concentration in alfalfa grown on Portneuf silt loam at different applied levels of P and Se in raw and
treated rock phosphate
Alfalfa. crop
2 3 4 5
P $e - -
--rate --rate Se concentration ppm ppb ppm '
Control 0 0 0, 043 a 0.051 a 0,050 a 0.037 a 0.036 a Raw rock phosphate 22 8 0.048 a 0.054 a 0,059 ab 0,040 a 0,038 a Raw rock phosphate +. 14.POE 79 8 0.065 bo 0.138 b 0,129 c 9.109 be 0, 102 c Raw rock phosPhate +111801 44 16 0.063 ab 0,105 b 0,092 b 0.086 b 0, 071 b Raw rock phosphate +1-lz,POE 156 16 0.101c 0.130b 0,1470 9,130e 0,1150
• Numbers within each crop followed by different lette pa differ eigniacantly at the 5% level by Duncaira mnitIple range teat,
RESULTS
Results from Study 1 indicated that increasing the P applied at a given Se application rate increased the Se concentration in alfalfa (Table 1). Selenium concentra-tions were significantly higher in all alfalfa crops where 79 ppm P was applied than where only 22 ppm was applied at the Se rate of 0.008 ppm. The same pattern was observed at the 0.016 ppm Se rate when the P level was increased from 44 to 156 ppm. Phosphorus applica-tions also increased yields as expected.
The Se concentration was significantly increased by each P application increment in all four alfalfa crops where no Se was applied in Study 2 (Fig. 121). Phospho-rus application also increased the Se concentration in alfalfa where 0.25 and 0.50 ppm Se were applied even
though the Se concentrations from these treatments were
10 to 30 times greater than where no Se was applied (Fig. 1B and 1C). Alfalfa yield and P concentration in the alfalfa were increased by applying P to the soil as
expected from the soil tests.
Results from Study 3 showed that applying P immedi-ately following the second harvest of alfalfa increased the Se concentration in subsequent crops (Fig. 2A and 2B). The P effect was manifested where no Se was added and where 0.50 ppm was applied, although the Se concentra-tion was 10 to 30 times greater where 0.50 ppm Se was applied. The same Se concentration resulted in the third
Material
1st 2nd 3rd 4th Alfalfa Crop
sig-0.40
E
ca
0.2
•
•C 0
0.10 0.30
0.00
1st
5.0
3rd
2nd 4th
A P • Oppm
Q P • Oppm initially. 80ppm
after 2nd cutting O P • BO ppm
Se • 0.50 ppm
4.0
E o. o.
o 3.0
0
• O • 2.0
3
1.0 2B
1st 2nd 3rd 4th
Alfalfa Crop P APPLIED
•
A P • 0 ppm
q P • o ppm Initially, ao pam
after 2 nd cutting
O P • 80 ppm
30111,00 Applied P Se
kehe ppm 5
36, 1972
Fig. 2—The Se concentration in alfalfa grown on Portneuf silt loam. Different letters by the data points for each crop indi-cate significant differences by Duncan's multiple range test at the 5% level.
and fourth alfalfa crops where the P was applied after the second crop as where the P was applied before crop-ping at both Se levels.
Applying P to an established alfalfa stand in the field on Gooding sandy loam (Study 4) increased the Se concen-tration in alfalfa from marginal to adequate levels for livestock (Table 2). Injecting H3PO4 was more effective
than broadcasting concentrated superphosphate. The P concentration in alfalfa was also increased.
Results from Studies i through 4 indicated that applying P to P-deficient calcareous soils increased the Se concen-tration in alfalfa grown on those soils. Study 5 was con-ducted to determine if the P x Se interaction occurred on other soils. The pH values of the soils used ranged from 5 to 8. Some soils were P-deficient and others were not, according to soil test values. All soils with pH values above 7.0 contained free CaCO3.
Alfalfa seedlings transplanted into the 0 ppm P
treat-Table 2—Selenium and P concentrations in alfalfa grown on Gooding sandy loam with and without applied P
Plant tissue anntyste
Control 0 0,070 a 0.223 a 0-48-0 160 0.107 b 0.247 b 14.PO4 160 0.149 a 0, 293 e
• Numbers in the 84.1310 column followed by different letters differ significantly at the 19; significance /eve by Duncan's multiple range teat.
ment of the Blodgett, Jory, and Deschutes soils exhibited acute P deficiency symptoms soon after transplanting. In fact, it appeared that the plants would not survive. There-fore 50 ppm P were added to both treatments on the Blod-gett and Deschutes soils, changing the treatments to 50 and 150 ppm P. Both treatments on the Jory received 100 ppm, changing the treatments to 100 and 200 ppm. This P was applied by dropping concentrated superphosphate into several holes punched 5 to 7 cm into the soil. The alfalfa responded to the additional P on all three soils. Selenium concentrations in alfalfa were increased by the higher P level over the lower P level on all •three soils.
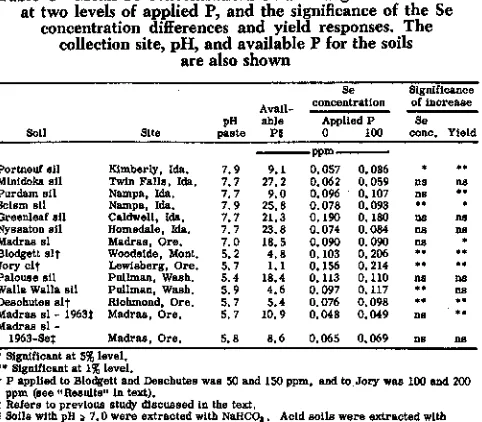
Phosphorus fertilization increased the Se concentration in alfalfa grown on 6 of the 14 soils studied (Table 3). A significant alfalfa yield response was obtained on 8 of the 14 soils. A Se concentration increase and a yield response to added P resulted on five soils. Two of these, the Portneuf and the Seism, were calcareous, and the other three, the Blodgett, Jory, and Deschutes, were acid. In addition to these significant responses, there was a definite trend towards both a yield response and a Se concentra-tion increase on the Purdam, Nyssaton, and Walla Walla. The Madras-1963 and the Madras-1963-Se soils were included in the study for two purposes. The first was to determine the effects of applying P on the Se concentra-tion in alfalfa, and the second was to determine the effects of a Se treatment made in 1963 (3). The Madras 1963-Se was treated in the field with 1.0 ppm Se as Na2Se02
in-jected into the soil in water solution in 1963. The Madras-1963 was an adjacent area in the field that received no Se. The data (Table 3) indicate that there are long lasting effects of the 1.0 ppm Se application. The Se concentration in alfalfa from the Se-treated soil was greater after eight cropping seasons than it was from the adjacent untreated soil. Phosphorus applications in the greenhouse did not change the Se concentration in alfalfa grown on these soils. An attempt was made to determine if applying P in-creased the extractable Se on soils where the P X Se inter-action was observed. Fifty-gram samples of the Portneuf, Minidoka, Blodgett, Jory, Deschutes, and Madras soils, both untreated and with 160 ppm P added, were incubated at a moisture level near field capacity and at room tem-perature for 48 hours. They were then extracted by shak-ing with 500 ml of 0.01 N CaC12 for 16 hours and filtered
CARTER ET AL.: EFFECT OF P FERTILIZATION ON THE SE CONCENTRATION IN ALFALFA 627
Table 3-Mean Se concentrations in alfalfa grown on 14 soils at two levels of applied P, and the significance of the Se
concentration differences and yield responses. The collection site, pH, and available 13 for the soils
are also shown
Sall Site pastepH Avail-able
P1
Se
concentration Significanceof increase
Applied P
0 100 cone.Se Yield
9.1 PPm 0,057 O. 086
Portneuf ell Kimberly, Ida, 7.9 • • •
Minidoka all Twin Pails 7.7 27,2 0.062 0, 059 us na
Pordam ail Nampa, Ida, 7.7 9.0 0.096 0. 107 cc • •
&alms all Nampa, Ida. 7,9 25,8 0.078 0.093 •• •
Greenleaf ail Caldwell, Ida, 7.7 21,3 0. 190 0, 180 as nit Nysaaton ail Homedale, Ida, 7.7 23.8 0.074 0.084 ns na Madraa sl Madraa, Ore. 7.0 18.5 0.090 0.090 as • Blodgett sit
levy Woodelde, Mont,Lewisberg, Ore, 5.75.2 4 , 81.1 0,1080.156 0,2060,214 •••• •• •• Palouse nil Pullman, Wash. 5.4 18.4 0.113 0,110 na 08 Walla Walla ail Pullman, Wash. 5. 9 4.6 0. 097 0.117 • • EH
Desohuten alt Richmond, Dre. 5, 7 5.4 0.076 0.098 •• • •
Madras sl 19631 Madras, Ore, 5, 7 20,9 0, 048 0.049 na Madras sl
-1963-Se; Madras, Ore, 5.8 8,6 0,065 0.069 1313 flu
• Significant at 5% level, •• Significant at 1% level.
t 1, applied to Blodgett and Denchuten wan 50 and 150 pPre, and to JOEY was 100 end 200 ppm (nee Results" In teal),
Refers to previous Mudy discussed it the text,
Soils with pH o 7.0 were extracted with NatICO. , Acid coils were extracted with Na0Ac.
DISCUSSION
Interaction between two elements in the soil relative to their uptake by plants has been observed many times. Gen-erally the exact mechanisms for such interactions are not known. The interaction between P and Se has been shown to occur, but like many other interactions, the exact mechanism is not known. Results from this study partly characterize the interaction and establish important impli-cations of it.
One possible explanation for the P X Se interaction might be as follows: Evidently P and Se compete for some reactions in the soils. When Se is involved in these reac-tions, the products apparently render Se unavailable, or nearly so, to plants. When P is added to the system, it evidently replaces some Se in certain reaction products, forcing the replaced Se to react in such a way that it is more available to plants; hence the Se concentration in these plants is increased. However, we could not detect differences in extractable Se when comparing P treated and untreated soils.
Another possible explanation for the P X Se interaction is that P applications may stimulate plants to absorb more Se because of greatly increased root proliferation. Most of the nutrient absorption is by new root growth. The more prolific the root system, the greater is the root-soil contact or the volume of exploration involving actively absorbing roots. This greater root-soil contact may result in sufficient additional Se uptake to bring about the observed Se con-centration increases in plants, Selenium concentration increases and yield responses tended to occur on the same soils, and most of these soils were P-deficient. The rela-tive Se concentration increases observed in the greenhouse when P was added tended to decrease with successive crops, indicating that root proliferation may be a primary factor in the P x Se interaction. The application of P to the field plots caused a greater relative increase in Se in
the plants than was noted in most of the greenhouse
stud-ies. This also points to increased root proliferation as an important factor.
The P x Se interaction mechanism functions similarly with native and added Se. A 40-ppm increment in applied
P increased the Se concentration in first crop alfalfa about 0.08 ppm where no Se was applied, compared to an in-crease of 0.7 to 1.0 ppm where 0.25 or 0.50 ppm Se was applied.
Gardner (11) has reported an apparent increase in the incidence of Se deficiency in livestock following increased use of phosphate fertilizers in parts of Australia. In our work, P applications did not result in any significant decreases in Se concentration in alfalfa. Therefore, it would appear that any increased incidence of Se deficiency in livestock following increased use of P fertilizers would not be an effect of P, per se.
The differences in Se concentration in crops on differ-ent soils in an area mapped as variable in the Northwest (5, 13) are typified by the Se concentrations for 14 soils where no P was applied (Table 3). Differential use of P fertilizers may also account for some of the variability in areas mapped as variable. On some soils, for example-the Gooding, example-the use of P fertilizers may increase the Se
concentration in forage from a low or marginal level for livestock to a level considered adequate for cattle and sheep.
The importance of the P X Se interactions in relation to animal nutrition and the prevention of WMD depends upon the general Se concentration in plants. There are some areas where P fertilizers are applied and yet all forage samples contain Se concentrations below 0.10 ppm (5, 13). In these regions the interacting effects of P on Se may not be of sufficient magnitude to bring about ade-quate Se concentrations in forage for livestock, but some exceptions should be expected. There are also regions where the Se concentration in all forage samples is above minimal requirements for livestock, In these regions, the
P x Se interactions are not important in animal nutrition. The interaction can be most important to the rancher and livestock feed producer in marginal Se areas. Maintaining an adequate P level in the soil will help to insure high crop yields and adequate nutritional concentrations of both P and Se when these crops are used for livestock feed.
In conclusion, results of our investigations have shown that applying P to some soils increases the Se concentra-tion in alfalfa. Thus there is a P X Se interacconcentra-tion that may be important in some areas where WMD losses occur.
LITERATURE CITED
1. Allaway, W. H., E. E. Cary, and C. F. Ehlig. 1967. The cycling of low levels of selenium in soils, plants and ani-mals. p. 273-296. In 0. H. Muth (ed.) Selenium in bio-medicine. AVI Publishing Co., Westport, Conn.
2. Allaway, W. H., and Earle E. Cary. 1964. Determinations of submicrogram amounts of selenium in biological mate-rials. Anal. Chem. 36:1359-1362.
3. Allaway, W. H., D. P. Moore, J. E. Oldfie l d, and 0. H. Muth. 1966. Movement of physiological levels of sele-nium from soils through plants to animals. J. Nutr. 88: 411-418.
5. 6.
7. 8. 9.
10.
Sci. Soc. Amer. Proc. 33:563-565.
Carter, D. L., M. J. Brown, W. H. Allaway, and E. E. Cary. 1968. Selenium content of forage and hay crops in the Pacific Northwest. Agron. J. 60:532-534.
Carter, D. L., M. J. Brown, and C. W. Robbins. 1969. Selenium concentrations in alfalfa from several sources applied to a low selenium alkaline soil. Soil Sri. Soc. Amer. Proc. 33:715-718.
Carter, D. L., C. W. Robbins, and M. J. Brown. 1970. Selenium concentrations in forage on some high northwest-ern ranges. J. Range Manage. 23:234-238.
Cary, Earle E., and W. H. Allaway. 1969. The stability of
different forms of selenium applied to low selenium soils. Soil Sci. Soc. Amer. Proc. 33:571-574.
Davies, E. B., and 3. H. Walkinson. 1966. Uptake of native and applied selenium by pasture species: I. Uptake of Se by browntop, ryegrass, cocksfoot, and white clover from Atiamuri sand. New Zealand I. Agr. Res. 9:317-327. Ewan, R. C., C. A. Baumann, and A. L. Pope. 1968. Ef-fects of selenium and vitamin E on nutritional muscular dystrophy in lambs. J. Anim. Sci. 27:751-756.
11. Gardiner, M. R. 1969. Selenium in animal nutrition. Out-look Agr. 6:19-28.
12. Goering, Harold R., Earle E. Cary, L. H. P. Jones, and W.
H. Allaway. 1968. Solubility and redox criteria for the possible forms of selenium in soils. Soil Sci. Soc. Amer, Proc. 32:35-40.
13. Kubota, J., W. H. Allaway, D. L. Carter, E. E. Cary, and V. A. Lazar. 1967. Selenium in crops in the United States in relation to selenium-response diseases of animals. Agr. Food Chem. 15:448-453.
14. Lakin, H. W. 1961. Selenium content in soils. p. 27-34. In USDA Agr. Handbook 200.
15. Muth, 0. H. 1963. White muscle disease, a selenium re-sponsive myopathy. J. Amer. Vet. Med. Ass. 142:272-277. 16. Olsen, S. R., C. V. Cole, F. S. Watanabe, and L. A. Dean. 1954. Estimation of available phosphorus in soils by ex-traction with sodium bicarbonate. USDA Circ. 939. 17. Robbins, C. W., and D. L. Carter. 1970. Selenium
concen-trations in P fertilizer materials and associated uptake by plants. Soil Sci. Soc. Amer. Proc. 34:506-509.
18. Underwood, E. J. 1966. The mineral nutrition of livestock. FAO, United Nations, and Commonwealth Agr. Bureaux. p. 291-330.