"Purchased by Agricultural Research Service, U. .5. Department of Agriculture, for Official use."
7131 March, 1970
Journal of the
IRRIGATION AND DRAINAGE DIVISION
Proceedings of the American Society of Civil Engineers
SCHEDULING IRRIGATIONS USING CLIMATE-CROP-SOIL DATA' By Marvin E. Jensen,' M. ASCE, David C. N. Robb, 2 M. ASCE,
and C. Eugene Franzoy2
INTRODUCTION
Recent studies of surface irrigation systems (16,21,29)4 indicate that irri-gation scheduling practices, tithing and amount applied, have not changed sig-nificantly from those observed about 25 yr ago by Israelson, et al. (11). Attempts to relate observed irrigation efficiencies to field, soil, crop, and management characteristics generally have not been successful because the factors causing the large variations in timing and amount of water applied at eaehirrigation are so diverse that the resulting irrigation efficiencies appear to be random events with a broad, uniform distribution. The potential for better irrigation water management has; however, increased substantially during the past 15 yr because of better water control and measurement facilities (24), improved system design criteria (2), more reliable methods for estimating evapotranspiration (13), increased knowledge of each crop's response to soil moisture levels (9), and commercially available soil moisture instrumenta-tion for timing irrigainstrumenta-tions (10).
One of the major reasons irrigation practices have not changed substan-tially is because the procedures farmers use for timing irrigations have not changed significantly such as irrigation by the calendar regardless of climatic variations, fixed rotation schedules, irrigating when the neighbor does, etc. Also, the amounts applied are generally determined by the method of irriga-Note.—Discussion open until August I, 1970. To extend the closing date one month, a written request must be filed with the Executive Secretary, ASCE. This paper is part of the copyrighted Journal of the Irrigation and Drainage Division, Proceedings of the American Society of Civil Engineers, Vol. 96, No. IR1, March, 1970. Manuscript was submitted for review for possible publication on May 22, 1969.
a Presented at the February 3-7, 1969, ASCE Irrigation and Drainage Division Na-tional Meeting on Water Resources, New Orleans, La.
Director, Snake River Conservation Research Center, Kimberly, Idaho.
2 Comprehensive Basin Planner, Great Lakes Basin Commission, Ann Arbor, Mich.; formerly Hydr. Engr., Water Utilization Branch, Bureau of Reclamation, U.S. Dept. of the Interior, Denver, Colo.
3 Senior Engr., Salt River Project, Salt River Water Users' Assoc., Phoenix, Ariz. 4 Numerals in parentheses refer to corresponding items in Appendix II.—References.
159
IR 126 March, 1970 IR 1 lion, i.e., furrow irrigation, wild flooding, convenient duration of sets such as 12 hr or 24 hr instead of being adjusted to the amount of soil moisture
deple-tion since the last irrigadeple-tion. Good irrigadeple-tion management is still more of an art perfected through years of experience than a science.
The potential advantages of scheduling irrigations using climatic data have been advocated by many. Penman (17), for example, analyzed this approach in 1952 as have others since then (1,19,21,22,27,28). However, this method still has not been developed for practical use or tested extensively. The individual irrigator is not adopting the latest scientific principles of irrigation rapidly because he does not have the time, the technical background, or the informa-tion at hand to independently develop and apply management practices that in-volve climate, hydraulics, soils and crops. Also, farmers are reluctant to deviate from traditionally accepted scheduling methods regardless of their apparent relative merits until they can be shown that improvements are pos-sible and will result in greater net returns.
Although both timing and amount of water applied affect irrigation effi-ciency, timing has the greatest effect on crop yield and quality because at some
crop growth stages excessive soil moisture stress, caused by a delayed irri-gation and inadequate irriirri-gation, can irreversibly reduce the potential yield and quality of the crop or both. When stress symptoms are visible, damage generally has already occurred or will occur by the time the field can be irri-gated. Excessive water applications also invariably reduce yields of many crops unless accompanied by larger nitrogen fertilizer applications to com-pensate for that lost through leaching.
ALTERNATIVES FOR SCHEDULING IRRIGATIONS
Many alternatives exist for scheduling irrigations. In some areas irriga-tions are set up on rotation schedules with constant intervals and either constant or variable amounts, but generallydisregarding annual climatic vari-ations. Such systems inherently result in low irrigation efficiencies and low yield potentials. Similarly, continuous flow systems are inefficient because evapotranspiration and precipitation are not uniform during the season.
Use of variable schedules, demand system, is perhaps more common than
fixed schedules. Such irrigation scheduling is usually based on experience and/or visual observations of soil and/or plant characteristics.
IR 1 SCHEDULING IRRIGATIONS 27 sumptive use rates coupled with gravimetric determinations provide an ex-cellent basis for predicting irrigations.
Efficient irrigation implies complete control of the available soil moisture reservoir. Such control requires adequate knowledge of the soil moisture content at all times, and the application of just enough water to refill this res-ervoir, plus the leaching requirement for salt control where necessary. Pro-cedures for more accurately scheduling irrigations, involving both time and amount, can be separated into those employing direct measurement of soil moisture levels and those employing predictive approaches based on estimated soil moisture depletion. Direct measurement of soil moisture involves either gravimetric or neutron moderation measurement of soil moisture content or use of instruments which measure parameters related to soil moisture. Suc-cessful irrigation water management programs exist which are based on each approach.
Several commercial operators provide irrigation management services in the Southern San Joaquin Valley in California. The services, available for $8.00 per acre per year, are used almost exclusively on citrus, and irrigation scheduling is based on tensiometer readings. A similar service is offered members of a citrus growers' cooperative in the Santa Paula, California area. An agricultural management service that includes soil moisture determina-tions is available in the Columbia basin in Washington.
In July, 1965, the Salt River Project, an agricultural improvement district in the Salt River Valley of Arizona, initiated a unique and interesting service to its farmers. Designed to increase the farmers' knowledge of the role of water in crop management, the program has gained wide acceptance. The pri-mary concept on which the program is based is the timing of irrigations ac-cording to crop needs and soil moisture-holding capacities. Acceptance of the program is evidenced by the increase in the number of acres enrolled in the service. Since its inception in 1965 the program has expanded from 14,000 acres to 65,700 acres in 1968, or to nearly half of the eligible cultivated land hi the district. The service is available at no direct cost to all shareholders farming 20 acres or more and is provided on all crops grown in the Project. The annual cost to the Salt River Project for providing the service has been less than $1.50 per acre. Irrigations are scheduled on the basis of information obtained during weekly visits by the farmer and a technician to predetermined management sites Located in each field. Soil moisture levels are measured and recorded each week, and evapotranspiration rates are estimated from pre-viously determined rates for the crops in that area to predict the timing of the next irrigation. Subsequent visits are used to ascertain soil moisture usage and make necessary adjustments in the original estimates (5,6).
Some areas or districts use evaporation measurements to estimate soil moisture depletion (12,30). Generally, evaporation data are published daily in the local papers and the farmer applies the necessary coefficient for each crop and keeps his own records (12). In other areas, posting boards are used to display general water use by crops as estimated by evaporation techniques (25). Similar guides based on anticipated climatic changes are used in France (20).
28
farms and 48 fields involving 11 crops throughout southern Idaho in 1968. The U.S. Weather Bureau, cooperated by providing the necessary climatic data for estimating the evaporative demand, and the farmers cooperated in providing general agronomic and irrigation data. Each farmer-cooperator was furnished several charts and tables which served as an introduction to an irrigator's handbook. Computations were made weekly in the spring and fall and twice weekly in midsummer. The computer was located in Phoenix, Ariz. with
a
re-mote terminal at Kimberly, Idaho. Similar computer service is available at any location in the United States with telephone service. Each field was visited periodically by a technician or company field man to monitor or verify the projected irrigation schedule. The same computer program was rewritten for the computer at the Salt River Project (Ed. Kirdar, Senior Engr. and Earl Tankersley, Engr. Planning and Statistical Div. Engrg. Dept., Salt River Valley Water Users' Assoc.) and is being tested on 19 farms and 2,162 acres in the Salt River Valley.PREDICTIVE APPROACH
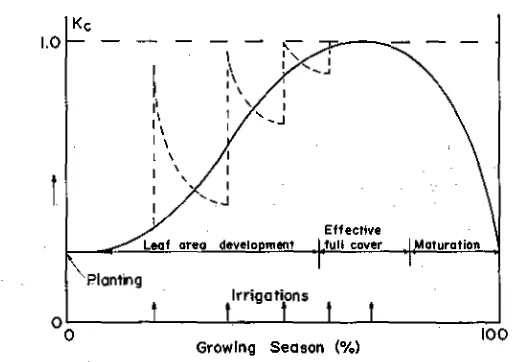
The basic principles employed begin with an estimate of daily potential evapotranspiration rates. Then a crop coefficient, which is primarily a func-tion of stage of growth and surface soil moisture, is applied. Crop coefficients are based on experimental data and are automatically adjusted to reflect changes in surface soil moisture caused by irrigation or precipitation and the general decrease in available soil moisture. Optimum soil moisture depletion values used are based on experimental data, available soil moisture charac-teristics, crop tolerance to soil moisture stress, and rooting depth. With some irrigation systems, optimum depletion is that amount which is normally re-plenished by an irrigation system and may be independent of the soil and root-ing depth. If desired, optimum depletion values can be adjusted to maximize production per unit of water used for water-short areas.
The general procedure used is illustrated by the following sequence.
Esti-mate daily potential evapotranspiration, Etp, for a reference crop like alfalfa.
Either an approximate energy balance or a combination, energy balance-aerodynamic equation, can be used as described in Appendix I and in numer-ous other publications (23). In some areas an evaporation pan can be used, providing a standardized environment is maintained around the pan.
Determine the crop coefficient based on the stage of growth involved, the
time since an irrigation or rainfall (see Fig. 1), and the remaining available
soil moisture. If experimental data are not involved, the crop coefficient can be estimated using the following energy balance components (14):
„. + +
AC 1 + Azo + Go) (1)
in which 13 = (A/Et); = net radiation; A = sensible heat flux to or from
the air; G = sensible heat flux to or from the soil; and 13 represents the ratio
Growing Season (%) 100
IR 1 SCHEDULING IRRIGATIONS 29
data where soil moisture was not limiting, Ka = the relative coefficient as
available soil moisture becomes limiting (for this program Ka was assumed
to be proportional to the logarithm of 1.0 plus the percentage of remaining available soil moisture), and K, = the change in the coefficient at a given stage
of growth when the soil surface is wetted by irrigation or rainfall. The sum of
KeaKa + K, normally will not exceed 1.0 for most crops. Increases in daily
Et due to rainfall cannot exceed the sum of previous increases in soil mois-ture from a given rain.
Estimate evapotranspiration for each day since the previous date of com-putation using observed climatic data, and for the next three days based on forecasts of the climatic parameters:
Et = KcEtp (2)
Estimate the cumulative soil moisture depletion to the current day:
Wd = Et - R e ( 3 )
in which Wd = estimated cumulative soil moisture depletion, and Re =
effec-tive rainfall. After an adequate irrigation, Wd is assumed to be zero.
FIG. 1.—CHANGES IN CROP COEFFICIENTS AS INFLUENCED BY STAGE OF GROWTH AND WET SOIL CAUSED BY IRRIGATION OR RAINFALL
Estimate the number of days before the next irrigation using the average Et for the three preceding days and the three forecast days. In semihumid areas a longer range forecast can be incorporated:
N Wd Et
N = 0 for Wd We
in which N = number of days until the next irrigation; and W o = optimum or
30 March, 1970 IR 1 Estimate the total amount of water to be delivered to the field per-unit area:
„TV Lu = W0 Wd
„,_
":1 7 Wd> Wo
in which Wf = total depth of water per unit area to be delivered to the field;
and E attainable irrigation efficiency with the system involved. Where and
when necessary, Wf can be adjusted to provide the necessary leaching re-quirement.
Each farmer and field man involved in the management service received the following information by mail after each computer run, automatically printed by the teletype terminal: (1) Crop and field identification; (2) date of last irrigation; (3) rainfall since last irrigation; (4) estimated depletion of soil moisture; (5) optimum depletion (varies with growth stage); (6) estimated days before the next irrigation (primary item); (7) approximate amount to apply (primary item); (8) general climatic forecast.
The general reception to this experimental management service has been very favorable. Reports of general increases in yields, reduction in time in-volved in checking fields, better management of the water supply for the entire farm, and more uniform crop quality by the cooperators were common.
COMBINATION (PREDICTIVE-DIRECT CONTACT) APPROACH A combination of the Salt River Project approach and the Jensen predictive approach (Jensen-SRP) offers the potential of providing the best service for the least cost. The basic concept supporting the combined approach is the ap-plication of scientific irrigation principles and direct observation by experi-enced, trained personnel. Regular weekly visits are used to verify estimated soil moisture regimes and projected irrigations, confirm dates and adequacy of previous irrigations, and to collect rainfall data. This feedback is essential to the success of this service. In addition, the regular visits instill confidence in the predictive approach and encourage the irrigator to improve his manage-ment practices. Irrigation scheduling by this method offers the balance of ac-curacy and flexibility essential to the efficient use of water.
The cost of the combined approach should be less than the cost of the Salt River Project Program, and may be less than $1.00 per acre per year on the basis of a 600-acre average farm. Programming and actual computer time account for about one third of the cost. The remainder is required for admin-istrative and field operation expenses. With small farms, the resulting per-acre cost may be larger unless the level of service, frequency of visits, etc., is reduced.
Potential benefits from the Jensen-MP approach are many. Foremost, of course, is increased net return to the irrigator through increased yields and lower production costs. Secondary benefits are increased water use efficiency, reduction in irrigation labor costs and elimination of detrimental effects as-sociated with poor irrigation practices. Increased profits can be realized from both reduced production costs and increased yields. Experience in the Salt River Project has shown that yields can be increased from tenth to one-(5a)
IR l SCHEDULING IRRIGATIONS 31 third with good irrigation practices (5,6). An additional benefit for which no monetary value can be assigned is improved overall farm planning which oc-curs as a result of the well-planned irrigation program. Also, a trained tech-nician can serve more farms when he has the predicted schedules.
The combined management approach also offers potential benefits to irri-gation projects. Good water management may decrease per-acre storage requirements, resulting in reduced per-acre storage costs or the ability to serve more land with a given amount of storage. In addition, fewer drainage problems exist when water is managed properly. All of these factors should increase the repayment capacity of a farm operation. Increased knowledge of potential water requirements allows better scheduling of project water de-liveries and reservoir operations.
One apparent problem of the combined approach is the use of fieldperson-nel during winter months when few or no crops are being grown. This problem is minimized in more moderate climatic regions where crops are grown year-round or on small projects where technicians also serve in other capacities. Updating the irrigator's manual, evaluating the irrigation practices for each farm, and conducting general irrigation management training sessions can effectively utilize the held personnel time during the winter.
The only additional administrative problem encountered in the incorpora-tion of the Jensen- SRP approach is the increased record keeping required for accurate prediction of irrigation dates and amounts. This problem can be over-come by establishing a functional filing system and uncomplicated documenta-tion procedures. With a time-sharing computer, most of this informadocumenta-tion is stored on magnetic disks and updated automatically.
Use of electronic data processing facilities provides a substantial advance-ment in record storage and analysis. Tremendous amounts of data, which are useful for future evaluation of irrigation programs, can be stored either on cards or magnetic tape. In addition, these data would enable assessments of yield versus soils by region and crop or any other desired combination of parameters which are needed in planning other projects and in future opera-tions of the existing project.
SUMMARY
of irrigation or experienced judgment with the results of recent advances in irrigation science.
APPENDIX I.—ESTIMATING POTENTIAL Et
Irrigation scheduling using climatic data requires reliable daily estimates of potential Et . Potential evapotranspiration, Etp, as used here, represents the upper limit or maximum evapotranspiration that occurs under given climatic conditions with a field having a well-watered agricultural crop with an aero-dynamically rough surface, such as alfalfa with about 12 in. to 18 in. of top growth (14). Methods of estimating Etp based on the conservation of energy or energy balance have repeatedly been shown to be reliable and conservative for short periods of time (13). The two methods presented here have been used in the computer program in Idaho. In general, during the summer months when windspeeds are moderate, the approximate method gives essentially the same results as the combination method. During the spring, high winds, up to 20 mph for a 24-hr average, result in higher estimates with the combination equation.
APPROXIMATE ENERGY BALANCE METHOD (MODIFIED JENSEN-HAISE METHOD)
Daily climatic parameters required are: (1) Solar radiation R s ; and (2) mean air temperature T. Then the basic equation is
Etp CT (T Tx)Rs (6)
in which C T = air temperature coefficient which is constant for a given area and is derived from the long-term mean maximum and minimum temperatures for the month of highest mean air temperature; T = mean daily air tempera-ture; Tx is a constant for a given area and is merely the linear equation inter-cept on the temperature axis; and Rs = daily solar radiation expressed as the equivalent depth of evaporation.
Determine CT and Tx.—When accurate evapotranspiration data are
avail-able for an area, C T and Tx can be determined by calibration. When calibration
data are not available, then for aerodynamically rough crops at normal sum-mer mean air temperatures and at elevations near sea level, CT in degrees' may be calculated using
CT - 68 + 13CH
for T in degrees Fahrenheit
1
or CT = 38 +
7.3CH
for T in degrees Centigrade in which Cm a humidity index, is
(7a)
IR 1 SCHEDULING IRRIGATIONS 33 37.5 mm Hg _ 50 mb
CH c2 - el e2 - (8)
and e2 = saturation vapor pressure, in millimeters of mercury or in millibars at mean maximum air temperature during the warmest month; and e1 =
sat-uration vapor pressure at mean minimum air temperature during the same
month. For clipped grass, multiply the estimates obtained using the coeffi-cients in Eqs. 7a or 75 by 0.87. The Tx values are presented in Table 1.
TABLE 1.-SUMMARY OF T x VERSUS HUMIDITY COEFFICIENTS
Humidity index, C H Tx (at sea level)a
in degrees Fahrenheit in degrees Celsius
(1) ( 2) (3)
1.0 15.0 -9.4
1.25 17.5 -8.1
1.5 19.2 -7.1
2.0 21.3 -6.0
2.5 22.5 -5.3
3.0 23.6 -4.7
4.0 24.4 -4.2
6.0 25.5 -3.6
a Tx = 27.5 °I' - 0.25(e2 - el) °F/uth - E/1,000 °F inwhiohE elevation, infect.
TABLE 2.-SUMMARY OF C 1 VALUES FOR HIGH ALTITUDES
Elevation, in fed
C I
in degrees Fahrenheit in degrees Celsius
(1) (2) (3 )
1,000 64 36
2,000 61 34
4,000 53 29
6,000 46 26
8,000 39 22
10,000 32 18
C 1 = 68 - 3.6 E/1,000; E = elevation, in feet.
Because of the large changes in the air temperature-net radiation relation-ships at high elevations, the constants 68 and 38 in Eqs. 7a and 7b should be changed for elevation as shown in Table 2. These adjustments were based on data collected at 9,200 ft elevation in Colorado (Personal Communication, H. R. Raise and E. G. Kruse), 3,800 ft in Idaho, and 840 ft in Washington.
Dimensions.-The dimensions of Eq. 6 are the same as the dimensions of
meteo-rological services, is usually in calories per square centimeter or langleys. These can be converted to equivalent depths of evaporation assuming a heat of vaporization of 585 cal per g as follows: langleys x 0.000673 = inches; langleys x 0.0171 = millimeters.
PENMAN (COMBINATION) METHOD (18)
Daily climatic parameters required are: (1) solar radiation, Rs; (2) daily maximum and minimum air temperatures, T2 and TL; (3) windspeed or daily wind run at a height of 2 m, or adjusted to this elevation by the log-profile or the 0.2 power law method, U or W, respectively; (4) mean daily dew point tem-perature, Td (if not available, this can be approximated using the minimum
TABLE 3.—SUMMARY OF Anti y ), AND V(& y) VERSUS T a
Air Temperature
0/A Vni 'Y
degrees Celsius degrees Fahrenheit
(1) (2) (3) (4)
1 33.8 0.417 0.583
5 41 0.478 0.522
10 50 0.552 0.448
15 59 0.621 0.379
20 68 0.682 0.318
25 77 0.735 0.265
30 86 0.781 0.219
35 95 0.819 0.181
40 104 0.851 0.149
a Computed from Smithsonian Meteorological Tables, 6th Ed., 1958, Eq. 2, page 365, and Table 103, page 372.
daily air temperature); and (5) solar radiation for the corresponding cloudless day for the area, R
The basic equation is
Eto = A + 7 (R,, - 0) + A7+ 7 (15.36)(1.0 + 0.01 W)(e$ - ed) (9)
in which Eto = potential evapotranspiration in langleys; A = slope of the sat-uration vapor pressure-temperature curve, de/dT; v = psychrometric
con-stant; e s = mean saturation vapor pressure in millibars (mean at maximum
and minimum daily air temperature); ed = saturation vapor pressure at mean
dew point temperature, in millibars. The parameters AAA y) and
OA
y) are mean air temperature weighting factors whose sum is 1.0, (see Table 3);IR 1 SCHEDULING IRRIGATIONS 35
Estimate Rn and G.–Net radiation may be estimated in several ways. One method is to use a linear regression equation:
E„ = aR s + b (10)
in which a and b are coefficients that vary slightly with climatic conditions for the area (7). A more basic equation is
En = (1 - a)R s - E L (11)
in which (1 - a) R S represents the net shortwave radiation received by a green crop with full cover; a = mean daily shortwave reflectance or albedo; and E L
= net outgoing long wave radiation. The reflectance coefficient for most green crops is about 0.22 to 0.25 (0.23 was used in Idaho). The term E L can be es-timated as
E L = (1.35 - 0.35) R L0 (12)
Rsn
in which E L , = net outgoing long wave radiation on a clear day. The term
RLq is commonly estimated using standard meteorological data as follows:
T24
2
+ T1A4
E Lq = [0.98 - (0.67 + 0.044,,re72)](11.71 x 10-8) – (13)
in which 7'2A and T1A = daily maximum and minimum absolute air
tempera-tures in degrees Kelvin. The constant, 11.71 x 10⁻⁸, is the Stefan-Boltzmann
constant, in calories per square centimeter per day per degrees K4, and the
terms in the brackets represent the emissivities for the cropped surface (0.98) and the Brunt equation for the atmosphere, respectively when using the air temperatures at shelter height. The constants in Eq. 12 (1.35 and -0.35) were derived from Davis, California. Data was obtained from Pruitt(personal com-munication), and the constant (0.67) in Eq. 13 was obtained from Idaho data and is similar to that of Goss and Brooks (8) (0.66), and Fitzpatrick and Stern (4) (0.65). The second constant in Eq. 13 is an average of California and Australia data. These coefficients may vary under different climatic regimes, and local coefficients should be used if available. Soil heat flux has been estimated from the changes in minimum and maximum air temperature, using a procedure presented by Cary (3) since with a full crop cover, the temperature of the soil surface is near the air temperature. When large changes in air temperature do not occur from day-to-day, G will be small and can be neglected.
ACKNOWLEDGMENT
This paper is a contribution from the Northwest Branch, Soil and Water Conservation Research Division, Agricultural Research Service, USDA, Idaho Agricultural Experiment Station cooperating; U.S. Bureau of Reclamation, USDI; and the Salt River Water User's Association.
APPENDIX II. –REFERENCES
1. Bayer, L. D., "The Meteorological Approach to Irrigation Control," Hawaiian Planter's
2. Bishop, A. A., Jensen, M. E., and Hall, W. A., "Surface Irrigation Systems," Irrigation of Agri-cultural Lands, American Society of Agronomy Monograph, No. 11, Madison, Wisconsin, 1967, pp. 865-884.
3. Cary, J. W., "Soil Moisture Transport Due to Thermal Gradients: Practical Aspects," Soil Science Society of America Proceedings, Vol. 30, No.4, 1966, pp. 428-433.
4. Fitzpatrick, E. A., and Stern, W. R., "Components of the Radiation Balance of Irrigated Plots in a Dry Monsoonal Environment," Journal of Applied Meteorology, Vol, 4, No. 6, Dec., 1965, pp. 649-660.
5. Franzoy, C. E., "Practical On-farm Irrigation and Soil Problem Solving," Proceedings, Western Cotton Production Conference, El Paso, Texas, Mar., 1967,
6. Franzoy, C. E., "Crop Management in the Salt River Valley," presented at the Pacific Coast Region of the American Society of Agricultural Engineers, San Mateo, Calif., Apr., 1968. 7. Fritschen, L. J., "Net and Solar Radiation Relationships Over Irrigated Field Crops," Journal,
Agricultural Meteorology, Vol. 4,1967, pp. 55-62.
8. Goss, J. R., and Brooks, F. A., "Constants for Empirical Expressions for Downcoming Atmos-pheric Radiation Under Cloudless Skies," Journal of Meteorology, Vol. 13, No. 5, Oct., 1956, pp. 482-488.
9. Hagan, R. M., Haise, H. R., and Edminster, T. W., ed., "Irrigation of Principal Crops," Section X, Irrigation of Agricultural Lands, Madison, Wisc., 1967, pp. 607-770.
10. Haise, H. R., and Hagan, R. M., "Soil, Plant, and Evaporative Measurements as Criteria for • Scheduling Irrigations," Irrigation of Agricultural Lands, American Society of Agronomy Monograph No. 11, Madison, Wisc., 1967, pp. 577-604.
11, Israelsen, O. W., et al., "Water-Application Efficiencies in Irrigation," Bulletin 311, Utah Agri-cultural Experiment Station, Mar., 1944.
12.Jensen, M. C., Middleton, J, E., and Pruitt, W. O., "Scheduling Irrigation from Pan Evapora-tion," Circular 385. Washington Agricultural Experiment Station, 1961, p. 14.
13.Jensen, M. E., ed., "Evapotranspiration and Its Role in Water Resources Management," Pro-ceedings. American Society of Agricultural Engineers, Conference, St. Joseph, Michigan, Dec., 1966, p. 66.
14.Jensen, M. E., "Water Consumption by Agricultural Plants," Water Deficits and Plant Growth, Academic Press, New York, Vol. II, 1968, pp. 1-22.
15.Jensen, M. E., "Scheduling Irrigations Using Computers," Journal of Soil and Water Conserva-tion, 1969 (In press).
16.Langley, M. N., and Robb, D. C. N , "Irrigation Water Use Efficiency," Proceedings, Interna-tional Commission on Irrigation and Drainage, 7th Congress, Mexico City, April, 1969. 17.Penman, H. L., "The Physical Bases of Irrigation Control," Proceedings, International
Horti-cultural Congress, 13:913-924, London, Eng., 1952.
18. Penman, H. L., "Vegetation and Hydrology," Technical Communication No. 53, Common-wealth Bureau of Soils, Harpenden, Eng., 1963, p. 125.
19.Pierce, L. T., "A Practical Method of Determining Evapotranspiration from Temperature and Rainfall," Transactions. American Society of Agricultural Engineers, Vol. 3, No. 1,1960, pp. 77-81.
20. Pouzoulet, Jean-Marie, "La Connaissance des Besoins en eau des Cultures," "The Determina-tion of Water Requirements of Crops," Report 1, Proceedings. InternaDetermina-tional Commission on Irrigation and Drainage, 7th Congress, Mexico City, Mex., Apr., 1969.
21. Pruitt, W. O., and Jensen, M. C., "Determining When to Irrigate," Agricultural Engineering, Vol. 36,1955, pp. 389-393.
22. Rickard, D. S., "A Comparison Between Measured and Calculated Soil Moisture Deficit," New Zealand Journal of Science and Technology, 38(10):1081-1090, 1957.
23. Rijtema, P, E., "Calculation Methods of Potential Evapotranspiration," Technical Bulletin 7, Institute for Land and Water Management Research, Netherlands, 1959, p. 10.
24. Robinson, A. R., and Humpherys, A. S., "Water Control and Measurement on the Farm," Irri-gation of Agricultural Lands, American Society of Agronomy Monograph, No. 11, Madison, Wis., 1967, pp. 828-864.
IR 1 SCHEDULING IRRIGATIONS 37
26.Tyler, C. L., Corey, G. L., and Swarner, L. R., "Evaluating Water Use On a New Irrigation Project," Research Bulletin No.62, Idaho Agricultural Experiment Station, 1964, p.24. 27.Van Bavel, C. H. M., "Use of Climatic Data in Guiding Water Management on the Farm,"
Water and Agriculture, American Association for the Advancement of Science, 1960, pp. 89-100.
28.Van Bavel, C, H. M., and Wilson, T. V., "Evapotranspiration Estimates as Criteria for Deter-mining Time of Irrigation," Agricultural Engineering. Vol. 33, No. 7,1952, pp. 417-418,420. 29.Willardson, L. S., "Irrigation Efficiency in the Escalante Valley, Utah," Utah Resources Series
37, Utah Agricultural Experiment Station, May, 1967, p. 46.
30. Wolfe, John W., "Correlation of Consumptive Use of Pasture with Evaporation from Several Devices," presented at the Northwest Section Meeting of the American Society of Agricultural Engineers, Victoria, B.C., 1960, Oct. 19-22.
APPENDIX M. —NOTATION
The following symbols are used in this paper:
A= sensible heat flux to or from the air;
CH = humidity index used in Eq. 8;
C T = an empirical air temperature coefficient which is a constant
for a given area;
es = mean saturation vapor pressure at mean dew point
tempera-ture, in millibars;
ed = saturation vapor pressure at mean dew point temperature, in
millibars;
e, and e, = saturation vapor pressure at mean maximum and mean
min-imum air temperature, respectively; E = attainable irrigation efficiency;
Et = daily evapotranspiration;
Etp = estimated daily potential evapotranspiration;
Eto = estimated daily potential evapotranspiration using the
com-bination equation, in calories per square centimeter;
G = sensible heat flux to or from the soil;
Ka = relative crop coefficient as influenced by available soil
mois-ture;
Kc = crop coefficient relating the evapotranspiration for that crop
at a given stage of growth to potential evapotranspiration;
Kea = observed crop coefficients when soil moisture was not limiting; Ks = coefficient reflecting the wetness of the soil surface;
N = the estimated number of days until the next irrigation is
needed;
Re = rainfall retained in the soil profile and usable by the crop; R L = net outgoing long wave radiation;
Lo = net outgoing long wave radiation on a cloudless day; Ra = net radiation;
Rs = daily solar radiation;
Rs° = daily solar radiation on a cloudless day;
KEY WORDS: computers; evapotranspiration; irrigation; irrigation effi-cienc%; irrigation engineering; scheduling; water utilization
ABSTRACT: The most important factor affecting irrigation efficiencies and crop yields is scheduling Irrigations in time and amount. Overirrigation may result in water-logged soils, a condition which reduces yields and generally results in increased costs for water, fertilizer, and drainage. Water use is at a minimum when the amount of water applied is just equal to the consumptive use and the leaching requirement. To achieve higher irrigation efficiencies, present_irrigation scheduling practices must be im-proved. Irrigation scheduling using climate-crop-soil data, computers to facilitate the tedious computations, and field observations by experienced personnel is a service that appears to be very attractive to the modern irrigation farm manager. This service has the potential of increasing the management skills of the farmer and his net return at a reasonable cost. It supplements the art of irrigation or experienced Judgment with the results of recent advances in irrigation science.