Photo:
The best way to limit the impact of human disturbance on wildlife and ecological pr
ocesses is to ensur
e that cor
e ar
eas of parks r
emain r
oad-fr
Introduction
Equatorial Africa sustains the continent’s
highest levels of biodiversity, especially in the
wet and humid tropical forests that harbor
Africa’s apes. This equatorial region, like
much of sub-Saharan Africa, is facing
dra-matic changes in the extent, number and
environmental impact of large-scale
infra-structure projects. A key concern is how such
projects and the broader land use changes
they promote will affect protected areas—a
cornerstone of wildlife conservation efforts.
This chapter assesses the potential impact
of new and planned infrastructure projects
on protected areas in tropical Africa,
particu-larly those harboring critical ape habitats. It
focuses on Africa not because tropical Asia
CHAPTER 4
of comparable detail are available only for
certain parts of the Asian tropics (Clements
et al
., 2014; Meijaard and Wich, 2014; Wich
et al
., 2016). Such knowledge gaps
under-score the importance of future work on
infrastructure impacts in Asia.
Ape range states in tropical Africa are
encountering an array of important changes.
These include an unprecedented expansion
of industrial mining (Edwards
et al
., 2014);
more than 50,000 km of proposed
“develop-ment corridors” that would crisscross much
of the continent (Laurance
et al
., 2015b;
Weng
et al
., 2013); the world’s largest
hydro-power dam complex (International Rivers,
n.d.-c); ambitious plans to expand industrial
and smallholder agriculture (AgDevCo,
n.d.; Laurance, Sayer and Cassman, 2014b);
extensive industrial logging (Kleinschroth
et al
., 2016; LaPorte
et al
., 2007); and
myriad other energy, irrigation and urban
infrastructure projects (Seto, Güneralp and
Hutyra, 2012).
Many of the largest infrastructure
proj-ects in Africa are being advocated because
of concerns about the continent’s booming
population, which is expected to nearly
qua-druple this century (UN Population Division,
2017). This projection is creating
apprehen-sion about food security and human
devel-opment, and broader anxieties about the
potential for social and political instability
(AgDevCo, n.d.; Weng
et al
., 2013). Africa
faces serious challenges revolving around:
1. effective design and assessments of new
infrastructure projects to limit their
envi-ronmental and social impacts;
2. good governance for nations
experienc-ing unprecedented foreign investments
for infrastructure and natural resource
extraction; and
3. management of economic instabilities
that can plague nations largely reliant on
just a few natural resources or
commod-ities for export income (see Chapter 1).
Key Findings
The main findings of this chapter are:
Africa is experiencing an unprecedented
proliferation of infrastructure projects
and, consequently, dramatic changes in
land use, the effects of which are likely to
have an impact on many protected areas
in critical ape habitats and beyond.
Advances in remote sensing, computing
power and databases are rapidly
improv-ing the quality and accessibility of
infor-mation on the distribution of roads and
other infrastructure, as well as on the
attributes and threats affecting global
protected areas.
Foreign investment, in extractive
indus-tries in particular, is playing a key role
in promoting infrastructure expansion
in Africa.
Protected areas in Africa are particularly
vulnerable to reductions in size or
down-grading of their protection status if they
hinder exploitation of natural resources
or limit infrastructure expansion.
Growing pressures from infrastructure
expansion and land use changes in the
regions immediately surrounding
pro-tected areas can have adverse effects
on ecological integrity, biodiversity and
functional connectivity. Larger parks are
generally less susceptible to such
exter-nal pressures.
While roads inside parks may foster
eco-tourism, the best way to limit the impact
of human disturbance on sensitive
wild-life and ecological processes is to ensure
that core areas of parks remain road-free.
There is an urgent need to implement
Protected Areas
In Africa, several factors complicate efforts
to conserve viable species and subspecies of
apes. One concerns the limited geographic
ranges of many apes (see the Apes
Over-view and Figures AO1 and AO2). Another
is the imprecision of published range maps,
which typically overestimate ape
distribu-tions, reflecting the fact that most species are
patchily distributed as a result of natural
hab-itat variability and spatially varying human
pressures. When such patchiness is taken
into account, many wildlife species are in
fact more seriously imperiled than suggested
by the International Union for Conservation
of Nature (IUCN) Red List classifications
(Ocampo-Peñuela
et al
., 2016). Political
conflicts, remoteness and limited scientific
resources further hinder efforts to identify
key threats and monitor ape populations.
gathered, at least some ape taxa have been
shown to suffer serious population declines.
In the eastern Democratic Republic of
Congo (DRC), for example, field surveys
suggest that the critically endangered
Grauer’s gorilla (
Gorilla beringei graueri
), a
locally endemic subspecies, has declined
by 77% to 93% in abundance over the past
two decades (Plumptre
et al
., 2015).
Although more than 6,400 protected
areas occur across sub-Saharan Africa, only
a limited number are considered “large”—
meaning that few cover more than 10,000 km2
(1 million ha)—especially in the continent’s
equatorial regions that harbor ape
popula-tions (Laurance, 2005; Sloan, Bertzky and
Laurance, 2016). In West and Central Africa,
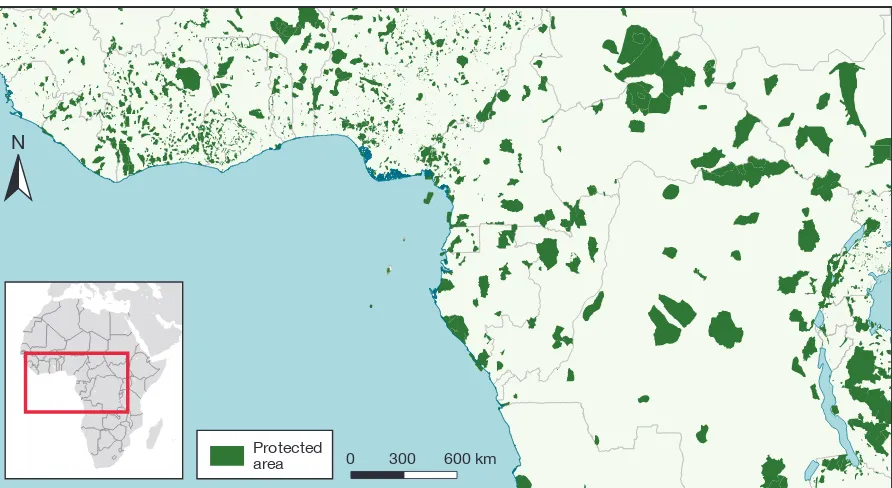
protected areas broadly coincide with ape
ranges (see Figure 4.1 and Figure AO1).
African apes are represented by five species
and a number of restricted subspecies. They
FIGURE 4.1
Protected Areas in West and Central Africa
N
0 300 600 km Protected
are separated by geographic features such
as the arid Dahomey Gap, which splits the
West African rainforests and the extensive
rainforests of Central Africa; major rivers,
such as the Congo, which separates
bono-bos from other African apes; and two tall
massifs that sustain populations of mountain
gorillas (
Gorilla beringei beringei
).
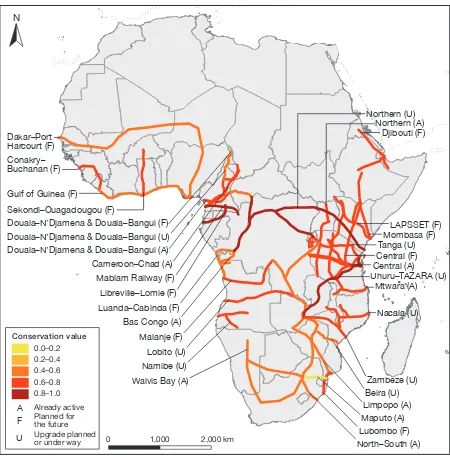
FIGURE 4.2
Conservation Values of Habitats within 25 km of 33 Development Corridors in Sub-Saharan Africa
Notes: Conservation values are estimated based on biodiversity, threatened species, critical ecosystems, wilderness attributes, environmental services and human popula-tion densities of habitats within a 25 km buffer zone around 33 proposed or existing development corridors. Values are shown on a relative scale, from 0 (low conservapopula-tion value) to 1 (high conservation value).
Data source: Laurance et al. (2015b)
Mombasa (F)
Lubombo (F)
Maputo (A)
Dakar–Port
Harcourt (F)
Conakry–
Buchanan (F)
Mablam Railway (F)
Luanda–Cabinda (F)
Malanje (F)
Libreville–Lomie (F)
Gulf of Guinea (F)
Sekondi–Ouagadougou (F)
Douala–N’Djamena & Douala–Bangui (F)
Douala–N’Djamena & Douala–Bangui (U)
Douala–N’Djamena & Douala–Bangui (A)
Walvis Bay (A)
North–South (A)
Bas Congo (A)
Cameroon–Chad (A)
Uhuru–TAZARA (U)
Zambeze (U)
Beira (U)
Central (F)
Central (A)
Limpopo (A)
Lobito (U)
Namibe (U)
Djibouti (F)
LAPSSET (F)
Northern (U)
Tanga (U)
Northern (A)
Mtwara (A)
Nacala
(U)
Nacala (U)
N
0 1,000 2,000 km
0.0–0.2 0.2–0.4 0.4–0.6 0.6–0.8 0.8–1.0 Conservation value
A
F
U
Areas from Infrastructure
Africa’s “Development
Corridors”
A true game-changer for African nature
conservation is the proposed and ongoing
construction of at least 35 development
corridors. If completed in their entirety, the
corridors will crisscross sub-Saharan Africa,
spanning a length of more than 53,000 km
in total (Laurance
et al
., 2015b).
These corridors are likely to affect
exist-ing nature reserves in at least three ways:
First, by bisecting reserves, fragmenting
them and opening them up to illegal
encroachment and poaching (Sloan
et
al
., 2016).
Second, by promoting colonization,
hab-itat loss and intensified land use around
reserves, they could decrease the
ecologi-cal connectivity of the reserves to other
nearby habitats.
Third, environmental changes in the
lands immediately surrounding a nature
reserve tend to infiltrate inside the
reserve itself (Laurance
et al
., 2012). To
some degree, a reserve with extensive
logging and hunting in its
surround-ing lands will be exposed to those same
threats within its own borders.
A detailed analysis of 33 of the proposed
and ongoing development corridors1
indi-cates that:
many corridors would occur in areas that
have high conservation value and are
only sparsely populated by people (see
Figure 4.2);
the corridors would bisect more than
400 existing nature reserves; and
assuming that land use changes
inten-experience deterioration in their
eco-logical integrity and connectivity, as
well as additional human encroachment
(Laurance
et al
., 2015b).
In total, the 33 development corridors
could bisect or degrade more than
one-third of all existing protected areas in
sub-Saharan Africa (Laurance
et al
., 2015b). The
23 corridors that are still in the planning or
initial upgrading phases would be especially
dangerous for nature. These corridors would
bisect a larger proportion of high-priority
reserves—such as World Heritage sites,
Ramsar wetlands and UNESCO Man and
Biosphere Reserves—than would existing
development corridors. Collectively, the 23
planned corridors would slice through more
than 3,600 km of reserve habitat (Sloan
et
al
., 2016).
Of the approximately 2,200 African
pro-tected areas that could be affected by
devel-opment corridors, a number include ape
range habitats. For example, two epicenters
of bisected reserves—the iron-rich belt
span-ning southern Cameroon and the northern
Republic of Congo, and the Great Lakes
region of East Africa (see Figure 4.2)—harbor
vital ape habitats (Sloan
et al
., 2016). There
would also be considerable losses of
impor-tant habitats outside of protected areas. A
simulation model developed by the World
Bank projects that in the Congo Basin, which
is critical habitat for apes, expanding roads
and transportation infrastructure will be the
biggest driver of deforestation through 2030
(Megevand, 2013).
The Grand Inga Hydroelectric
Project, DRC
electric project under construction near Inga
Falls on the lower Congo River. Should it
proceed as planned, the Grand Inga dams
will generate more electricity—40,000
megawatts (MW)—than any other single
project on Earth. To achieve this level of
output, however, the project will inundate
more than 22,000 km2 (2.2 million ha) of
largely forested lands in the western DRC
(Abernethy, Maisels and White, 2016). Dam
projects in tropical regions often have
deforestation footprints that markedly
exceed the flooded reservoir itself, because
road networks needed for dam and power
line construction also provoke major forest
disruption (Barreto
et al
., 2014; Laurance,
Goosem and Laurance, 2009; see Chapter 6).
Road Proliferation
One of the most serious effects of large-scale
infrastructure projects—be they
hydroelec-tric dams, mines, development corridors or
nearly any other large development scheme—
is that they provide a strong economic
impetus for road building. Since they can
open a Pandora’s box of hunting, land
colo-nization and other human activities, such
roads often pose a greater threat to
eco-systems and biodiversity than the original
infrastructure project itself (Laurance
et
al.
, 2015a). Moreover, many roads are
con-structed illegally; consequently, they do not
appear on official road maps.
Hence, one of the most fundamental
challenges facing those who seek to
man-age land use activities and limit their threat
to nature is simply determining the locations
of existing roads. The number of illegal and
unmapped roads is generally much greater
in developing nations, such as those that
sustain ape populations, than in wealthier
industrial nations (Ibisch
et al.
, 2016). For
this reason, simply mapping existing roads
is a major priority, one that is beset by some
important technical challenges (see Box 4.1).
BOX 4.1
The Challenge of
Mapping Roads
Key Uncertainties
A common misperception is that roads and other transportation infrastructure have been adequately mapped at the global scale, and that related data are readily available. In fact, they are not, and this lack of information creates serious challenges for nature conservation. Road maps suffer from two key sources of uncertainty. First, the quality of road maps differs markedly across nations. In Switzerland, for instance, nearly every viable road is mapped, whereas in devel-oping nations such as Indonesia or Nigeria, road maps are far from complete. Second, developing nations in particu-lar have many illegal or unofficial roads that do not appear on any map. In the Brazilian Amazon, for example, a recent analysis found nearly three kilometers of illegal, unmapped roads for every kilo-meter of mapped, legal road; further, 95% of all deforestation occurred within 5.5 km of a legal or illegal road (Barber et al., 2014). Since roads play such a dominant role in determining the pattern and pace of habitat disruption, it is vital to have a clear sense of where roads and other transpor-tation infrastructure are located (Barber
et al., 2014; Laurance et al., 2001, 2009). For information on roads, the best freely available global data set is gROADS, the Global Roads Open Access Data Set, although it suffers from notable differences in accuracy and temporal coverage across nations (CIESIN and ITOS, 2013; Ibisch
et al., 2016; Laurance et al., 2014a). gROADS staff manually digitized coarse-scale (1:1,000,000) hardcopy maps, often from the 1980s and 1990s. This process resulted in horizontal-accuracy limitations (±2 km) that restrict the use of gROADS to general comparisons, especially within, rather than across, nations.
Information Revolution
was revolutionized in 2005 with the launch of Google Maps (maps.google.com) and continued with subsequent data collection campaigns. These developments have generated detailed coverage for urban roads worldwide, although data for rural areas are much more patchy. Google Maps data have commercial applications (linked to advertising and location-based search results); their use for nonprofit websites and independent data analysis is thus restricted.
Despite their proprietary nature, Google Maps data are being used to help generate the Global Roadless Areas Map, a collaboration among Google, the Society for Conservation Biology and the European Parliament. This initiative began in 2012 under the aegis of RoadFree (www.roadfree.org), an initiative designed to highlight the importance of roadless wilderness areas for biodiversity conservation and the reduction of atmospheric carbon emissions. RoadFree has helped to spur interest in improving maps of transportation infrastructure, using a variety of data sources and techniques. In parallel with commercial road data, an initiative known as OpenStreetMap (OSM) (www.openstreetmap.org) has grown dramatically. OSM aims to create a free and editable map of the world. Since its launch in 2004, it has grown into a com-munity of more than 4 million registered members, around 2,000 of whom are making daily edits. Between late 2016 and mid-2017, the number of road features in the OSM database
increased impressively from 376 million to 430 million, in addi-tion to many other features, such as buildings.
Efforts are underway to focus OSM development on evolving environmental crises and to improve data for areas that are inadequately mapped. Notable among these are two programs aimed at mapping roads in tropical forests. The first, Road-less Forest (roadRoad-lessforest.eu), is a European Union initiative to assess the benefits of road-free forests, strongly linked to EU policies on reducing illegal logging and carbon emissions from forest disruption (FLEGT, 2016; REDD+, n.d.). The sec-ond is Logging Roads (loggingroads.org), which focuses on mapping logging roads in the Congo Basin. The good news is that all mapping improvements from these various initiatives are being placed immediately on the publicly available OSM database. An OSM Analytics platform (osm-analytics.org), released in 2016, enables tracking of this mapping activity for roads and buildings at the global level.
Technical Challenges and Advances
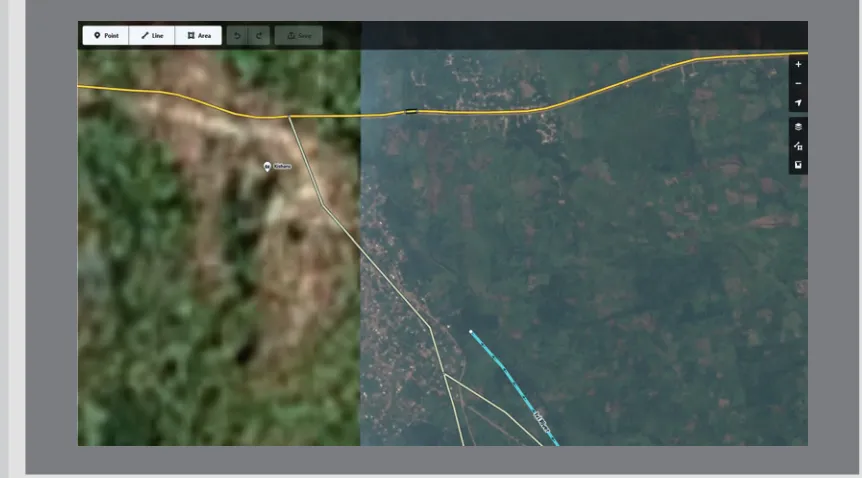
While the new road mapping initiatives are invaluable, many technical challenges remain (Laurance et al., 2016). For instance, the spatial resolution of available imagery can differ greatly across particular areas of interest, compromising efforts to create accurate and comparable infrastructure maps. Figure 4.3 illustrates that spatial resolution can vary across
FIGURE 4.3
Mapping Discrepancies in an Area of Rutshuru Reserve, Uganda, in OpenStreetMap
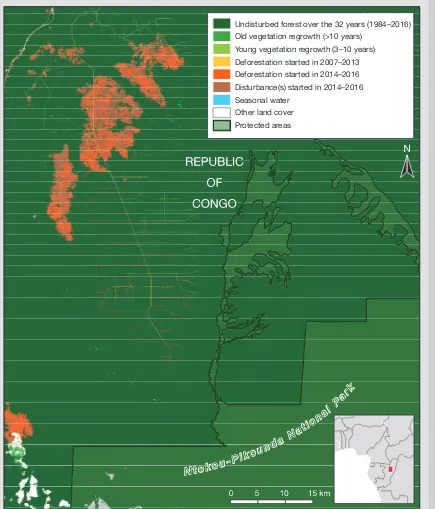
FIGURE 4.4
Recent and Ongoing Logging-Road Activity in the Congo Basin, near Ntokou-Pikounda
National Park, as Identified by Time-Series Analyses of Landsat Imagery
Source: Vancutsem and Achard (2016)
Undisturbed forest over the 32 years (1984–2016) Old vegetation regrowth (>10 years)
Young vegetation regrowth (3–10 years) Deforestation started in 2007–2013 Deforestation started in 2014–2016 Disturbance(s) started in 2014–2016 Seasonal water
Other land cover Protected areas
N t o k o
u - P i
k o u
n d a
N a
t i o
n a
l P
a r
k
N t o k o
u - P i
k o u
n d a
N a
t i o
images; it also shows inaccurate road positions derived from older coarse-scale maps.
A common assumption is that increasingly higher-resolution satellite imagery is needed for better road mapping. However, spatial data from the Landsat and EU Sentinel satellites, and composite images produced by Google Earth, all have rea-sonably high resolution, sufficient for many road-mapping applications. Furthermore, with each satellite pass, higher-resolution sensors cover a narrower swath of land than do lower-resolution ones, and therefore they return to the same area less frequently. This slow return time can be a major constraint in the effort to find cloud-free images in the wet tropical regions that are key ape habitats. Fine-scale imagery (<1 m resolution) exists but is expensive, requires massive data storage capacity and is rarely available for the remote environments inhabited by apes. Finally, the long time period over which Landsat imagery has been available allows changes in land use and roads to be observed for intervals of up to several decades (given that Landsat commenced in 1972 and Landsat Thematic Mapper, with 30-m resolution sufficient for detecting roads in dense forests, began in 1982). This long-term coverage is extremely valuable for assessing the spatial patterns and drivers of land use change over time. Until recently, high data costs, inadequate computing power and limited access to imagery precluded the systematic pro-cessing of remotely sensed data over periods exceeding 30 years. Prior to 2008, all Landsat data were provided on a commercial basis; as a result, the use of the data was meager. Once the data were made freely available, their use skyrock-eted. This has fuelled numerous innovations, of which Google Earth Engine is perhaps the most notable. Launched in 2010, it has allowed global-scale analyses using the power of Google’s own cloud-computing infrastructure.
With pricing and technical barriers for data and computing falling dramatically, opportunities for global-scale environ-mental analysis have grown rapidly. For example, researchers at the European Commission’s Joint Research Centre have developed techniques to identify forest disturbances at a resolution of 30 m × 30 m as far back as 1982, using Google Earth Engine as the processing platform (Vancutsem and Achard, 2016; see Figure 4.4). Similarly, the rapid repeat time of Landsat has allowed researchers to find enough cloud-free images to effectively monitor the expansion of tropical logging roads. This technique can be used to highlight areas sus-ceptible to road expansion and forest change (see Chapter 7), which in turn can feed into community-mapping programs such as OSM. The next step is to attempt to predict the envi-ronmental impacts of different road development scenarios on forests (Laurance et al., 2001).
Needed: Road-Detection Algorithm
For all the sophistication of modern remote-sensing technol-ogies, researchers still lack an automated computer algorithm that can reliably detect and map roads under the hugely
varying range of topographic, land use, sun-angle and road-surface conditions that one encounters in the real world. For this reason, actual road mapping is usually done with human eyes—by using the best available satellite imagery and man-ually tracing roads with a mouse onto a computer screen. Known as “armchair mapping,” this method is still the most effective for mapping roads and determining whether they are paved or unpaved. Unfortunately, this is a very time-intensive process. Even with hundreds of active mappers, several years would be required to map all the roads on the planet. By the time the mappers had finished mapping Earth’s roads, it would be necessary to start anew to identify the many new roads that would have been created since the project began. For such reasons, a holy grail for those studying roads is an automated system that can detect and map roads accurately in near-real time (Laurance et al., 2016).
Forest Monitoring
As a result of vastly improved data accessibility and com-puting power, forest monitoring by satellites has advanced impressively. In 2014, Global Forest Watch announced a revamped website (www.globalforestwatch.org), powered largely by Landsat satellite data (see Chapter 7). The next generation of Earth-observation satellites—the Sentinel-2 series from the European Space Agency—will have even higher spatial resolution (10 m), better spectral data (red, green, blue, near infrared), and faster return times (5 days) than does Landsat. The image characteristics of the Sentinel satellites will lend themselves to forest- and road-mapping applications (Verhegghen et al., 2016). The fact that their data are entirely free and open access should help to stimulate further innovations.
Next Steps
Finally, there is a need to go beyond simple maps of trans-portation infrastructure and look more broadly at accessi-bility. The World Bank and European Commission produced a Global Accessibility Map that estimates the travel time from any point on Earth to the nearest city exceeding 50,000 people (Nelson, 2008). Although focused on access to urban services, the map highlights the limited and shrinking extent of wilderness worldwide (Ibisch et al., 2016; Laurance et al., 2014a; Watson et al., 2016). With more and better roads, advances in vehicle technology and a rapid increase in the number of motorized vehicles, the globe is shrinking fast. Already, just one-tenth of the world’s land surface is more than 48 hours’ travel time from a major city (Nelson, 2008). Clearly, this is leading to increased pressure on ecosystems and biodiversity.
Protected Area
Down-grading, Downsizing and
Degazettement (PADDD)
in Africa
Documented PADDD Events
As development pressures increase,
desig-nated protected areas are sometimes
dimin-ished by legal means (Mascia and Pailler,
2011). In Africa, for instance, states have been
known to reduce the size, contiguousness
and protection status of reserves to allow
new roads, mining, energy projects and
other activities to expand. At least 23 African
protected areas have been downsized or
downgraded (Edwards
et al
., 2014, table 1).
Mining occurs more frequently in close
prox-imity to protected areas in Africa than in
either Asia or Latin America (Durán, Rauch
and Gaston, 2013). Even natural World
Heri-tage Sites, the global pinnacle of
conserva-tion, have been subjected to mining or fossil
fuel exploration or development, with 30
sites in 18 African countries affected to date
(WWF, 2015a). In the Republic of Guinea,
for example, the Mount Nimba Biosphere
Reserve, a World Heritage site, was
down-sized by 15.5 km2 (1,550 ha) to allow for iron
ore prospecting. An even greater concern is
Zambia, where nearly 650 km2 (65,000 ha)
of land within 19 protected areas has been
downgraded to permit mining activities
(Edwards
et al.
, 2014).
A number of protected areas with key
African ape habitats are under growing
devel-opment pressures. In Nigeria, for example,
a proposed “superhighway” would increase
deforestation and other pressures on Cross
River National Park, critical habitat for the
endemic Cross River gorilla (
Gorilla gorilla
diehli
) (see Case Study 5.1). Meanwhile, one
of only two surviving populations of
moun-tain gorillas, in Uganda’s Bwindi Impenetrable
National Park, could also be threatened by
a major road-upgrading project inside the
park (see Box 4.2).
BOX 4.2
Alternatives to Road
Development in an Iconic
African Park
Bwindi Impenetrable National Park in the southwest of Uganda supports a highly diverse range of plant and animal species, including the endangered eastern chim-panzee (Pan troglodytes schweinfurthii) and one of only two remaining popula-tions of the critically endangered mountain gorilla (Gorilla beringei beringei) (Plumptre
et al., 2007, 2016a; Plumptre, Robbins and Williamson, 2016c).
Although it is relatively small (321 km²/ 32,100 ha), Bwindi contributes to local and national economies through Uganda’s nature-based tourism industry and other ecosystem services the park provides. Its global importance was recognized in its designation as a UNESCO World Heri-tage site in 1994, particularly in view of the diversity of its habitats and its excep-tional biodiversity, including Albertine Rift endemics (UNESCO WHC, n.d.). In 1995 the aid agency CARE commis-sioned a study to assess the feasibility of diverting part of the Ikumba–Ruhija road, which cuts through Bwindi for 12.8 km, to land outside the park’s boundaries. The study concluded that a road diversion was feasible, identified suitable alternative routes and indicated that a new route would promote long-term protection of the park while boosting economic activity in the area (Gubelman, 1995).
However, in 2012, the Ugandan govern-ment advertised a scheme to design and construct 1,900 km of new roads in the country, including an upgrade of the road inside Bwindi, whose clay surface was to be converted to a paved road as part of a much larger road circuit (Kampala, 2012). At the time of writing, an environmental impact assessment to identify the poten-tial effects of the proposed road upgrade on the park’s ecology and wildlife had yet to be conducted.²
Concerned that the proposed upgrade could harm the park’s mountain gorillas and that it might provide few benefits for local villages outside Bwindi, the Interna-tional Gorilla Conservation Programme Photo:Bwindi’s global
(IGCP)³ partnered with the Conservation Strategy Fund and the National Environment Management Authority of Uganda to assess the upgrade scheme and to contrast it with the earlier plan to divert the road outside the park, as part of the Biodiversity Understanding in Landscape Development project, funded by the United States Agency for International Development.
This analysis showed that an alternative route, while costing more initially, would provide greater benefits for twice as many villages and would avoid the negative impacts on the park’s gorillas. Furthermore, the study suggested that the govern-ment’s plan would cost the economy upwards of US$214 million in tourism revenue losses over the 20-year life cycle of the road investment (Barr et al., 2015). These results were presented to the Uganda National Roads Authority and the Uganda Wildlife Authority.
Based on the results, representatives from the Uganda chap-ter of the Poverty and Conservation Learning Group conducted consultations with affected communities and prepared a position paper that supported diverting the road around the park (U-PCLG, 2015). During a meeting in March 2015, local stakeholders supported the view that road development around Bwindi is extremely important, and the government was urged to pursue the option of investing in diverting the road outside of Bwindi.
Prospects for PADDD
As infrastructure and resource-extraction
projects proliferate across Africa, the
poten-tial for further PADDD events could increase
dramatically. One tool that has
consider-able utility for monitoring threats to parks
is a global database known as the Digital
Obser vatory for Protected Areas (DOPA).
DOPA provides a wide range of indicators
of park features, habitats, species
composi-tion, irreplaceability and threats (see Box
4.3). These metrics could be used to monitor
changes over time for a single park and to
assess national trends in park protection.
Comparisons of environmental threats across
parks in different ecoregions or nations need
to be conducted carefully because of
poten-tial differences in data quality and
normal-ization procedures.
The research conducted for this chapter
involved an evaluation of the practical
util-ity of DOPA for assessing threats to parks.
To that end, the effects of two factors that
could influence the proliferation of roads
inside parks were compared: park area and
road pressure immediately outside the park.
The study hypothesis held that larger parks
would have fewer roads than smaller ones,
and that parks with many surrounding roads
would also have many internal roads.
For purposes of this research, road
pres-sure inside the park was defined as the total
number of kilometers of road length (km)
divided by park area (km2). To quantify
external road pressure, a 30-km buffer zone
was defined around each park and an inverse
distance–weight function was used to
calcu-late pressure from all roads inside the buffer
zone. This approach applies greater weight
to roads near a park than to those farther
away. In all cases, gROADS was used to
gen-erate data on roads (see Box 4.1).
The analysis generated data for 656
pro-tected areas within ten countries in
equato-rial Africa:
Cameroon;
the Central African Republic;
the DRC;
Gabon;
Ghana;
Ivory Coast;
Liberia;
Nigeria;
the Republic of Congo; and
Sierra Leone.
Not all protected areas in these nations
harbor apes or ape habitats, nor were all
protected areas with African ape
popula-tions included in the analysis. Via a
gener-alized linear mixed-effects model, “nation”
served as a random variable, in order to
reduce differences in road-map quality at
the national level.4
Despite limitations in the available data
sets, the results of the analysis appear clear:
road pressure inside each park was strongly
influenced by its external road pressure, but
park size had a weaker and less consistent
influence (see Figure 4.5).5 These findings
sug-gest that as roads proliferate across equatorial
BOX 4.3
Digital Observatory for Protected Areas (DOPA)
DOPA (dopa.jrc.ec.europa.eu) is an online system developed by the European Commission’s Joint Research Centre to provide key indica-tors of the pressures facing more than 16,000 terrestrial and marine protected areas, each of which exceeds 100 km² (10,000 ha) (Dubois
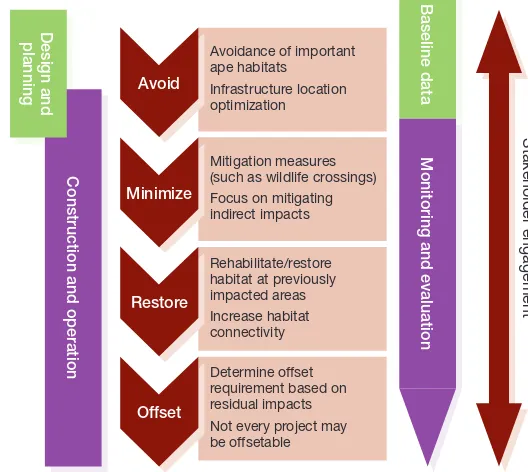
Avoidance of important ape habitats
Infrastructure location optimization
Mitigation measures (such as wildlife crossings) Focus on mitigating indirect impacts
Rehabilitate/restore habitat at previously impacted areas Increase habitat connectivity
Determine offset requirement based on residual impacts Not every project may be offsetable
Africa, protected areas could experience
marked increases in internal road pressure.
The effects of park size are variable, although
the largest parks rarely suffered high
inter-nal road pressure.
The Mitigation Hierarchy:
Reconciling Infrastructure
and Ape Conservation
The Mitigation Hierarchy
Given the likelihood that many large-scale
infrastructure projects will proceed, a major
priority is to limit their various direct and
indirect environmental impacts. The
mitiga-tion hierarchy can be applied throughout
the life cycle of a project to aid the process
of constructive engagement (see Figure 4.6
and Table 3.3). It aims to minimize negative
impacts and to offset any significant impacts
that remain (TBC and CSBI, 2015). A new
Effects of External Road Pressure and Park Area on Internal Road Pressure for
656 Protected Areas in Ten Nations in Equatorial Africa
FIGURE 4.6
The Mitigation Hierarchy Applied to Infrastructure Projects
within Ape Habitats
Road pressure inside park
Road pressure outside park Park area
Road pressure inside park
Notes: Curves show predicted values; shaded areas are 95% confidence intervals. Each curve shows the effect of the predictor variable on internal road pressure once the effects of the other predictor and cross-national differences were statistically removed.
Construction and operation
Design and
planning
Baseline data
Monitoring and evaluation
Avoid
Minimize
Restore
Offset
energy, transportation, and
mining/miner-als sectors were responsible for more than
97% of offsets and compensation measured
by cumulative land area under management”
(Bennett, Gallant and ten Kate, 2017, p. 5).
The mitigation hierarchy is
increas-ingly required by project lenders, including
the International Finance Corporation and
World Bank (IFC, 2012c; World Bank, 2017).
It is also becoming integrated into
environ-mental legislation around the world,
includ-ing in many ape range states (TBC, 2016).
The hierarchy follows four sequential steps:
avoid, minimize, restore and offset.
Step 1: Avoid
When operating in ape habitat, the first step,
avoidance, is the most crucial and effective.
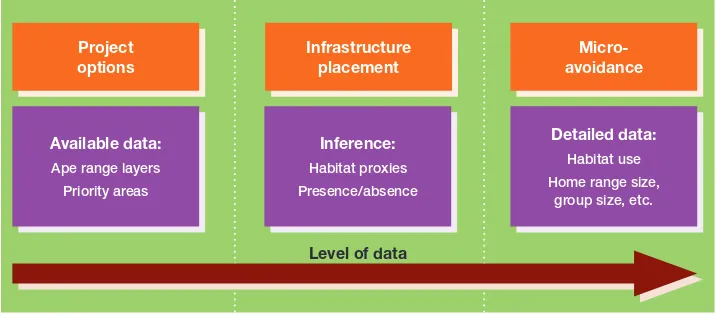
It requires early data gathering and
plan-ning, ideally at the start of the design and
planning phase (see Figure 4.7).
The consideration of alternative routes
or project siting is an important early task
as it may allow important ape habitat to be
avoided. At this stage, projects are rarely
able to finance extensive data collection
and instead rely on readily available data.
Available maps of priority areas for ape
con-servation, such as those produced by regional
or national action planning processes, can be
extremely useful (Golder Associates, 2015;
Rio Tinto Simfer, 2012b). However,
compa-nies that design infrastructure projects may
not be aware of such data, and therefore
ape conservationists may need to take the
initiative of sharing data in usable formats
and of directing decision-makers to
avail-able resources, such as the A.P.E.S. Database
(Max Planck Institute, n.d.-b).
Once a broad project option has been
adopted, finer-scale optimization of
infra-structure placement can further ensure that
construction is avoided in sensitive ape
habitat. This requires more detailed
infor-mation on ape distribution and habitat use
in relation to proposed infrastructure
loca-tions, as can be gathered via surveys
con-ducted as part of environmental and social
impact assessments (ESIAs). For example,
the ESIA for the Simandou Iron Ore Project
in Guinea revealed that chimpanzees
prin-cipally used the western side of the mining
concession. As a result, all mine-associated
infrastructure was relocated to an
economi-cally suboptimal location in the east of the
concession, to avoid important chimpanzee
habitat (Rio Tinto Simfer, 2012a).
FIGURE 4.7
Levels of Data Required to Inform Avoidance Measures in the Mitigation Hierarchy
Source: © TBC, 2017
Level of data Project
options
Infrastructure placement
Micro- avoidance
Available data: Ape range layers Priority areas
Inference: Habitat proxies Presence/absence
Detailed data: Habitat use Home range size,
If it is not possible to avoid impacts on apes
and their habitat entirely, minimization
measures can often reduce the extent and
intensity of remaining negative impacts. In
addition to being good practice,
minimi-zation measures, such as noise and dust
reduction and ape-specific measures, may
be appropriate. Sufficient ecological data
are required to guide informed planning of
minimization actions for apes. If there is
uncertainty, monitoring and adaptive
man-agement may be required.
For apes the indirect impacts of large
infrastructure projects, particularly increased
poaching and habitat loss due to induced
access and in-migration, are usually the most
serious (IUCN, 2014b; Vanthomme
et al.
,
2013). These impacts can occur on a large
scale and thus effective minimization
mea-sures may also need to be implemented at
large scales. Such minimization efforts were
made in the context of the public–private
partnership between the government of
Cameroon and the private railway
devel-oper CAMRAIL, with the aim of reducing
the illegal transport of wild meat, including
chimpanzee, that could be facilitated by
the railway (Chaléard, Chanson-Jabeur and
Béranger, 2006).
Minimization measures can be
capital-intensive while also requiring ongoing
invest-ment by infrastructure developers. It can
therefore be difficult to demonstrate the
business case for minimization if data or
experience is limited. Such is the challenge
regarding wildlife crossings, including
arti-ficial canopy bridges. While they have been
shown to be effective at maintaining
con-nectivity for the more arboreal gibbons
and orangutans, these bridges have never
been trialed with African great ape species
(Das
et al
., 2009; see Box 2.2). Hence, their
effectiveness at facilitating movements, and
their potential for making apes more
vul-poorly understood include tolerable noise
levels and the potential barrier to ape
dis-persal caused by large-scale linear
infra-structure projects.
Step 3: Restore
Complete restoration of ape habitat may not
be possible or achievable within a project
timeline, and thus it may be more suitable to
consider habitat rehabilitation. Examples of
rehabilitation measures include planting
native tree species, preventing uncontrolled
burning and removing damaging species
(mainly non-native or invasive species).
Habitat rehabilitation is a long-term
pro-cess. Apes use complex habitat and often
rely on tree species that take many years to
reach maturity. Native tree species used by
apes may also require special conditions to
grow that are challenging to re-create. It is
thus nearly impossible to re-create original
habitats and, as a result, it is not possible to
rely on restoration actions to make a
signifi-cant contribution to reducing the magnitude
of project impacts on apes (Maron
et al.
,
2012). Nonetheless, targeted habitat
reha-bilitation can serve as a valuable means of
increasing habitat connectivity in fragmented
landscapes.
Step 4: Offset
Any negative impact that remains after the
first three steps of the mitigation hierarchy
have been applied is termed a “residual
impact.” Offsets of such impacts are
mea-sures of last resort; their use with respect to
threatened and charismatic species such as
apes is often seen as controversial (Kormos
Sumatran orangutan (Pongo abelii) Bornean orangutan (Pongo pygmaeus) Offset policy
No policy Developing Enabled or required
N
N
Eastern gorilla (Gorilla beringei) Western gorilla (Gorilla gorilla) Bonobo (Pan paniscus) Chimpanzee (Pan troglodytes) Offset policy
No policy Developing Enabled or required
FIGURE 4.8
Ape Range Countries with an Offset Policy (as of 2016) for (a) Bonobos, Chimpanzees and Gorillas;
(b) Orangutans; and (c) Gibbons
a
N
Hoolock species
Hylobates species
Nomascus species
Siamang (Symphalangus syndactylus) Offset policy
No policy Developing Enabled or required
Several ape species and subspecies have
very restricted geographic ranges (see the
Apes Overview). A project that would have
a negative impact over a significant extent
of a species or subspecies’ range would be
difficult or impossible to offset, and thus
would be unlikely to be supported by
con-servation stakeholders. Similarly, impacts
that compromise the viability of identified
regional priority areas for ape conservation
population in the long term (Kormos
et al.
,
2014). These requirements mean that the loss
of even a few individual apes could translate
into very significant offset requirements to
meet “no net loss” definitions (IUCN, 2014a).
Offset requirements to compensate for
impacts of development projects are
increas-ingly becoming integrated in national
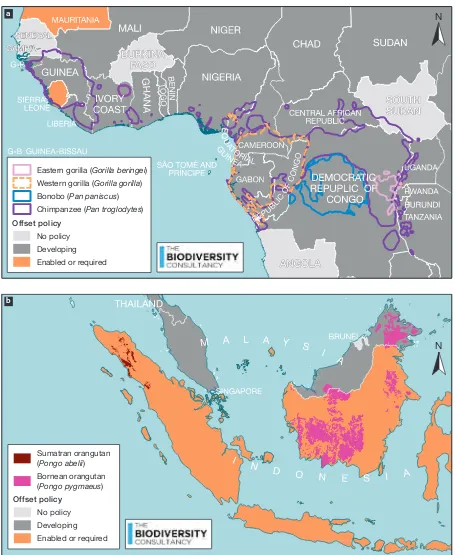
legis-lation (ten Kate and Crowe, 2014). In Asia,
most orangutan and gibbon range states have
legislation either requiring or enabling
bio-diversity offsets, while many African ape
range states are developing such national
policies (TBC, 2016; see Figure 4.8). There
is thus an opportunity for governments and
ape conservationists to work together to
ensure such policies provide appropriate
protection for apes and their habitat.
The Importance of
Stakeholder Engagement
Apes are iconic animals and any negative
impacts on them or their habitats attract high
interest and scrutiny from the general public,
stakeholders and lenders. Therefore,
infra-structure developers face potentially serious
reputational risks when operating within ape
habitat, which makes consultations with
stakeholders and ape experts at an early stage
advisable. Stakeholders such as universities
and conservation groups can provide
special-ized knowledge that can be input into the
project design and add credibility to a project,
while reducing impacts on apes. Engagement
with stakeholders is most effective when it
begins in the early stages of a project and
continues throughout its life span, through
every step of the mitigation hierarchy.
Cumulative Impacts and the
Mitigation Hierarchy
Cumulative impacts are defined as the
incre-mental impacts of one project, combined
with the past, present and foreseeable impacts
arising from other developments (such as
infrastructure, extractive or agricultural
activities) within the same geographic and
connected areas (IFC, 2012b). Cumulative
impacts often arise when a country is
under-going rapid development, for example when
multiple dams are planned for
construc-tion on the same river (Winemiller
et al.
,
2016). Environmental impact assessments
for any single project often fail to adequately
consider the wider or additive effects of
other projects in the same vicinity (Laurance
et al.
, 2015a; see Chapter 1, p. 32). This can
be severely detrimental to species such as
apes, as numerous projects have large impacts
across populations and reduce population
connectivity.
There has been increasing pressure
from stakeholders for individual projects
to take cumulative impacts into
consider-ation. Best-practice guidelines require
cumulative impact assessments (CIAs); in
practice, this step often receives insufficient
attention or is omitted completely. A major
barrier is the lack of clarity about whose
responsibility it is to organize and pay for a
CIA, particularly in a landscape that
com-prises multiple development projects with
different timelines. However, if conducted
rigorously and systematically, CIAs could
greatly strengthen regional and national
planning processes (IFC, 2013).
CASE STUDY 4.1
The Mitigation Hierarchy and Cumulative
Impacts: A Case Study from Guinea
The Republic of Guinea in West Africa has large mineral deposits such as bauxite, gold and iron and its mining sec-tor is undergoing rapid development. Major deposits can be found in different parts of the country, often inland, far from the coastline. Large infrastructure projects, such as railways and roads, are being planned to transport ore from mine sites to seaports for export to international markets (Republic of Guinea, n.d.).
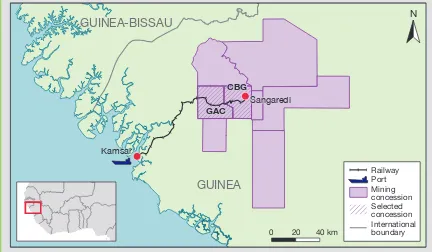
Bauxite reserves in Guinea are concentrated in the north-west of the country, where they overlap with the range of the critically endangered western chimpanzee (Pan troglodytes verus) (Humle et al., 2016a). Several mining companies are active in this region and hold adjacent concessions. Most projects are operating independently and have not yet effec-tively tackled the issues related to cumulative impacts. Two neighboring companies, however, are working towards imple-menting international best-practice standards and address-ing cumulative impacts. These companies—the Compagnie des Bauxites de Guinée (CBG) and Guinea Alumina Corpora-tion (GAC)—need to develop or upgrade roads to transport their bauxite ore to a port site located about 140 km away.
They will share an existing railway so that they may reduce their cumulative impact (see Figure 4.9).
Following the mitigation hierarchy, both companies are con-sidering the option of setting aside a portion of their conces-sions to avoid sensitive chimpanzee habitat. Extensive surveys for chimpanzees have been conducted to help inform mitiga-tion planning. Mitigamitiga-tion measures, which were developed to minimize both direct and indirect impacts, are outlined in each company’s biodiversity action plan.
GAC has also established a nursery with native tree species that are known to be used by chimpanzees for feeding and nesting. These species will be used to rehabilitate areas previously impacted by the project as well as other degraded areas that were cleared by the local population using slash-and-burn cultivation.
Despite the various measures, preliminary assessments show that both companies will have residual impacts on chimpan-zees; offset requirements were thus estimated separately for each company. As Guinea lacks national offset planning and updated maps of priority areas for chimpanzees, GAC has supported a nationwide chimpanzee survey to find the most appropriate offset site. This site may be large enough to pro-vide an aggregated offset, where other companies could also contribute towards protecting a large population of the west-ern chimpanzee.
Sources: © TBC, 2017
FIGURE 4.9
Locations of the CBG and GAC Mining Projects and the Railway to Be Shared, Guinea
GAC
CBG
Kamsar
Sangaredi
GUINEA-BISSAU
Kamsar
Sangaredi
GAC
CBG
GUINEA
GUINEA-BISSAU
N
0 20 40 km
and information on the mitigation
hierar-chy are available on the website of the
Busi-ness and Biodiversity Offsets Programme
(http://bbop.forest-trends.org/).
With its rapidly growing populations, a
dire need for economic and social
develop-ment, and exceptional natural riches, Africa
represents serious challenges for
environ-mental planners and managers. Unless these
challenges can be addressed meaningfully,
social instability and serious environmental
damage will be unavoidable. The worst-case
BOX 4.4
Virunga National Park:
Promoting Socioeconomic
Development alongside
Conservation
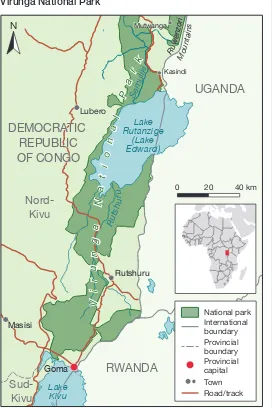
The history of the Democratic Republic of Congo (DRC) is characterized by the exploitation of its vast natural resources. Yet despite the abundance of this natu-ral wealth, extreme poverty has spread throughout the country. This paradox is exemplified by the DRC’s water crisis: notwithstanding its immense freshwater resources, only 25% of the population has access to safe drinking water (and only 17% in rural areas), one of the lowest rates in sub-Saharan Africa (WSP, 2011). The legacy of colonialism, state collapse during the Mobutu years and recurring armed conflicts—of which the most significant followed the Rwandan genocide—have left the DRC with weak institutions and a chronically defective public infrastructure, particularly in the eastern provinces. The catastrophic loss of life among civil-ians during the conflict years was princi-pally attributable to indirect public-health effects, such as the dysfunction of water and sanitation infrastructure. Despite the international community’s investments in peacekeeping, development aid and humanitarian relief (at an annual cost of up to US$15 billion), little has been achieved to prevent a resurgence of armed conflict. In the face of overwhelming challenges, a community of institutions—the Institut Con golais pour la Conservation de la Nature (ICCN)—is working in partnership with the Congolese authority for conserva-tion in Virunga Naconserva-tional Park, in the east-ern DRC (Figure 4.10). ICCN has invested more than US$60 million6 to develop a
holistic approach to social justice and conservation in this conflict-ridden region. Virunga is Africa’s oldest national park and a UN World Heritage Site, home to mountain gorillas and chimpanzees, as well as other endangered and endemic wildlife. It is plagued by ungoverned resource extraction as members of local communities hunt for food, clear forest for agriculture and gather fuelwood and charcoal for energy, lighting and heating.
FIGURE 4.10
Virunga National Park
V
i
r
u
n
g
a
N
a
t
i
o
n
a
l
P
a
r
k
Mutwanga MasisiDEMOCRATIC
REPUBLIC
OF CONGO
RutshuruLake
Kivu
Ruw enzo riGoma
Lake
Rutanzige
(Lake
Edward)
Ru
ts
hu
ru
Se
m
ul
iki
Lake
Rutanzige
(Lake
Edward)
Lake
Kivu
Ruw enzo ri Mou ntai nsV
i
r
u
n
g
a
N
a
t
i
o
n
a
l
P
a
r
k
Lubero Mutwanga Kasindi Rutshuru MasisiGoma
Nord-Kivu
Sud-Kivu
RWANDA
DEMOCRATIC
REPUBLIC
OF CONGO
UGANDA
N
0 20 40 km
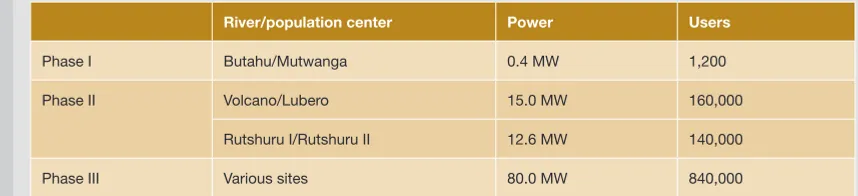
TABLE 4.1
The Virunga Alliance’s Hydropower Plan
River/population center Power Users
Phase I Butahu/Mutwanga 0.4 MW 1,200
Phase II Volcano/Lubero 15.0 MW 160,000
Rutshuru I/Rutshuru II 12.6 MW 140,000
Phase III Various sites 80.0 MW 840,000
Source: Virunga National Park (n.d.)7
Along with the ICCN, a wider investment program known as the Virunga Alliance draws on the resources of the park to deliver broad-based services to the community in a way that is sensitive to the environment, focused on the needs of the poorest and most vulnerable, and supportive of stability in the region. Established in 2009, the Virunga Alliance was developed as three programs that may be visualized as con-centric circles. The innermost circle is focused on conserva-tion and protecconserva-tion of the park, as well as tourism. The second relates to socioeconomic development through the four main sectors of development: sustainable energy, tourism, agro-industry, sustainable fisheries, as well as measurable improve-ments in local infrastructure. These programs target the local population—principally the six million people in North Kivu (MONUSCO, 2015). The third circle targets private-sector investment to stimulate the local economy and to help bring people out of the cycle of poverty. Using a busi-ness approach to service delivery, the Alliance generates dividends from tourism and energy provision to industry, and reinvests these funds into the conservation and social infra-structure of the park.
Virunga’s program of socioeconomic development—the second circle—focuses on renewable energy, sustainable fisheries, agro-industry and tourism. The region has vast natu-ral wealth, including fertile soil, regular rainfall and abundant hydrological resources. The park’s rivers feed Lake Edward, which flows into the Semliki River to form the source of the Nile. Millions of people depend on the park’s healthy rivers and lake. There is very little infrastructure, however, to pro-vide the local people with adequate water and energy sup-plies. The Virunga Alliance is working to supply hydroelectric power to nine towns in North Kivu on a build–operate–transfer basis. Eight hydropower plants, with the effective capacity of 108 megawatts (MW), and two interconnected networks will be built over 9 years, with the first completed in 2012 (see Figure 4.10 and Table 4.1). Two plants are already oper-ational. Access to electricity is expected to provide a boost to local agriculture, thus helping to create 80,000 to 100,000 new jobs.
The hydropower feeds a grid, connecting consumers via a prepaid, smart metering system. Each megawatt of electric-ity is expected to produce as many as 1,000 jobs, based on the results of the Mutwanga hydroelectric pilot project in the north of the park, which was completed in 2013. The Matebe plant and Rutshuru grid are expected to create 13,000 per-manent jobs, mostly in the small business sector. There is a sizeable waiting list of consumers and small busi-nesses that want to be connected to the grid, as grid electric-ity is substantially cheaper than the current power source— diesel generators. Indeed, a typical small business would save US$17 per month on power costs by connecting to the grid. This is a saving of US$204, which is more than half the aver-age annual income ($394.25; Tasch, 2015). At present, the Mutwanga hydroelectric facility, managed by the park author-ity, provides electricity free of charge to schools and hospitals in the region.
The Virunga program assumes that increasing private-sector investment will accelerate economic development catalyzed by the hydroelectric program. Until now, Virunga has lacked a practical strategy to provide funding to small local busi-nesses. Identifying a viable instrument for financing small Congolese-owned businesses is vital. The program is devel-oping a Smart-Grid Small Business Loan Fund, capitalized with equity funding (grants or unsecured loans); the fund will approve, disburse, monitor and collect repayments on loans to small businesses that are also clients of the Virunga power grid.
scenarios of natural-resource exploitation in
Africa—driven by foreign capital, distorted
by endemic corruption and resembling
“feeding frenzies” of predatory behavior
(Edwards
et al.
, 2014)—are far too common.
At the same time, innovative initiatives
that are well planned and executed, attuned
to social needs and sustainability outcomes,
and long-term in nature are rare.
Africa does have a few examples of
enlightened infrastructure projects—ones
driven by visions of social and
environmen-tal betterment (see Box 4.4). Such
endeav-ors, woven integrally into the surrounding
cultural fabric, might be better described as
“initiatives” rather than projects, in that their
goals are less about generating profits than
yielding broad-based social betterment and
environmental sustainability.
Future Threats
and Prospects
Narrow Window of
Opportunity
The focus of this chapter is the potential
effects of large-scale infrastructure
expan-sion on ape habitats in equatorial Africa. The
conclusions, by any measure, are alarming.
Without determined efforts to modify,
recon-sider and mitigate the impact of current
development schemes, apes and their
bio-logically rich environments in Africa are
likely to suffer irreparable harm.
The threats to African apes and their
habitats are imminent, in the sense that many
crucial changes will play out over the next
1–3 decades. However, the recent decline in
global commodity prices, particularly for
minerals and fossil fuels, provides a
poten-tial window of opportunity of a few years
to employ direly needed land use planning
and infrastructure-prioritization schemes
(Hobbs and Kumah, 2015).
Two broad developments are critical to
the promotion of strategic planning. The
first is an expansion of the application of
the mitigation hierarchy. The second is the
implementation of viable financial strategies
designed to help developing nations meet
pressing economic and food-production
needs while limiting the environmental
impacts of rapid infrastructure development.
For these nations, payments for ecosystem
services, ecotourism and sustainable
har-vesting of native production forests, as well
as strategic investments in natural capital
could potentially help to balance economic
and environmental priorities (Laurance and
Edwards, 2014; see Box 4.5).
BOX 4.5
Using Natural Capital to Promote
Sustainable Infrastructure
The Idea
Healthy, intact ecosystems are essential for apes, gibbons and other wildlife. People also rely on these ecosystems for myriad benefits, including:
medicinal plants; water supplies;
areas of cultural and spiritual importance; carbon storage and sequestration; and pollination of crops (MEA, 2005).
Reflecting human dependence on nature, natural resources are increasingly viewed as “natural capital” that supplies “eco system services” (Kumar, 2011). These economic meta-phors emphasize the importance of maintaining our stock of assets over time to ensure a long-term supply of benefits. The concepts can resonate with groups that have previously had limited interest in conservation, including ministries of finance and planning, private investors and business leaders (Guerry et al., 2015; Natural Capital Coalition, n.d.; NCFA, n.d.; Ruckelshaus et al., 2015).
The Challenge
It has been estimated that achieving the United Nations Sustainable Development Goals and realizing the climate commitments made in the Paris climate accord of 2016 will require approximately US$90 trillion in infrastructure invest-ments, particularly in urban development, transportation and clean energy (Global Commission on the Economy and Climate, 2016). A majority of these investments will be in the developing world, including ape and gibbon range states. This new infrastructure is essential for economic develop-ment, poverty reduction and human well-being. If the infra-structure is poorly planned, however, it not only imperils apes and gibbons, but also the benefits that are provided by nature to humans, undermining the very human develop-ment that the infrastructure was intended to support (Mandle
et al., 2016a).
Environmental issues are typically considered late in the development planning process, and often when only marginal changes to project design can realistically be considered (Laurance et al., 2015a; see Box 1.6). Even though such gaps can be addressed through strategic environmental assess-ments, impacts on ecosystem services continue to be con-sidered late or not at all, even when an infrastructure project’s success depends directly on ecosystems, for example to reduce the risks of flooding or erosion (Alshuwaikhat, 2005; Mandle et al., 2016a). The transformation of this deeply flawed model of infrastructure planning and investment is a matter of critical urgency.
The Opportunity
Impacts on natural capital and those who depend on it can best be mitigated if they are centrally integrated into infra-structure planning, assessment and development processes from the outset. This early incorporation can build a pipeline of projects that genuinely take into account interlinked envi-ronmental, social and economic considerations. There is con-siderable demand for such projects: “patient” financial capital is invested to produce high-yielding, stable, long-term, income-oriented returns (Roberts, Patel and Minella, 2015). Around the world, people are now developing, accessing and sharing information about natural capital to inform develop-ment planning (Brown et al., 2016; Guerry et al., 2015). These approaches identify the manifold benefits that nature currently provides and attempt to anticipate what might happen to those benefits in response to global climate change, and as resource management and human interactions with nature change (Ruckelshaus et al., 2015). Tools are being devised to help incorporate environmental priorities into real-world decision-making.9 Governments and businesses can use this
type of information to identify areas that are important sources of natural capital and that should be avoided or protected to minimize the negative impacts of built infrastructure (Laurance
et al., 2015b). Such knowledge can also be used to iden-tify positive impacts of ecological restoration—for example, investing in reforestation around rivers to enhance fisheries. There is also demand from businesses and investors for help in determining the best locations for new infrastructure (Laurance et al., 2015a; Natural Capital Coalition, 2016). Environmental and social impact and risk assessments have often ignored companies’ dependence on ecosystem ser-vices such as clean air, fertile soil and reliable water supplies. This puts companies at risk—for example, from flooding, drought and shortages that could affect their supply chains. To lessen these risks, companies can incorporate natural capital information in decision-making. The Natural Capital Protocol is a decision-making framework that provides guid-ance for businesses looking to manage risks and seize oppor-tunities by integrating the value of nature into their internal decision-making (Natural Capital Coalition, 2016).
Some Examples
national ecosystem assessment—carried out from 2000 to 2010—quantified and mapped changes in food production, car-bon sequestration, soil retention, sand-storm prevention, water retention, flood mitigation and the provision of habitat for biodiversity. It showed significant improve-ments in most services, with the worrying exception of habitat for biodiversity con-servation (Ouyang et al., 2016). Incorporating natural values into project planning also has much potential to con-tribute to conservation in the ape range states of Africa and Asia, even where data and capacity are limited (Bhagabati et al., 2014; Mandle et al., 2016b; Univer-sity of Cambridge, 2012; Watkins et al., 2016). In the Greater Virungas land-scape, a key region for the conservation of gorillas and chimpanzees in Africa’s Albertine Rift, a natural-capital assess-ment helped decision-makers in Rwanda and the DRC to identify the location and importance of areas for water yield, sed-iment retention, carbon storage and non-timber forest products (University of Cambridge, 2012). In Myanmar, a national assessment showed where and how natural capital contributes to clean and reliable drinking water, reduces risks from inland flooding and coastal storms, and maintains reservoir and dam function-ing by greatly reducfunction-ing erosion (Mandle et al., 2016b). In Indonesia, natural-capital tools were used to inform spatial plan-ning in Sumatra and Borneo, and at the national level. The informed land use planning will be incorporated into efforts to build governance and financing that improve outcomes for people and biodi-versity (Bhagabati et al., 2014; GEF, 2013; Sulistyawan et al., 2017).