A Conceptual Process of Implementing Quality Apparel Retail Store Attributes: An
Application of Kano’s Model and the Quality Function Deployment Approach
Shubhapriya Bennur, PhD
Assistant Professor
Department of Textile Clothing and Design
214, HECO
University of Nebraska
Lincoln, NE 68284
United States of America
Byoungho Jin, PhD
Putman and Hayes Distinguished Professor
Department of Consumer, Apparel and Retail Studies
The University of North Carolina at Greensboro (UNCG), USA
210 Stone Building
Greensboro, NC 27402-6170
United States of America
Abstract
Retail store attributes play a significant role in customer satisfaction. It is important to identify the attributes, prioritize them and strategically focus on implementing important attributes that fulfill customer expectations. Very limited studies have been directed towards understanding the accurate roles of store attributes in customer satisfaction and effectively implement important store attributes in apparel retail store settings. Therefore, this study proposes a conceptual frame work for implementing quality apparel retail store attributes using an integrated method of Kano’s model and the quality function deployment approach which ensures customer satisfaction.
Key words:
Store attributes, Apparel retail store, Kano‟s method, QFD, Customer satisfactionIntroduction
Competition among U.S. apparel retailers has reached an unprecedented level of intensity. To drive profits and remain competitive, retailers must be able to attract and retain customers. Retail store attributes play a significant role in consumer store choice, purchase decision, and satisfaction (Berry, 1986; Leszczyc & Timmermans, 2001). Therefore, retailers‟ thorough understanding as to which store attributes attract customers is critically important. As such, a wide variety of store attributes (Birtwistle & Shearer, 2001; Chowdhary, 1999; Lindquist, 1974) and their importance have been identified (Berry, 1986; Leszczyc & Timmermans, 2001). While attributes play a critical role in customer satisfaction, not all store attributes are equally important in affecting customer satisfaction (Mittal, Ross, & Baldasare, 1998) and the relationship between attributes and satisfaction is not as simple as linear (Ting & Chen, 2002).
While Kano‟s classification aids in prioritizing important attributes, QFD guides in implementation of these important attributes. QFD provides a structured process for service providers to assure high quality attributes and customer satisfaction while maintaining a competitive advantage. The „Quality‟ in QFD refers to delivering value to customers by identifying customer wants and needs and translating these demands into actionable services. The purpose of this study is to provide assistance to the apparel retail industry by guiding the process of implementing quality retail store attributes by integrating Kano‟s model and QFD. The scope of this study is to illustrate how to, rather than actual implementation. This study focuses on apparel retail stores for two reasons. Because of their critical role in creating brand image, store attributes in apparel retail stores need to be more carefully manipulated than in other retail sectors. In addition, the low growth rate of U.S. apparel retailers for the past 10 years (Badgett, Boyce, Vantine, & Hittner, 2008) may necessitate that the sector find ways to attract and retain more customers. This study begins with introducing Kano‟s classification of store attributes, and then discusses implementation of important store attributes using the QFD method. Finally, academic and practical implications and suggestions for future research are discussed.
Literature Review
Kano’s theory
Professor Noriaki Kano developed Kano‟s theory in the „80s. Noting the different roles of attributes on customer satisfaction, Kano distinguished the attributes into three distinct categories: „must-be attributes,‟ „performance attributes,‟ and „attractive attributes‟ (Kano et al., 1984). Customers believe that a must-be attribute is a necessity and a prerequisite. If this attribute is not present, customers will be dissatisfied, but the presence of the attribute will not increase customer satisfaction. Must-be attributes are a decisive competitive factor; if they are not fulfilled, the customer will not be interested in the product at all (Matzler & Hinterhuber, 1998). An example of a must-be attribute in an apparel retail store could be the dressing room. The customers may expect a dressing room and take it for granted; without it customers will be dissatisfied. Performance attributes are related to the performance of the product and are usually explicitly demanded by customers. When a performance attribute is present, customers will be satisfied. The higher the attribute performance is, the higher the level of satisfaction will be. When this attribute is not present, though, customers will be dissatisfied. For example, a performance attribute in a retail store could be the store personnel.
The better the store employee performs his duties, such as helping the customer, being courteous and friendly, etc., the more satisfied the customer is, and vice versa. Attractive attributes have the greatest influence on how satisfied a customer will be with a given product. Attractive requirements are neither explicitly stated nor expected by the customer. The presence of attractive attributes leads to more than proportional satisfaction. If attractive attributes are not present, however, there is no feeling of dissatisfaction (Matzler & Hinterhuber, 1998). An example of an attractive attribute in an apparel retail store could be a magic mirror in the dressing room that displays a description of the garment, as well as other available colors and sizes, and suggests accompanying accessories. The absence of a magic mirror will not necessarily result in customer dissatisfaction or loss of customers, but the presence of the mirror creates joy for consumers, more than mere satisfaction.
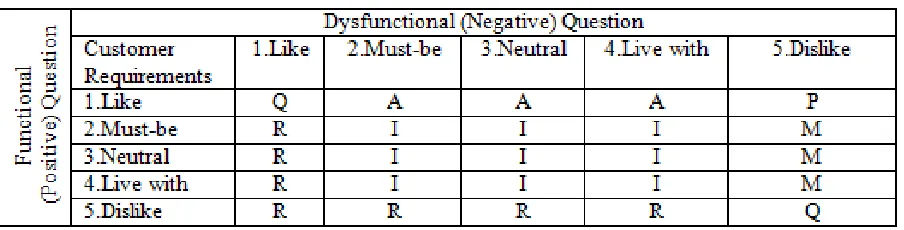
Table 1. An example of question structure in Kano’s theory
Source: Matzler, Hinterhuber, Bailom, & Sauerwein 1996, p. 10.
Kano produced a rigorous methodology for mapping consumer responses. After the information is extracted from the survey, Kano‟s evaluation table is used to tabulate the data; Table 2 provides an example. Kano classification begins with the tabulation of survey responses and distinguishing the attributes into different categories (M, P, A, I, Q, or R) based on the largest number of inputs. For example, if the highest number of responses for „fitting room‟ is the must-be category, „fitting room‟ is labeled as a must-be (M) attribute. Likewise, the various product attributes are classified into different categories.
Table 2. Kano evaluation table
Source: Matzler, Hinterhuber, Bailom, and Sauerwein 1996, p. 10.
Note: M = must-be attribute; P = performance attribute; A = attractive attribute; I = indifferent attribute; R = reverse attribute; Q = questionable attribute.
Classifying and differentiating product attributes by means of the Kano method provides the following advantages (Matzler & Hinterhuber, 1998).
Kano‟s classification aids in understanding the important attributes that influence customer satisfaction. Classifying the attributes into must-be, performance, and attractive categories can be used to focus on priorities for attribute implementation.
Knowing the classification of particular attributes provides valuable help in trade-off situations in the attribute implementation stage. If two attributes cannot be incorporated simultaneously due to technical or financial reasons, the attribute that has the greatest influence on satisfaction can be identified and prioritized.
Determining and satisfying attractive attribute requirements of consumers enables to differentiate the products and/or services over competitors.
Further, Kano‟s theory was employed in identifying important product attributes that enhance customer satisfaction across product categories, such as television sets (Kano, 2001), e-services (Witell & Fudin, 2005), retail store price perceptions (Zielke, 2008), industrial product designs (Tontini, 2007), and employee compensation satisfaction (Matzler, Fuchs, & Schubert, 2004). While Kano‟s theory aids in prioritizing important attributes, these attributes can be used as inputs for the Quality Function Deployment (QFD) process for successful implementation of quality attributes.
Quality Function Deployment (QFD) process
The QFD concept originated in Japan in the 1970s as a concept for new product development under the umbrella of total quality control. In the 1980s, it became increasingly popular in the Western world in the automotive industry as an important way for improving design quality. It has been successfully applied in many Japanese organizations to improve manufacturing processes and to build competitive advantages (Hauser & Clausing, 1988). The founder of QFD, Akao (1972, p. 8) defines it as “a method for developing a design quality aimed at satisfying the customer and then translating the customer‟s demands into design targets and major quality assurance points to be used throughout the production phase.” Whereas, Terninko‟s (1997, p. 3) incorporated marketing concept into its concept and defined QFD as “a modern quality system aimed at increasing market share by satisfying the customer.” The QFD approach is different from the traditional approach that focused on improving physical quality (Sharma, Rawani, & Barahate, 2008) in the sense that QFD provides a organized way for firms to assure quality as well as customer satisfaction while being able to maintain a competitive advantage. Some advantages of QFD are that it reduces the start-up costs of new product development, shortens design cycles, increases efficiency, and saves time (Bayraktaroglu & Ozgen, 2008). QFD also enhances the number of satisfied customers because the customers‟ needs and desires are met or exceeded by the product/service. In the QFD process, the marketing and manufacturing departments should cooperate closely with the design engineers to ensure implementation of customers‟ requirements in the final product or service.
The QFD process consists of four phases. The first, the design phase, begins with understanding and evaluating customer requirements by various methods, such as focus groups, questionnaires, in-depth interviews, or observation of customers. A structured list of customer requirements, competitive opportunities, and technical abilities to meet the customer requirements are documented in this phase. Next, the requirements are prioritized regarding their importance. Kano‟s model can be used effectively in the QFD process to gather information because the customer requirements can be categorized via Kano‟s analysis model as must-be, performance, and attractive requirements. Further, the QFD process compares the organization‟s products/services with those of the competition through a competitive analysis by asking customers the performance levels of the company‟s products/services and the performance levels of the competitors‟ products/services on each requirement. This provides the opportunity for the organization to see whether it has competitive advantages and, if it does, on which important customer requirements (Bayraktaroglu & Ozgen, 2008). In the second phase, the descriptive phase, customer specifications of the product or service requirements are evaluated.
The QFD team in the firm can discuss the requirements necessary to meet the wants and needs of the customers. The product or service attributes that are important to meet customer needs are then deployed into the process planning phase. In the third phase, the process planning phase, the various processes involved in producing a product or service are assessed and the one that poses the most benefit is selected. The fourth phase, the implementation phase, provides a guide through the product/service development cycle from product design to production to help implement the customer requirements. In this phase, the solutions are implemented that help to satisfy the customer requirements. Finally, all of this information is analyzed in a matrix called house of quality (HOQ), which “links customer needs to the development team‟s technical responses to meet these needs” (Chan & Wu, 2002, p. 25). In all the phases, decisions are based on the highest level of customer satisfaction. Therefore, one of the advantages of the QFD process is that all the business functions involved in the process focus on achieving a common goal, customer satisfaction. The most recognized tool often used in the application of QFD is the HOQ matrix (Hauser & Clausing, 1988). Therefore, this study utilizes HOQ to demonstrate the application of QFD in apparel retail settings.
Implementation of quality store attributes in apparel retail store contexts
Step 1: The first step identifies the customer expectation of important attributes in an apparel retail store. In this step, the information obtained from Kano‟s analysis model can be inputted. The Kano model can be integrated into the QFD process in order to understand customer requirements in more detail and to differentiate the requirements into must-be, performance, and attractive requirements. For example, store attributes such as merchandise, service, clientele, physical facilities, convenience, promotion, and store atmosphere can be categorized into Kano‟s must-be, performance, and attractive attributes.
After classifying the attributes into Kano‟s categories, a retail store can prioritize the attributes based on their goals. That is, all must-be requirements should be fulfilled so that the customers are not dissatisfied. In order to be competitive as a market leader, a retail store should satisfy the performance attributes. A retail store can then focus on attractive attributes if its goal is to differentiate itself from its competitors (Shen, Tan, & Xie, 2000).
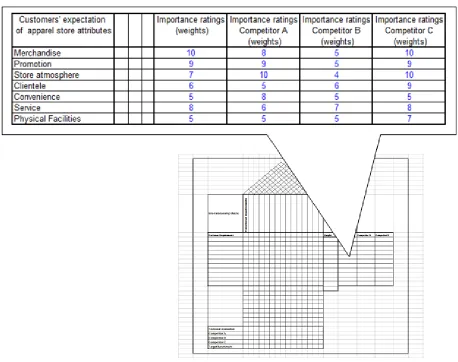
Step 2: Step 2 determines how important the attributes are for the customers. That is, the weight of each attribute is determined by the customer survey results. Additionally, this step classifies how apparel retail store X is perceived compared to its competitors, stores A, B, and C. This is achieved by the customer competitive assessment survey, which measures customer perceptions of product attributes relative to competitors‟ product attributes. The importance is ranked on a scale of 1 to 10 (1 being Worst and 10 being Best).
Figure 1 illustrates Step 2 of the process.
Figure 1. QFD Step 2: Determining the customers‟ importance of each store attribute and their perceptions of these attributes in competitors‟ stores.
Step 3: The critical customer requirements are translated into achievable functional measures or actions in Step 3. For example, implementation of the store attribute quality „merchandise‟ can be achieved by translating the attribute into an action, such as providing quality merchandise, providing deep assortments, providing stylish and fashionable apparel, displaying merchandise in an appealing manner, etc. The identified important store attributes are evaluated by the team of experts. In an apparel retail store setting, the team of experts can consist of designers and visual merchandisers who will decide upon the quality, assortment, and display of merchandise. The team will identify all possible ways to implement the important store attributes, and the experts will identify an approach to implement these attributes that will capture all possible ways to increase customer satisfaction.
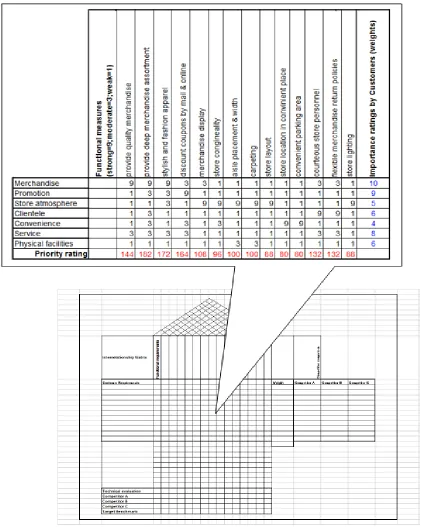
Step 4: The relationship between the achievable functional measures (Step 3) and the customer requirements (Step 1) is assessed in Step 4 (see Figure 2). Based on their experience and strategic view, the group of experts determines whether the relationship between functional measures and customer requirements is strong (9), moderate (3), or weak (1) and assigns values in each cell for each relationship. If the expert group finds a moderate relationship, the members may re-examine the functional measure and try to strengthen the relationship. The final score or priority score is calculated by multiplying the importance rating for each attribute (outputs of Step 1) by a relationship weight value (9, 3, or 1) of the identified achievable functional measures (outputs of Step 3) and adding all the values. The highest final score (priority rating) indicates which functional measure is an important and appropriate strategy (store attribute) to implement to attract customers to the store. For example, in Figure 2, the highest priority rating is 182, followed by 172. The underlying functional measure for these ratings is „provide deep merchandise assortment‟ and „stylish and fashionable merchandise,‟ respectively. The company should therefore seek to achieve these functional measures before other functional measures.
Step 5: The technical and competitive evaluations are done by comparing the apparel store of interest to its most serious competitors. For example, if the study is being conducted on a specialty apparel retail store, then Old Navy, Gap Inc., American Eagle Outfitters, etc. can be compared for competitive evaluations because they represent specialty apparel stores that carry similar merchandise and cater to similar customer age groups. Finally, the technical team provides target values that serve as directions to set a strategy that can match the store of interest to its closest competitor on the most important customer expectation.
Figure 2. QFD Step 4: Assigning values for a relationship between the achievable functional measures and the customer requirements, and then determining the priority rating.
Note: This figure is adopted from Simelton (2007). The attributes and the numbers are hypothetical and suggested by the authors. In reality, the functional measures and the numbers in this figure are inputted by the expert team. correlations. Specifically, „aisle placement and width‟ and „store layout‟ may have a positive correlation. That is, if the aisles are placed at an appropriate width, the store layout will be appealing to customers and the customers will be satisfied.
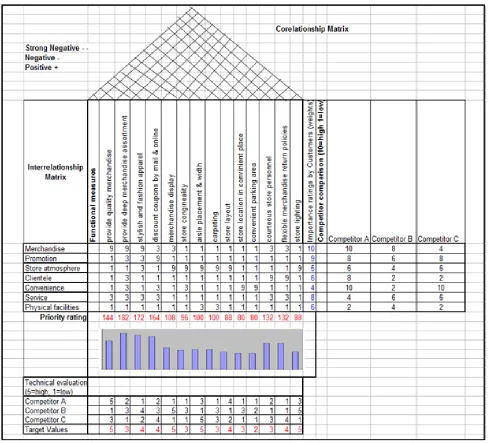
The correlations are indicated by symbols to depict strong negative, negative, and positive relationships between achievable functional measures. This completes the HOQ. The final output of the matrix specifies important attributes to be considered and the best way to implement these attributes, which are linked back to the demands of the customer or customer requirements. Figure 3 depicts the overall HOQ process to implement apparel store attributes. The priority ratings in Figure 3 indicate that the retailers should consider the measures in the order of highest priority ratings. For example, in Figure 3 the highest priority rating is 182 and the underlying functional measure is to provide deep merchandise assortment. This measure should be considered as the most important priority, followed by other measures in order of highest rating, and retailers should formulate appropriate strategies to meet customer expectations for the underlying measures. The competitor comparison column in Figure 3 aids retailers in understanding the customer perception of product attributes in relation to competitors‟ product attributes, which further aids them in competitive benchmarking. The technical evaluation values of competitors allow the retailers to set target values. For example, for providing deep merchandise assortment, competitor B‟s technical value evaluation 3 is the highest among the three competitors. Thus, technical value 3 is set as a target value for the retail store of interest. Likewise, the highest technical evaluation value among the three competitors for each functional measure is set as a target value for the retail store. This helps the retailer formulate appropriate strategies to implement the important attributes that can match or exceed competitors, while also satisfying customer needs.
Note: This figure is adopted from Simelton (2007). The attributes, functional measures, weights, and all the numbers are hypothetical and suggested by the authors.
Discussion and Conclusions
This study demonstrates how Kano‟s model and QFD processes can be utilized for identifying, prioritizing, and implementing apparel store attributes to maximize customer satisfaction. For the successful implementation of store attributes that optimize customer satisfaction, inputs from both the customer and the expert team are critical. Through various methods, such as focus groups, questionnaires, in-depth interviews, and customer observation, customer requirements of store attributes and customer perceptions of competitors‟ store attributes can be gathered. With the data, store attributes can be classified into must-be, performance, and attractive dimensions utilizing Kano‟s theory. This process helps the expert team to understand which attributes are taken for granted by consumers (must-be attributes), which attributes are directly related to customer satisfaction (performance attributes), and which attributes will make the store stand out in the market (attractive attributes), which the expert team can then use to prioritize important store attributes and build strategies to implement the attributes.
This study demonstrated step by step how the QFD process can be applied effectively in the implementation of apparel store attributes to optimize efforts to increase customer satisfaction. In that sense, QFD provides multiple benefits for retailers; it allows the retail organization i) to prioritize the list of attributes customers look for in an apparel store from the inputs of Kano‟s classification of attributes, ii) to prioritize what the company can do to satisfy customer requirements, iii) to discover the store‟s performance against its competitors, iv) to set realistic target values that will almost guarantee customer satisfaction, if met, and v) to assure a better product, process, or service.
Academically, this study fills a void in the research on store attributes. Previous studies focused primarily on identifying store attributes that affect customer satisfaction in a given study setting (Mittal et al., 1998; Tan & Shen, 2000) and were limited in fully examining which attributes influence customer satisfaction the most and how to implement those attributes strategically. This study, however, provides a means to identify and classify retail store attributes in a way that ensures customer satisfaction and also illustrates how to implement these attributes. In addition, although the integrated approach of Kano‟s model and QFD had been studied in a couple of research settings (i.e., innovative product development (Shen et al., 2000) and quality library services (Bayraktaroglu & Ozgen, 2007)), its application to the apparel retail store setting had not previously been attempted. The integrated approach of Kano‟s model and QFD in apparel retail settings helps to identify the different levels of customer requirements for apparel store attributes (Kano‟s model) and details strategic planning to implement these attributes (QFD) accordingly. This approach is innovative as well as practical since it approaches customer satisfaction holistically by taking consumers‟ perceptions of competitors into account and putting customer data and an expert team‟s efforts together. The method suggested in this study advances our understanding of store attributes and the management of store attributes for customer satisfaction.
The practical contribution of this study is that it provides U.S. apparel firm managers with more definitive information on implementing apparel retail store attributes. In particular, the integrated approach enables retailers to differentiate customer expectations of store attributes into must-be, performance, and attractive attributes. This differentiation of attributes serves as an important basis on which retailers can develop realistic strategic planning to implement the important attributes. For example, the attractive attributes, if implemented, will enable a retailer to differentiate itself from competitors, and the must-be attributes will ensure customer satisfaction.
References
Akao,Y. (1972). New product development and quality assurance- quality deployment system. Standardization and Quality Control, 25(4), 7-14.
Badgett, M., Boyce, S. M., Vantine, L., & Hittner, J. (2008). Why advocacy matters to apparel retailers. Retrieved December 30, 2009 from https://www935.ibm.com/services/ us/gbs/bus/pdf/g510- 6649-01_apparel.pdf Bayraktaroglu, G., & Ozgen, O. (2008). Integrating the Kano model, AHP and planning matrix. Library Management,
29(4), 327-351.
Berry, L. L. (1986). Retail businesses are service businesses. Journal of Retailing, 65(1), 3-6.
Birtwistle, G., & Shearer, L. (2001). Consumer perception of five UK fashion retailers. Journal of Fashion Marketing
and Management, 5(1), 9-18.
Chan, L. K., & Wu, M. L. (2002). Quality function deployment: A comprehensive review of its concepts and methods.
Quality Engineering, 15(1), 23-35.
Chowdhary, U. (1999). Retail store attributes, fashion leadership and older consumers. Journal of Fashion Marketing
and Management, 3(2), 126-132.
Davies, G. (1992). Positioning, image and the marketing of multiple retailers. International Review of Retail and
Consumer Research, 2(1), 13-35.
Hauser, J. R., & Clausing, D. (1988). The house of quality. Harvard Business Review, 66(3), 63-73.
Kano, N., Seraku, N., Takahashi, F., & Tsuji, S. (1984). Attractive quality and must-be quality. The Journal of the
Japanese Society for Quality Control,14(2), 39-48.
Kano, N. (2001). Life cycle and creation of attractive quality. Paper presented at the fourth International QMOD Conference on Quality Management and Organizational Development, University of Linkoping, Linkoping. Kuo, Y. F. (2004). Integrating Kano's model into web-community service quality. Total Quality Management and
Business Excellence, 15(7), 925-39.
Leszczyc, P. T., & Timmermans, H. (2001). Experimental choice analysis of shopping strategies. Journal of Retailing, 77(4), 493-509.
Lindquist, J. D. (1974). Meaning of image. Journal of Retailing, 50(4), 29-38.
Matzler, K., & Hinterhuber, H. H. (1998). How to make product development projects more successful by integrating Kano's model of customer satisfaction into quality function deployment. Technovation, 18(1), 25-38.
Matzler, K., Hinterhuber, H. H., Bailom, F., & Sauerwein, E. (1996). How to delight your customers. Journal of Product & Brand Management, 5(2), 6-18.
Matzler, K., Fuchs, M., & Schubert, A. (2004). Employee satisfaction: does Kano's model apply. Total Quality
Management and Business Excellence, 15(9), 1179.
Mitchell, V. W., & Kiral, R.H. (1998). Primary & secondary store loyal customer perceptions of grocery retailers.
British Food Journal, 100 (7), 312-319.
Mittal, V., Ross, W. T., & Baldasare, P. M. (1998). The asymmetric impact of negative and positive attribute-level performance on overall satisfaction and repurchase intentions. Journal of Marketing, 62(1), 33–47.
Sharma, J. R., Rawani, A. M., & Barahate, M. (2008). Quality function deployment: a comprehensive literature review.
International Journal of Data Analysis Techniques and Strategies, 1(1), 78-103.
Shen, X. X., Tan, K. C., & Xie, M. (2000). An integrated approach to innovative product development using Kano‟s model and QFD. European Journal of Innovation Management, 3(2), 91-99.
Simelton, F. M. (2007). Utilizing quality function deployment and kano model to identify the factors affecting minority
retention. Unpublished doctoral dissertation, Southern Illinois University, Carbondale.
Tan, K. C., & Shen, X. X. (2000). Integrating Kano's model in the planning matrix of quality function deployment.
Total Quality Management, 11(8), 1141-1151.
Terninko, J. (1997). Step by Step QFD: Customer Driven Product Development. Boca Raton, FL: CRC Press/St Lucie Press.
Ting, S., & Chen, C. (2002). The asymmetrical and non-linear effects of store quality attributes on customer satisfaction. Total Quality Management, 13(4), 547-69.
Tontini, G. (2007). Integrating the Kano model and QFD for designing new products. Total Quality Management, 18(6), 599-612.
Witell, N. L., & Fundin, A. (2005). Dynamics of service attributes: a test of Kano's theory of attractive quality.
International Journal of Service Industry Management, 16(2), 152-168.
Zielke, S. (2008). Exploring asymmetric effects in the formation of retail price satisfaction. Journal of Retailing and