37 Copyright © 2011-15. Vandana Publications. All Rights Reserved.
Volume-5, Issue-1, February-2015
International Journal of Engineering and Management Research
Page Number: 37-44
A Study on Banking Penetration in Financial Inclusion
“With Special
Reference to Tamilnadu”
Miss Caroline Priyanka Koorse1, Dr. S.Kavitha2
1
Department of Commerce, INDIA
2
Department of Management, INDIA
ABSTRACT
Today the term ‘bottom of the pyramid’ refers to the global poor most of whom live in the developing countries. These large numbers of poor are required to be provided with much needed financial assistance in order to sail them out of their conditions of poverty. Accordingly, there is felt a need for policy support in channeling the financial resources towards the economic upliftment of poor in any developing economy. Financial Inclusion is considered to be the core objective of many developing nations since from last decade as many research findings correlate the direct link between the financial exclusion and the poverty prevailing in developing nations. Financial inclusion is an attempt to provide financial access and services to weaker sections and low income groups, thus eliminating poverty. An inclusive financial sector development makes two complementary contributions to poverty alleviation: financial sector development is a driver of economic growth which indirectly reduces poverty and inequality and appropriate,
affordable, financial services for poor people can improve their welfare. The study conducted is to identify how financial inclusion has had an impact on the state of Tamilnadu and how financial inclusion has helped indirectly in the improvement of financial literacy and reduction of poverty. The study conducted will bring forth the improvement in the state of Tamilnadu after the implementation of financial inclusion in terms of financial literacy, reduction of poverty and how the banking sector alone has managed to engulf a vast part of the state into the fold of financial inclusion.
Keywords--- Bottom of pyramid, financial assistance, poverty, economic upliftment, financial inclusion, financial literacy.
I.
INTRODUCTION
“The stark reality today is that most poor people in the world still lack access to sustainable financial services, whether it is saving, credit or insurance. The great challenge before us is to address the constraints that exclude people from full participation in the financial sector. Together, we can and we must build inclusive financial sectors that help people improve their lives” Former UN secretary –Kofi Annan
Normally the weaker sections of the society are completely ignored by the formal financial institutions in the race of making chunks of profits or the complexities involved in providing finance to the weaker section. Financial inclusion or inclusive financing is the delivery of financial services, at affordable costs, to sections of disadvantaged and low income segments of society.
II.
RESEARCH OBJECTIVES
• To identify the trend of banking penetration in financial inclusion at Tamil Nadu.
• To study the growth rate of financial inclusion in Tamil Nadu.
III.
REVIEW OF LITERATURE
38 Copyright © 2011-15. Vandana Publications. All Rights Reserved. publicity to the facility of “no frills” account. Further
efforts must be made to move from the concept of anytime, anywhere banking, to anywhere and to everyone banking. 2) Usha Thorat (2007) “Financial Inclusion - the Indian Experience, Financial Inclusion Conference, London” reported that banks are entering into agreements with India post for using post offices as agents for branchless banking. Setting up of financial literacy center and credit counselling on a pilot basis, launching a national literacy campaign, forging linkages with informal sources with suitable safeguards through appropriate legislation, evolving industry wide standards for IT solutions, facilitating low cost remittance products are some of the initiatives currently underway for furthering financial inclusion.
3)
4) Atul Raman(2012) in his research paper “Financial Inclusion and Growth of Indian Banking System” has explained the opportunities, scope and challenges for financial inclusion and concluded that Financial inclusion plays a major role in driving away poverty from the country and a day will come when all Indians have their bank accounts and everybody will take part in financial inclusion.
5) Shivani (2013) in her research paper “Financial Inclusion In India” has concluded that in achieving inclusive growth in India, Financial Inclusion will play a vital role and help the nation to drive away not only rural poverty but also urban poverty in India. It is the duty of every Indian citizen to ensure that all the Indians will have a bank account and everybody should take part actively in achieving 100% financial inclusion in India.
IV.
RESEARCH METHODOLOGY
The study conducted is based on descriptive research design, meaning a description of the state of affairs as it exists at present and is restricted to a span of 9 yrs. Secondary data has been used which has been obtained from the agenda papers of the State level Bankers committee Tamilnadu, from the online website of the State level Bankers committee Tamilnadu and from RBI’s website. The banks included in the study are all banks which have reported to the SLBC Tamilnadu which include all of the State bank group, Nationalised banks, Other public sector banks, Private sector banks, RRB’s and Foreign banks. Convenience sampling under non probability sampling has been used in the study meaning
that each item in the sample has been selected deliberately and the elements in the sample are selected based on ease of access. The tools used in the study include ratio analysis, trend and Compound Annual Growth Rate (CAGR).
V.
LIMITATIONS OF THE STUDY
VI.
Every research conducted has its limitations. These limitations are being brought forward such that when any further research is conducted the limitations given below may be taken into consideration.
• The study has been restricted only to the state of Tamilnadu.
• An attempt has been made to conduct a detailed study still there are areas which have not been covered.
• The period of study is restricted to 9 years however the number of years for some of the analysis is subject to the availability of data. • Data taken in the analysis is based on secondary
data taken from the State Level Bankers Committee of Tamilnadu and the limitations of the SLBC are also applicable to the research.
VI.
ANALYSIS AND
INTERPRETATION
In identifying the trend of banking penetration in financial inclusion in Tamilnadu the following parameter have been considered;
• KCC
• BSBDA/NO FRILL • GPCC
• OD IN NO FRILL’S SB A/C • SHG CREDIT LINKAGE • RSETI’S
39 Copyright © 2011-15. Vandana Publications. All Rights Reserved. INTERPRETATION
The number of cards issued on an overall basis by all the 3 banks from the year 2009 to 2013 has been significantly low and commercial banks have issued the most number of cards among the 3
banks. On an overall basis the amount sanctioned has been the highest in the years 2008 to 2011 in all the 3 banks. The commercial banks have been the highest contributors among the 3 banks.
• Basic Savings Bank Deposit Account/No Frill Chart No:1
Number Of Bsbda/No Frill A/C’s Opened Account Opened In No’s In ‘000
INTERPRETATION
On an overall basis there has been an increasing trend in the number of accounts opened from the year 2009 to 2013. The trend for individual banks opening
BSBDA/No frill A/c’s over the years 2009 to 2013 has been fluctuating for example for the years 2009 to 2012 Indian bank has opened the most number of account, but in the year 2013 IOB has opened the most number of accounts. In the same way Canara bank had an increasing trend for the years 2009,2010,2011 but in the year 2012 there was a drop in the number of accounts opened in 2013 again the number of accounts opened has increased.
40 Copyright © 2011-15. Vandana Publications. All Rights Reserved. INTERPRETATION
There has been a rising trend in overdraft granted in no frill’s sb a/c. In the year 2010 least number of accounts have been granted overdraft facility (26,079) and in 2013 the highest number of accounts have been granted overdraft facility (82,229).
• General Purpose Credit Card
Chart No : 3 Number Of Gpcc Issued Account opened in no’s in ‘000
INTERPRETATION
On an overall basis the trend of the GPCC issued has been fluctuating. In 2009 the total number of GPCC issued by all the banks totaled 25,040. In 2010 the number of GPCC issued by all the banks increased to 47,282. In 2011 a significant increase can be seen the number being 99,410. In 2012 there is a drop in the number of GPCC issued 91,989. In 2013 there is an increase to 93,897. The highest number of cards have been issued in the year 2011.
• Financial Literacy And Credit Counselling Centers Table No:2
Flccc Progress Report As On March 2013
INTERPRETATION
IOB has opened the highest number of FLCCC (13) followed by Indian bank with (10). ICICI Bank Ltd and Bank Of India have opened only one FLCCC each.
• SHG Credit Linkage
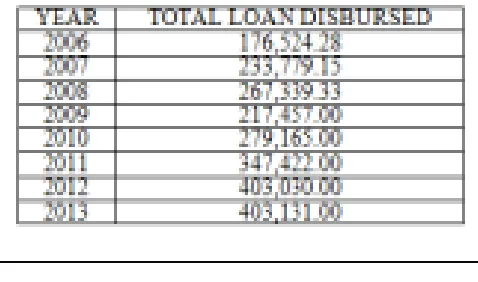
Table No:3 SHG –Progress On Credit Linkage Consolidated Position (Year Wise) (Rs In Lacs)
SL NO
NAME OF THE
BANK NO OF FLCCC 1 Indian overseas bank 13 2 Indian bank 10 3 Canara bank 7 4 State bank Of india 2 5 Bank Of india 1 6 ICICI Bank Ltd 1
41 Copyright © 2011-15. Vandana Publications. All Rights Reserved. INTERPRETATION
Credit linkage over the years has been fluctuating from 2006 to 2013.In the year 2006 the loan disbursed stood at 176,524.28 in the year 2007 and 2008 there has been an increase. In the year 2009 the loan disbursed has
dropped to 2, 17,457 after which there has been a constant increase till 2013.
•
Rural Self Employment Training Institute’s
Table No: 4
RSETI’s Opened As On 31-3-2013
22 Thoothakudi/Tuticorin Yes SBI Yes
23 Thirucirapali Yes IOB Yes
24 Thirunelvi Yes IOB Yes
25 Thirupur Yes CNB Yes
26 Thiruvallur Yes INB Yes
27 Thiruvannamalai Yes INB Yes
28 Thiruvarur Yes IOB Yes
29 Vellore Yes INB Yes 50.00
30 Viluppuram Yes INB Yes
31 Virudhunagar Yes IOB Yes
SL
NO DISTRICTS
SLBC APPROVED
NAME OF THE BANK
RSETI's
ESTABLISHED BY THE BANKS
RSETI's
RECEIVED MORD GRANT
1 Ariyalur Yes SBI Yes
2 Coimbatore Yes CNB Yes 17.50
3 Cuddalore Yes INB Yes
4 Dharmapuri Yes INB Yes
5 Dindigul Yes CNB Yes 10.00
6 Erode Yes CNB Yes 10.00
7 Kanchipuram Yes INB Yes
8 Kanyakumari Yes IOB Yes
9 Karur Yes IOB Yes
10 Krishnagiri Yes INB Yes
11 Madurai Yes RUD Yes
12 Nagapattinam Yes IOB Yes
13 Namakkal Yes INB Yes
14 Perambalur Yes IOB Yes
15 Pudukkottai Yes IOB Yes
16 Ramanathapuram Yes IOB Yes
17 Salem Yes INB Yes 10.00
Sivagangai Yes CNB Yes 100.00
18 Sivagangai-Karaikudi NABARD,IOB &INB Yes
19 Thanjavur Yes IOB Yes
20 Nilgiris Yes CNB Yes 10.00
42 Copyright © 2011-15. Vandana Publications. All Rights Reserved. INTERPRETATION
RSET’s have been opened in 31 districts in Tamilnadu. IOB has opened the most number of RSETI’s followed by INB and CNB respectively. There is only one RSETI which has not been approved by the SLBC in the district of Karaikudi( Sivagangai), this institute was functioning before the RSETI scheme, this is also the only district were the NABARD,IOB and INB have together
contributed to its opening. MORD grant’s were received by 7 districts, with the highest grant going to the Sivagangai followed by Vellore.
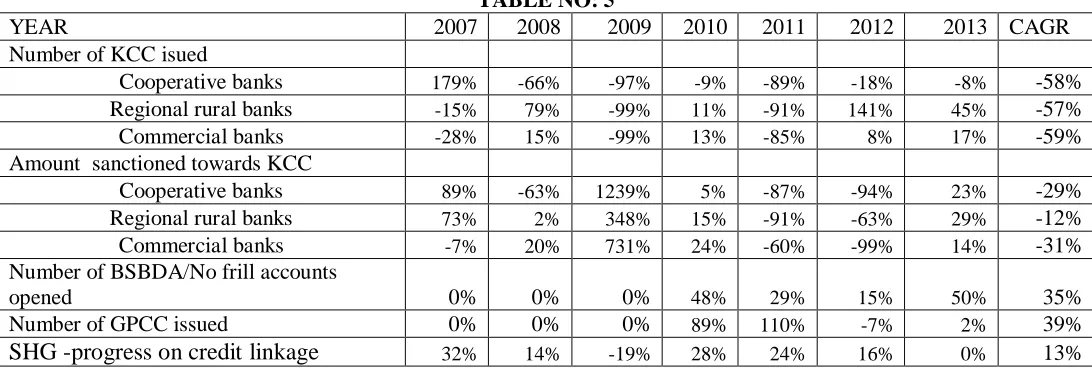
COMPOUND ANNUAL GROWTH RATE TABLE NO: 5
YEAR 2007 2008 2009 2010 2011 2012 2013 CAGR
Number of KCC isued
Cooperative banks 179% -66% -97% -9% -89% -18% -8% -58%
Regional rural banks -15% 79% -99% 11% -91% 141% 45% -57%
Commercial banks -28% 15% -99% 13% -85% 8% 17% -59%
Amount sanctioned towards KCC
Cooperative banks 89% -63% 1239% 5% -87% -94% 23% -29%
Regional rural banks 73% 2% 348% 15% -91% -63% 29% -12%
Commercial banks -7% 20% 731% 24% -60% -99% 14% -31%
Number of BSBDA/No frill accounts
opened 0% 0% 0% 48% 29% 15% 50% 35%
Number of GPCC issued 0% 0% 0% 89% 110% -7% 2% 39%
SHG -progress on credit linkage
32% 14% -19% 28% 24% 16% 0% 13%INTERPRETATION
The CAGR of the number of KCC issued in co operative banks over the years 2006 to 2013 is -58% i.e. the average annual growth over the years is a negative figure meaning that the number of KCC cards issued has reduced over the years. The CAGR of the number of cards issued in regional rural banks over the years 2006 to 2013 is -57% i.e. the average annual growth over the years is a negative figure however the growth over the years has been fluctuating. The average annual growth over the years 2006 to 2013 is -59% meaning that there is negative CAGR for the number of cards issued in the commercial banks. The average annual growth of the amount issued towards KCC over the last 8 yrs from 2006 to 2013 shows that there is a negative CARG of – 29%. Over the years there has been a fluctuating growth. The CAGR of the amount sanctioned towards KCC in regional rural banks over the years 2006 to 2013 is -12% i.e. the average annual growth over the years is a negative figure however the growth over the years has been fluctuating. The average annual growth over the years 2006 to 2013 is -31% meaning that there is negative CAGR for the amount sanctioned towards the KCC cards in the commercial banks. The growth over the years has been fluctuating. The
average annual growth rate or CAGR for the number of BSBDA/No frill accounts opened over the past 5 years is 35% from 2009 to 2013. The growth rate over the period has been fluctuating. The CAGR for the number of GPCC issued over the years 2009 to 2013 stands at 39% i.e. the average growth over the past 5 years is 39% and the growth rate has been fluctuating. In the year 2010 the growth rate stood at 89% followed by a increased growth rate to 110 % in 2011 in 2012 there is a negative growth percentage of -7% and in 2013 the growth percentage stands at 2%.The CARG for the SHG credit linkage over the years 2006 to 2013 is 13% i.e. the average annual growth is 13% and the growth rate has been fluctuating over the years. In the year 2007 the growth percentage stood at 32% followed by a decrease in the growth to 14%. The growth of the SHG credit linkage in the year 2009 showed a negative growth of -19% followed by an increase in the year 2010 to 28%. The year 2011 shows a positive growth 24% but is has decreased compared to the previous year. The year 2013 has a 0% growth meaning that there has been no growth as compared to the previous year.
43 Copyright © 2011-15. Vandana Publications. All Rights Reserved.
•
The numbers of cards issued in all three banks (co operative, regional rural and commercial banks) have shown a downward trend. This however is good as the number of people who are yet to receive the cards has reduced and a vast population has already received the KCC cards. Again the amount sanctioned towards KCC has shown a fluctuating trend but the amount sanctioned has been reducing over the years. The CAGR of the KCC issued and amount sanctioned towards KCC in all the banks also shows a negative figure which however indicate that there has been reduction in the cards issued and a vast population has been covered.
KCC
• BSBDA/NO FRILL ACCOUNTS
The number of BSBDA/no frill accounts opened over the years have shown an increasing trend showing that the number of people who have opened accounts over the years has increased. The CAGR has been fluctuating but the growth has been positive showing that there has been at least one fourth of the population on an average basis to open accounts.
• OVERDRAFT IN NO FRILL SB ACCOUNTS
The number of accounts that have opened with the overdraft in no frill or SB accounts also has shown an increasing trend meaning that the number of persons who have availed overdraft facility has increased over the years. • GENERAL PURPOSE CREDIT CARDS
The number of GPCC cards issued over the years has had an increasing trend showing that the GPCC has been issued to a number of customers at an increasing rate. The CAGR also is a positive percentage meaning that the average annual growth rate over the years is positive and there has been a growth in the number of cards issued. • FLCCC AND RSETI’S
One of the main steps towards financial literary taken were the FLCCC’s and the RSET’s. From the data given we can conclude that there have been a number of FLCCC’s opened during the years and RSET’s are opened in all the districts in Tamilnadu and an overall improvement in the trend in the banking penetration is proof to that.
• SHG CREDIT LINKAGE
The total loans disbursed under the SHG credit linkage scheme has shown a positive trend and the CAGR or the average annual growth has also shown positive showing that the loan availed over the years has been increasing.
VII.
RECCOMENDATIONS
• Steps are to be taken to cover the financially excluded people in Tamilnadu using the parameters like KCC, no frill accounts, GPCC, FLCCC and RSETI’s etc’s
• Constant and rising growth in the key parameters in financial inclusion is very much needed and the Government needs to concentrate on all the key parameters • One of the best measures that would be suggested is to
keep the general public educated on the current financial changes and sources that could be used.
VIII.
SCOPE FOR FURTHER STUDY
Research means nothing but to re-search, it is not something that ends; there is always scope for further research. An honest attempt has been made to analyze FI in the state of Tamilnadu. FI is a vast topic that can be studied in length leaving wide scope for further research. Some of the areas that can be studied include
Financial inclusion in other states. Financial inclusion as a whole for India
Technology in financial inclusion is a new concept and has a wide scope for analysis in the years to come.
IX.
CONCLUSION
“If the misery of the poor be caused not by the laws of nature, but by our institutions, great is our sin.” - Charles Darwin
The Government of India and the Reserve Bank of India have been making efforts to promote financial inclusion as one of the important national objectives of the country. Tamilnadu is one state where immense efforts are being taken to finally educate the people and reduce exclusion.
The study conducted concentrated on FI in Tamilnadu, it can thus be concluded that banks have managed to penetrate a vast section of the state and this is evident from the data analyzed over the past 8 years. Banking is a key source that contributes to FI. A good banking performance would indicate that financial inclusion is being achieved. Thus the performance of banks would directly relate to FI Concluding my study I would say that FI in the state of Tamilnadu and India as a whole is a dream which can be fulfilled by constant and earnest efforts of the Government,Banks and people at large. If the Government is able to concentrate on the people and areas which are excluded it would help to increase FI and thus reduce financial illetary and poverty preventing a vicious cycle and help India evolve as a developed country than a developing country. I thus conclude saying
“The test of our progress is not whether we add more to the abundance of those who have much; it is whether we provide enough for those who have too little.” - Franklin D. Roosevelt.
44 Copyright © 2011-15. Vandana Publications. All Rights Reserved. BOOKS
[1] IOB convenor “State Level Bankers Committee, Tamilnadu- Agenda papers”, 2005 to 2013
[2] S.Teki and R.K.Mishra “Microfinance and Financial Inclusion”, Academic foundations,2012
[3] M.Y Khan and P.K.Jain “Financial Management”,McGraw Hill (India)Private Ltd, 2013
[4] S.Shajahan “Research Methods For Management”, Jaico publishing house,2010.
JOURNALS AND ARTICLES
[5] Shunko Rojas.,(2012) ,“Financial Inclusion: Financial Services for the Unbanked” research memorandum ,IGLP-Visa Research Mission and Workshop Bangkok, Thailand determinants: evidence from India”,
[7] World bank.,(2014), “Financial Inclusion”, Global financial development report, ISBN (paper): 978-0-8213-9985-9,ISBN (electronic): 978-0-8213-9990.
[8] Anita Gardeva and Elisabeth Rhyne .,(2011), “Opportunities And Obstacles To Financial Inclusion”, Center for Financial Inclusion at ACCION international , Publication 12.
[9]
Promoting Financial Inclusion Through Financial Education”
[10] Sendhilvelan, M., and Karthikeyan, K., (2006) ,“No FrillsAccount: A Basic Drive for Financial Inclusion”, SouthernEconomist, Vol. 45, PP.13 – 14.
[11] Usha Thorat., (2007) “Financial Inclusion - the Indian Experience, Financial Inclusion Conference”.
[12] Karthikeyan Kothandaraman., (2011) “Financial Inclusion In India”SSRN
[13] Shivani., (2013) “Financial Inclusion In India”, IJRFM (ISSN 2231-5985) Volume 3, Issue 7.
[14] Atul Raman.,(2012) “Financial Inclusion and Growth of Indian Banking System”OSR Journal of Business and Management (IOSRJBM) ISSN: 2278-487X Volume 1, Issue 3 , PP 25-29.