©
http://ijeas.truescholar.org
159
COULD VISUAL INTERFACE DESIGN AFFECT THE STUDENTS’ EMOTION IN
WEB-BASED LEARNING APPLICATION?
1
Zuriana Abu Bakar and
2PhillipD. Long
1Software Technology Research Group (Softtech),
School of Informatics and Applied Mathematics, University Malaysia Terengganu,
21030 Kuala Terengganu, Terengganu, Malaysia.
2
Centre of Teaching and Learning, College of Education,
University of Texas at Austin, USA.
Corresponding Author: Zuriana Abu Bakar
__________________________________________________________________________________________
ABSTRACT
Nowadays, Human Computer Interaction has broadened its focus from concentrating on usability to the issues around user experience and emotional reaction is a part of the UX. Currently, Web-based learning becomes an essential educational medium to transfer information and knowledge. However, asynchronous Web-based learning environments lack of face-to-face interaction. This scenario leads to the lack of emotional interaction in which students may feel bored, unmotivated, and might have emotional resistance toward learning. However, there is still a lack of inclusive and empirically validated theories about emotion in Web-based learning. Simultaneously, user interface design is crucial in Web-based learning since the interaction between students and learning applications occurs via interfaces. Unfortunately, little attention has been paid to design issues, which are critical factors to the success of Web-based learning. Taken together, to address these issues, the present study attempts to examine how the visual design of interface could influence students‟ learning experiences, particularly emotions in the Web-based learning environment. The significance of this study is that it contributes to the advancement of HCI particularly in user interface and Web design, Web-based learning, and UX research, particularly in emotions. In the Web design perspective, the findings of the present study could provide designers with practical evidence-based user interface guidelines, particularly the association between visual interface design and emotions. This study took a quantitative research approach that involved experiments and the Self-Assessment Manikin affective pictures to collect the data. This study found that the manipulation of visual design elements could stimulate and change students‟ affective states during the learning activities.
© Ideal True Scholar
KEYWORDS:Human-Computer Interaction, User Experience, Emotions, Visual Interface Design;
Web-Based Learning
__________________________________________________________________________________
INTRODUCTION
A great deal of research has been undertaken to investigate the visual appeal of Web interfaces, but how the visual design of interfaces could influence students‟ learning experience is one question that has not widely addressed in the empirical research. The existing studies are more focused on theoretical expositions and observations which are mostly anecdotal; thus, there is a need for more investigations of an experimental nature. Moreover, there is still an insufficient amount of research examining what will happen when visual appearances of interface are changing, yet that is what users do all the time when they are using the computer system. Additionally, many of the works that have been done in the area of Web design in general, and Web style presentation in particular, are more focused on technical issues such as how Cascading Style Sheets can be utilized to separate the content and presentation (Andrew & Shafer, 2006; Kerer&Kirda, 2001; Korpela, 1998; Quint, Vatton, &Inria, 2007;
Stone et al., 2005) rather than emphasize the issues relating to the visual appearance and design. Therefore, in response to these issues, the present study intends to fill the gap by investigating the impact of manipulating visual design of interface on students‟ learning experience particularly in terms of emotion.
160
emotions are crucial in the learning domain as emotions can influence decision-making.
WhyWeb-based learning? The Web-based learning environment lacks of human contact and emotional interaction, which greatly impacts on learning(Lin, Pan, Wang, Lv, & Sun, 2010). However, the influence of emotions on learning is still under-emphasized. As Picard et al. (2004) stated, most research on emotions has not been related to learning. Several strategies have been applied to solve the emotional deficiency in e-learning, such as designing the emotional network curriculum, implementing explorative and cooperative learning, implementing blended learning and improving learning support service systems (Aiqin&Luo, 2006). However, these strategies still cannot comprehensively cope with the emotional deficiency in the e-learning environment. Thus, with regard to these deficiencies, this study aims to find out to the extent to which the visual design of interface could influence students‟ emotions in Web-based learning interactions.
Taken together, the main aim of this study was to investigate whether the visual design elements influenced students‟ emotions particularly in terms of valence and arousal. The major research questions of this study is does a change in visual design elements on the Web page could affect students‟ emotional valence and arousal? The research hypotheses that formulated from the research questions is the changes design elements of interfaces may affect students‟ emotional state in terms of valence and arousal for Web-based learning application.
The following section discusses the research background. Then, the previous related works are
discussed, followed by an explanation of
methodology adopted for this research. Afterwards, the results and discussion are discussed. Finally, concluded with a conclusion.
RESEARCH BACKGROUND
In order to get a better understanding about the research domain, this section describes in detail about the emotions such as definitions, models and measurements of emotions. The visual design components including visual design principles and elements are also explained.
Definitions of Emotions
There is an extensive definition of emotion in previous studies. This study will use the definition suggested by Zimmermann, Guttormsen, Danuser and Gomez (2003, p. 2), in which they defined emotion as the properties of a reaction which often have a specific cause, a stimulus or preceding thought, experienced in the short-term (seconds to minutes), and the person is typically well aware of it. Affect is the most general attribute and used to refer
to both emotions and moods (Forgas, 1995). Therefore, in this study, the terms affect and emotion will be used interchangeably and long-term feelings such as mood are not considered in this study.
Model of Emotion
Emotional models can be divided into two different categories which are discrete and dimensional emotions. The discrete emotion model is known as the basic emotion model. The idea of the discrete emotion is that all emotions can be derived from a limited number of universal and innate basic emotions, such as fear, anger, disgust, sadness and happiness (Ekman, 1992). One of the most popular theories of discrete emotions was introduced by Ekman, Friesen and Ellsworth (1972) who proposed a model consisting of six basic emotions, namely, fear, surprise, disgust, anger, happiness and sadness. Plutchik (2001) added another two basic emotions to the model suggested by Ekman et al. (1972), namely, acceptance and anticipation. Thus, with these two new components, the basic emotions expanded from six to eight basic emotions.
On the other hand, the dimensional emotion theory assumes that emotions and emotional experiences can be organized on a number of dimensions (Partala, 2005). The dimensional emotion model perspective aims to avoid some problems inherent in the discrete emotions model. The dimensional emotion model suggests that all affective states arise from two independent neurophysiological systems; one state is
related to valence (a pleasure-displeasure
continuum), and the other state is related to arousal (activation-deviation) (Eerola&Vuoskoski, 2011, p. 20). Russell (1980) proposed two dimensions in the “circumplex model of affect” as shown in Figure 1. Based on this model, emotions are referred to as combinations of valence and arousal (Russell, 1980).
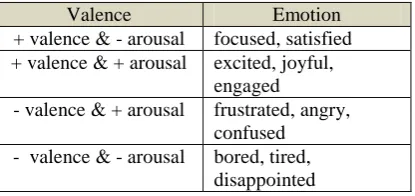
According to Bradley (2000), the valence dimension ranges from positive to negative affective valence (or from pleasant to unpleasant), whereas the middle of
the dimension represents a neutral affect.
Alternatively, the arousal dimension ranges from calm to highly aroused and reflects the intensity of the affective valence (Bradley, 2000). Table 1 presents the correlations between valence, arousal and emotion. In this study, dimensional emotions were chosen instead of discrete emotions because the
dimensional emotions framework has some
161
format is often used, which oversimplifies the subject experiences (Partala, 2005). On the contrary, by using a dimensional approach, a more unambiguous estimate of the subjects‟ subjective feelings can be obtained as a point in the space constituted by the affective dimensions (Partala, 2005).
Arousal
Valence High Arousal
Sleepy
Pleasure Displeasure
confusion
frustration
interest
engagement
boredom
disappointment
satisfaction
hopefulness
Figure 1: Circumplex model of affect (Russell, 1980)
Table 1: Relationships between valence, arousal and emotion
Valence Emotion
+ valence & - arousal focused, satisfied + valence & + arousal excited, joyful,
engaged
- valence & + arousal frustrated, angry, confused - valence & - arousal bored, tired,
disappointed
Measurements of Emotion
Humans express their emotions in many ways including through faces and voices, or through actions such as mouse clicking and keyboard-stroke patterns (Tsihrintzis, Virvou, Alepis, &Stathopoulou, 2008). Therefore, various methods are required to measure the human affects aroused in diverse ways in the context of human-computer interaction. A study by Zimmermann, Guttormsen, Danuser and Gomez (2003) generally grouped the measurements of emotions into three areas as follows:
i. Physiological approaches including skin
conductance, heart responses, blood pressure, pupillary dilation, electroencephalography, brain waves and muscle movements.
ii. Behavioral approaches including facial
expressions, voice modulation, gestures, postures and motor behavior (such as hand muscles, head movement), keyboard and mouse usage.
iii.Psychological approaches including self-reports (verbal descriptions of an emotion or emotional state, rating scales, standardized checklists,
questionnaires, semantic and graphical
differentials or projective methods).
The major advantage of physiological approach is that its non-verbal measurements are language independent, so it can be used in different cultures
(Desmet, 2003). A second advantage is that data is obtained simultaneously (in real time) with the task being performed (Zimmermann et al, 2003). A third advantage of this approach is that the measurements are unobtrusive because they do not disturb participants during the measurement (Desmet, 2003). Unfortunately, physiological methods have some disadvantages as well. They are expensive, complex to apply and involve people being attached directly to cables and electrodes, and this situation is compounded by the laboratory setting which may cause arousal or different emotions in people and therefore alter the results (Ganglbauer, Schrammel, Deutsch, &Tscheligi, 2009).
Facial expressions and voice intonations are the most common measurement methods in the behavioral approach (Cowie et al., (2001). However, these methods are tested almost exclusively on “produced” affect expressions, for example from actors, rather than on actual emotions (Zimmermann et al., 2003). It can be expected that recognition accuracy would drop heavily in natural situations. Moreover, participants consider recording devices such as video cameras to be obtrusive. People will usually act differently when they realize that they are being monitored; consequently, the emotions produced are not the real emotions.Keyboard and mouse usage methodsareone of the behavioral approach. They
arean unobtrusive, non-invasive measurement
method which is able to assess user affect in parallel with task processing, inexpensive as it only uses standard computer input devices and no additional tools, such as a sensor or Web camera, are needed to capture the participants‟ emotions. However, this approach has some drawbacks when used alone. For example, transaction logs, mouse clicks, and the numbers of steps in the navigation process may account for what users are doing, but not what they are thinking or feeling.
Self-reports are widely used and still serve as the primary method for determining emotions. The most often used self-report instruments require respondents to report their emotions with the use of a set of rating scales or verbal protocols (Desmet, 2003). The advantages of this approach are that it involves relatively small expense and does not require expert skills to use the instruments (Sorensen, 2008). However, verbal instruments are difficult to apply across cultures (Desmet, 2003),andresearch indicates that the emotions which are elicited from products are difficult to verbalize (Reijneveld, Looze, Krause, &Desmet, 2003). To overcome this problem, a handful of non-verbal self-report instruments have been developed which use pictograms instead of words to describe emotional responses.
162
the available non-verbal self-report instruments. The SAM method is based on a series of pictures of the puppets (graphical manikins) which are used for measuring dimensional emotions. The subjects need to select the picture matching the emotional response by ticking the corresponding picture on each emotion. Bargas-Avila and Hornbaek (2011) in their study of UX found that the most frequent tool for measuring emotions is the SAM scale. The advantages of the SAM scale are that it is well validated (Bargas-Avila &Hornbaek, 2011), it is a non-verbal method that assesses people‟s affective experience in a quick manner (Bradley & Lang, 1994) and it is applicable in between-culture studies (Desmet, 2003). Thus, due to the limitations of physiological and behavioralapproaches, this study has considered psychological approach, specifically the SAM method for measuring dimensional emotions.
Visual Design
Visual design is a field that is responsible for providing the graphic treatment of the interface in order to achieve the “look” and “feel” of interfaces (Garrett, 2003). Visual design is the surface layer either in the software side or hypertext side. In general, visual design is interested in arranging information items (for example, text images, diagrams, pictures, tables) in such a way that the items are visually attractive, perceptive and easily understandable (Vanderdonckt, 2003, p. 187) . In a major study, Garrett (2003) stated that the visual design referred to the balance, emotional appeal, or aesthetic of the Web interfaces. Visual design issues are raised in many domains of human activity such as user interface design, documentation development,
presentation design, and graphic layout
(Vanderdonckt, 2003). The basic components of visual design can be grouped into two main categories, which are the principles and the design elements.
Visual Design Principles
The principles of design are the laws of designing anything (Gatto, Porter, &Selleck, 1978). They represent the basic assumptions that guide the design practice, and affect the arrangement of layout objects within a composition (McClurg-Genevese, 2005). They have been applied in various mediums including canvas, film, paper, and on the Web (Levy &Yupangco, 2008; Vanderdonckt, 2003). On the Web, a well-built design principle formulates an effective layout which reinforces a site‟s content organization and lets users know what content items are related, consequently making navigation easier. There are many principles that apply to design, but the principles most commonly used in Web design which are consistency, simplicity, alignment, balance, contract, proximity, proportion and unity.
Visual Design Elements
Visual design elements (or simply referred to as “design elements”) make up every interface application that is built. The harmonized combination of visual design elements makes interfaces look effective and attractive. There are numerous design elements involved in creating an interface design, including points, lines, form (shape), texture, space, color, typography, pattern and movement (McClurg-Genevese, 2005; Pearce, 2010). The present study focused on typography and color elements.
In this study, typography was selected as one of the elements to build up an interface because most websites are heavily text-based (Ling &Shaik, 2006). Text supports unspoken or voiceless communication (Beaird, 2007). In addition, 95% of what is commonly referred to as Web design is typography (Reichenstein, 2006). Furthermore, prior empirical researches in typographic elements have mostly focused on the traditional factors such as the readability and legibility of document formation and presentation, and electronic educational materials (Ramadan, 2011; Shaikh, Chaparro, & Fox, 2006). However, in the last few years the concept of typography has been changed due to the widespread use of computers and the Internet in which more emphasis has been placed on the visual appearance of the documents to convey ideas, messages and emotions or to enhance content (Tsonos & Kouroupetroglou, 2008, 2011). In particular, with respect to emotions, Tseng and Ma (2010) pointed out that typography could stimulate human emotions as different fonts can bring different emotional reactions.
With regard to color, this element has one of the strongest influences over the appearance of a Web interface and it can enhance the aesthetic of a webpage (Hall & Hanna, 2004; Stocks, 2009). The most interesting aspect is that color can evoke feelings; subsequently, there is a specific field of study devoted to analyzing the emotional and behavioral effects of colors or color combinations, which is known as color psychology (Beaird, 2007). Hence, due to these reasons, this study concentrated on two design elements in creating the appearance of the interfaces and then related these elements with emotion. Color was applied to the text and background of the pages and the typography elements considered included the font type, font size and line height (vertical spacing). The values of typography and color elements used in this study are discussed further in the sub-section Materials.
RELATED WORKS IN VISUAL DESIGN AND EMOTIONS
163
sophistication (Kim & Moon, 1997).Norman (2002, 2004) stated that there is a need to consider aesthetics and emotions in design since emotion could be influenced by aesthetics whereby aesthetics could make users think creatively and feel comfortable in using the system.
The style of an interface, in terms of shapes, fonts, colors and graphical elements that are used and the way they are combined, influences how pleasurable it is to interact with. As Hall and Hanna (2004) highlighted, design factors such as aesthetically pleasing color combinations can play an important role in generating positive feelings. A few studies have been undertaken concerning the association between interface design factors or elements and users‟ emotions.
Firstly, Kim, Lee and Choi (2003) in their study of
designing emotions for homepages identified
quantitative relationships between design factors of various homepages and generic secondary emotional dimensions. The secondary emotions were derived from the primary emotions (for example the emotions proposed by Ekman (1992) such as fear, surprise, disgust, anger, happiness and sadness). The thirteen secondary emotions applied in that study included bright, tense, strong, static, deluxe, popular, adorable, colorful, simple, classical, futuristic, mystic and hopeful. The design factors consisted of shape, texture and color. The study found that several design factors were closely related to the evocation of certain emotions or aesthetic responses when people interacted with the homepages.
Next, Tsonos and Kouroupetroglou(2008) carried out an experiment to investigate how text typography such as font types (for instance, Times New Roman), font size, font style (for instance, italics and bold) and font color affected the readers‟ emotional states in interacting with electronics. They also included background color in the experiment. They tested fifty-four combinations of font and typesetting elements in order to identify readers‟ emotional responses. They discovered that the readers were mostly influenced by the font/background color combinations and font size, rather than by the typesetting elements and font type.
This limited literature review indicates that design elements such as color and typography could influence users‟ emotional states. However, it is insufficient and more research is needed to find out the extent to which the visual design of interface will impact on users‟ emotions. Based on these deficiencies, this study aims to further explore whether the visual design elements could stimulate students‟ emotional reactions in the Web-based learning environment.
RESEARCH METHODOLOGY
An experimental approach has been adopted in order to trigger participants‟ emotion by displaying the visual design interfaces presented in the Web-based display format. Then, SAM test was conducted to gain information about participants‟ emotion when stimulated by the visual design interfaces. In the following sub-sections, the participants involved in the study, the measures, the materials used, the pilot study and procedure are explained.
Participants, Measures and Pilot Study
This study involved 40 university students as the test subjects. The sample consisted of28 females and 12 males.
The SAMrating of affective pictures was used in the present study to measure two dimensional emotional states of the students, namely, valence and arousal.SAM is available in the paper-pencil format and computerized format, but the fundamental features are essentially the same in both formats. This study used the computerized version and had nine icons that defined a nine-point scale for each dimension. It ranged from “1 = sad” to “9 = happy” for valence, “1 = low arousal (relaxed)” to “9 = high arousal (excited)” for arousal. Figure 2 (second picture) illustrates the version of the SAM used in the present study with the nine icons that defined a nine-point scale for each dimension.
A pilot study was carried out prior to the real experiment to check if there were any deficiencies in the tasks and system prototype, namely the Visual Design Interface System (VDIS).In addition, the pilot study also involved pre-testing the SAM emotion pictures. Two undergraduate students and two postgraduate students were invited to perform the pre-testing task for the entire instruments. In general, positive responses were gathered for the tasks, SAM emotional picture scale and the VDIS. The pilot study data was used to receive feedback on the instrument and was excluded from further analysis.
Materials
164
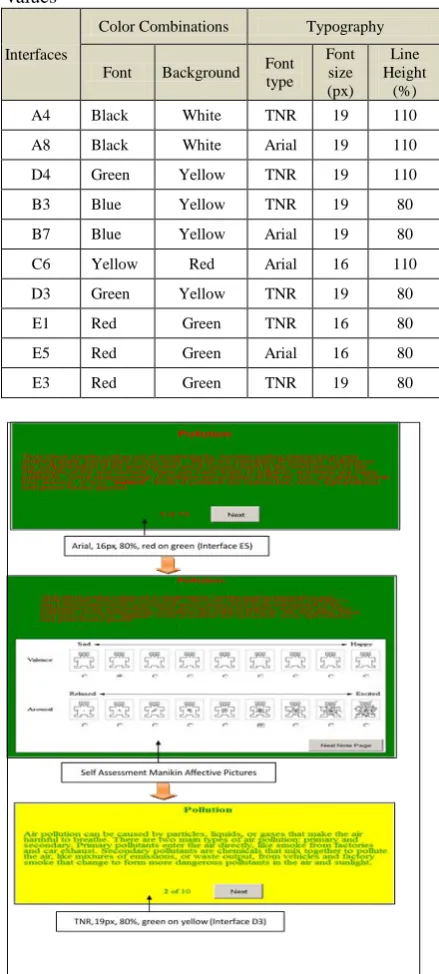
Table 2: Dynamic interfaces design elements and values
Interfaces
Color Combinations Typography
Font Background Font type
Font size (px)
Line Height
(%) A4 Black White TNR 19 110
A8 Black White Arial 19 110
D4 Green Yellow TNR 19 110
B3 Blue Yellow TNR 19 80
B7 Blue Yellow Arial 19 80
C6 Yellow Red Arial 16 110
D3 Green Yellow TNR 19 80
E1 Red Green TNR 16 80
E5 Red Green Arial 16 80
E3 Red Green TNR 19 80
Figure 2: Example of dynamic interfaces
Procedure
This section explains the procedure that was followed to carry out the experiment with the participants. Each subject was tested individually and they are required to use Web-based application prototype called VDIS. Before the experiment started, the participants were tested with the Ishihara color blindness online test to ensure that the participants were not color blind(Nakatsukal et al., 1992). Fortunately, all the participants passed the color blindness test and were eligible to participate in this experiment. At the beginning of the experiment, the researcher explained the procedures of the testing to the participants and they could ask for any
clarification. Afterwards, the participants started using the VDIS for the testing purposes.
Initially, the participants were asked to fill in their personal information and Web usage information through the system. Further, the participants can played with the practice tasks and when they were ready, they started performed their real. There were ten interfaces in which the system changed its elements automatically as in Figure 2. After the participants read comprehension of each page, they have to click the “Next” button. Then, the system displayed the SAM test. Afterward, the participants were required to rate their emotion on the SAM arousal and valence scales. Participants had been advised to rate their feelings based on the presentation of the interface and not according to the content of the passages. After the SAM test was completed, the system presented a “thank you” page and the participants were asked to exit from the system.
RESULTS AND DISCUSSION
In this study, the data analyses included preliminary analyses to check the reliability of the SAM instrument and to test the normality of the emotional data gathered from the web page. Subsequently, the main analyses which are multivariate analysis of variance (MANOVA) and analysis of variance (ANOVA) were employed to test the hypotheses postulated in the study. In addition, this study used the significant value of p = 0.05 to determine
significance for every main analysis. The
presentation of the results for emotions is divided into two sections, namely the preliminary results and the main results.
Preliminary Results
Table 3 provides the reliability results for the two dimensions of emotion, namely, valence and arousal. All the Cronbach‟salpha values reached high values, between 0.70 to 0.89, which means that the internal consistency reliability of the SAM graphic rating scale can be considered to be acceptable and good.
Table 1: Reliability of SAM scales Cronbach‟s Alpha Value
for Valence
Cronbach‟s Alpha Value for Arousal
.749 .881
165
Table2: Skewness and kurtosis analysis
In
te
rf
ac
e
s
Valence/Arou sal
Skewness Kurtosis Statistic SE Statistic SE
A4
Valence -.028 374 .561 .733 Arousal .686 .374 -.529 .733
A8
Valence -.010 .374 .375 .733 Arousal 1.242 .374 1.619 .733
B3
Valence -3.54 .374 -.252 .733
Arousal .045 .374 -.313 .733
B7
Valence -.151 .374 .278 .733
Arousal .009 .374 -.960 .733
C6
Valence .335 .374 -.563 .733
Arousal -.122 .374 -.988 .733
D3
Valence -.479 .374 -.434 .733
Arousal .334 .374 -.640 .733
D4
Valence -.670 .374 .367 .733
Arousal .125 .374 -.792 .733
E1
Valence .456 .374 -.670 .733
Arousal .533 .374 -.332 .733
E3
Valence .229 .374 -.777 .733
Arousal .144 .374 -.935 .733
E5
Valence .265 .374 -1.011 .733
Arousal .420 .374 -6.14 .733
Main Results
The one-way between-groups MANOVA was conducted to test the effect of visual design elements (independent variable)on emotion particularly on valence and arousal (two dependent variables). Table 5 shows the outcome of MANOVA analysis which are the multivariate effects for the ten dynamic interface. From Table5, it can be seen that there was a significant effect of the ten dynamic interfaces on the combined emotion dependent variables (valence and arousal): F(18, 778) = 10.87, p =.000; Wilks’ Lambada = .64; partial eta squared = .20. These results indicate that levels of pleasure and arousal varied following various interfaces with which the participants interacted.
Table 6 depicts the results for the dependent variables when they were considered separately. Using a Bonferroni adjusted alpha level of .025, separate univariate ANOVAs on the outcome variables for the webpage revealed a significant interface profile effect on Valence F (9, 390) = 17.55, p<. 05, and Arousal F (9, 390) = 5.00, p <. 05. This indicates that the participants‟ emotional reaction of valence and arousal differed significantly in response to the stimuli of the ten dynamic interfaces when they were analysed individually.
Table 5: Significant multivariate effects
Variable Wilks‟
Lambada F df
Error df Sig. Ten
dynamic interfaces
.638 10.874 18.000 778.0
00 .000
Table 0: Significant univariate effects
Dependent
Variable df df error f Sig. Valence 9 390 17.546 .000 Arousal 9 390 4.999 .000
Since separate univariate ANOVAs discovered there were significant differences between the ten independent variables (ten dynamic interfaces) and there were more than two levels of the independent variable, it suggested the need to conduct a follow-up univariate analysis to identify where the significance lay (Pallant, 2011). The following section (under the sub-sections of valence and arousal) discusses the results of the Tukey Multiple Comparison Procedure that was used to test the simple effects of the ten dynamic interfaces on each of the two dependent variables, valence and arousal.
Valence
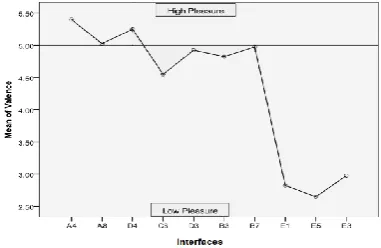
Figure 3illustrates a line graph of the mean valence responses to each of the ten dynamic interfaces which is useful in describing the significant findings. The pleasure results showed that the mean valence levels of Interfaces A4, A8, D4, C6, D3, B3 and B7 were significantly more pleasurable than for Interfaces E1, E5 and E3. However, Profiles E1, E5 and E3 didnot significantly differ among themselves.
Figure 3: Average valence levels of ten dynamic interfaces
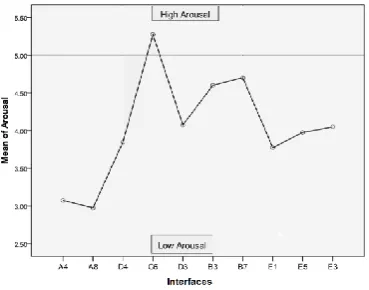
Arousal
166
D3, E5 and E3 were not significantly greater or lower than for the other profiles.
Figure 4: Average arousal levels of ten dynamic interface
Most/Least Pleasant and Most/Least Arousing Dynamic Interfaces
The averaged values and standard deviation of valence and arousal responses to each interface profile were provided to identify participants‟ reactions to valence and arousal for each profile. This data is presented in Table 7.
Table3: Valence and arousal means and standard deviations of each interface
Interfaces Valence Arousal Mean SD Mean SD A4 5.40 (+) 1.84 3.08 (-) 2.03
A8 5.03 (+) 1.62 2.98 (-) 1.89
D4 5.25 (+) 1.76 3.85 (-) 1.81
B3 4.83 (-) 1.62 4.60 (-) 1.82
B7 4.97 (-) 1.72 4.70 (-) 1.86
C6 4.55 (-) 1.53 5.28 (+) 2.18
D3 4.93 (-) 1.99 4.08 (-) 1.79
E1 2.83 (-) 1.39 3.78 (-) 2.12
E3 2.98 (-) 1.38 4.05 (-) 2.21
E5 2.65 (-) 1.31 3.98 (-) 2.13
Note: Positive and negative symbols in the
parentheses indicate the positive/negative valence and arousal based on the quadratic division.
As can be seen from the results reported in Table 7, Interface A4 (M = 5.40) was rated as the most valence (pleasure) interface profile, closely followed by Interface D4 (M = 5.25). The next highest rating
of valence belonged to Interface A8 (M =
5.03),followed by Interface D3 (M = 4.93), Interface B7 (M = 4.97), Interface B3 (M = 4.83), Interface C6
(M = 4.55), Interface E3 (M = 2.98) and Interface E1
(M = 2.83). Finally, the least valence interface profile
was Interface E5 (M = 2.65). These findings revealed
that Interface A4 was the most pleasant interface and Interface E5 was the least pleasant interface. The shaded boxes (purple colour) in Table 7 shows the
most pleasant (Interface A4) and the least pleasant (Interface E5) interfaces.
With regard to arousal, Profile C6 (M = 5.28)
obtained the highest arousal responses from the participants. This was followed by the other interfaces that obtained the second to the ninth rating
of arousal mean scores: Interface B7 (M = 5.28), B3
(M = 4.70), D3 (M = 4.08), E3 (M = 4.05), E5 (M = 3.98), E1 (M = 3.78, D4 (M = 3.85) and A4 (M = 3.08), respectively. Interface A8 was identified as the interface that obtained the lowest arousal mean response. In summary, based on the arousal mean scores, it can be suggested that Interface C6 was the most arousing interface and Interface A8 was the least arousing interface. The shaded boxes (orange colour) in the Table 7 shows the most arousing (Interface C6) and the least arousing (Interface A8) profiles.
Figure 5 illustrates ten dynamic interfaces profiles in two-dimensional space: arousal (X-Axis) and valence (Y-Axis). The locations of ten dynamic interface are shown according to coordinates from the mean valence and arousal values (as presented in Table3). The SAM ratings of various emotions from the International Affective Picture System (IAPS) (J.Lang, 1995; Morris, 1995) were used to correspond with the participants‟ emotions in regard to the ten dynamic interfaces. The SAM emotion words (only stated the emotions that correlated with this study) are located in the same graphs with the emotions generated from the ten interface profiles.
Figure 5: Perceptual plot of ten dynamic interfaces
167
D3 had a neutral valence but was a bit distant from neutral arousal.
Furthermore, Interfaces E1, E3 and E5 were situated very close to each other and quite far from the valence and arousal natural line and might be
considered as boredom, detached, impotent,
despairing and depressed feelings. It appears that those profiles were highly correlated with negative emotions.
The major results regarding dynamic interfaces of the webpage that related with the emotions can be summarised as follows:
i. Ten interface profiles that consisted of five
design elements of each interface significantly evoked the emotional reactions of valence and arousal for the webpage.
ii. Profile A4 was rated as the most pleasant
(valence) profile.
iii. Profile E5 was rated as the least pleasant
(valence) profile.
iv. Profile C6 was rated as the most arousing
profile.
v. Profile A8 was rated as the least arousing profile.
CONCLUSION
The main purpose of this research was to investigate the effects of dynamic interfaces on students‟ emotion in a Web-based learning environment. This study revealed that dynamic interfaces that consist of a variety of color combinations, font types, font sizes and line heights which changing during the interaction between student and web-based learning application could change students‟ affective state.
According to Hashim, Noor and Adnan (2010), the user strives for a more complete and satisfying interactive experience, so interaction designers are challenged to design an experience that involves the senses and generates an affective response. There is, therefore, a clear need for design guidelines involving visual appeal and emotional reactions. Thus, from the Web design perspective, the findings of the present study could provide designers with practical evidence-based user interface guidelines, particularly the association between visual appeal and emotions such as the rules for creating emotional interfaces based on visual design elements including color and typography.
The limitation of this study is the emotions plotted on the chart (Figure 5) didn‟t show any obvious polarity. Even though the results of the present study showed that the visual design elements could significantly induce and change students‟ emotional states, the effects produced particularly in the arousal dimension were not very different among the interfaces. Thus, cautious interpretation should be made of the results regarding arousal.
As a conclusion, further research could extend the present study by implementing a learning application that, besides recognising emotions, could be adapted to the students‟ emotions. For example, a system could accumulate information related to a user‟s emotion and then processes the information to automatically adapt to the individual student‟s emotion. The ability of the system to recognise and adapt to students‟ emotions might give numerous benefits to the students such as keeping them engaged with the system, enhancing their learning experience and helping to tailor the presentation of the information to the specific and individual needs of the students (R. Webster, 2001).
REFRENCES
Beaird, J. (2007). The pronciples of beautiful web design. Collingwood, Victoria, Australia: Site Point Pty. Ltd.
Ekman, P. (1992). An arguement for basic emotions.
Cognition and Emotion, 6(34), 169-200.
Hall, R. H., & Hanna, P. (2004). The impact of Web
page text-background color combinations on
readability, retention, aesthetics, and behavioral
intention. Behaviour & Information Technology,
23(3), 183-195.
Hashim, W. N. W., Noor, N. L. M., & Adnan, W. A.
W. (2010). Web Aesthetic Intercation Design Pattern
in Popular Clothing Brands Websites: An Initial
Investigation. Paper presented at the IEEE
International Conference on Systems, Man and Cybernatics (SMC). Istanbul.
J.Lang, P. (1995). The emotion probe. American
Psychologist Association, 50(5), 372-385.
Kim, J., Lee, J., & Choi, D. (2003). Designing emotionally evocative homepages: an empiricalstudy of the quantitative relations between design factors
and emotional dimensions. International Journal
Human-Computer Studies, 59, 899-940.
Kim, J., & Moon, J. Y. (1997). Designing towards
emotional usability in customer
interfaces-trustworthiness of cyber-banking system interfaces.
Interacting with Computers, 10, 1-29.
Lin, H., Pan, F., Wang, Y., Lv, S., & Sun, S. (2010). Affective computing in e-learning. In M. Buzzi (Ed.),
E-Learning (pp. 117-128): INTECH.
McClurg-Genevese, J. D. (2005). The principles of
168
Morris, J. D. (1995). Observations: SAM: The Self Assessment Manikin; An efficient cross-cultural
measurement of emotional response. Journal of
Advertising Research, 35(8), 63-68.
Nakatsukal, H., Watanabe, T., Takeuchi, Y., Hisanaga, N., Shibata, E., Suzuki, H., . . . Ikeda, M. (1992). Absence of blue-yellow color vision loss
among workers exposed to toluene or
tetrachloroethylene, mostly at levels below
occupational exposure limits. International Archieves
of Occupational Environmental Health, 64, 113-117. Norman, D. A. (2002). Emotion and design:
Attractive things work better. Interactions Magazine,
356-342.
Norman, D. A. (2004). Emotional Design: Why we
love (or hate) everydat things. New York: Basic Book.
Pallant, J. (2011). SPSS survival guide: A step by step guide to data analysis using the SPSS program
(Fourth ed.). New South Wales, Australia: Allen and Unwin
Pearce, L. (2010). Principles and design elements of design. New Zealand: Team Solutions, The University of Auckland.
Ramadan, M. Z. (2011). Evaluating college students‟ performance of Arabic typeface style, font size, page
layout and foreground/background color
combinations of e-book materials. Journal of King Saud University - Engineering Sciences, 23(2), 89-100.
Reichenstein, O. (2006). The 100% Easy-to-read standard. Retrieved 12 March 2013, 2013, from http://informationarchitects.net/blog/100e2r
Russell, J. A. (1980). A circumplex model of affect.
Journal of Personality and Social Psychology, 39(6), 1161-1178.
Shaikh, A. D., Chaparro, B. S., & Fox, D. (2006). Perception of fonts: Perceived personality traits and
uses. Usability News, 8(1).
http://www.surl.org/usabilitynews/81/PersonalityofF onts.asp
Stocks, E. J. (2009). Sexy web design. Victoria, Australia: SitePoint Pty. Ltd.
Tseng, T.-P., & Ma, M.-Y. (2010). Emotions and fonts: constructing emotional map of chinese fonts. Paper presented at the International Conference on Kansei Engineering and Emotion Research, Paris.
Tsonos, D., & Kouroupetroglou, G. (2008). A Methodology for the Extraction of Reader‟s Emotional State Triggered from Text Typography.
Tools in Artificial Intelligence, 439-454.
Tsonos, D., & Kouroupetroglou, G. (2011). Modeling reader's emotional state response on document's
typographic elements Advances in Human-Computer