R E S E A R C H
Open Access
The relationship between energy
consumption, economic growth and
carbon dioxide emissions in Pakistan
Muhammad Kamran Khan
*, Muhammad Imran Khan and Muhammad Rehan
* Correspondence:
kamrankhanaup@gmail.com
School of Economics, Northeast Normal University, Changchun, Jilin, China
Abstract
Developing countries are facing the problem of environmental degradation. Environmental degradation is caused by the use of non-renewable energy consumptions for economic growth but the consequences of environmental degradation cannot be ignored. This primary purpose of this study is to investigate
the nexus between energy consumption, economic growth and CO2emission in
Pakistan by using annual time series data from 1965 to 2015. The estimated results of ARDL indicate that energy consumption and economic growth increase the CO2 emissions in Pakistan both in short run and long run. Based on the estimated results it is recommended that policy maker in Pakistan should adopt and promote such renewable energy sources that will help to meet the increased demand for energy by replacing old traditional energy sources such as coal, gas, and oil. Renewable energy sources are reusable that can reduce the CO2 emissions and also ensure sustainable economic development of Pakistan.
Keywords:Energy consumption, Economic growth, CO2 emissions, ARDL
Introduction
Pakistan is a developing country in South Asian countries, economy of Pakistan is grow-ing rapidly and it is expected that the economic growth of Pakistan will continue with same trend in the future. Pakistan’s economy depends on agriculture, and agriculture is the main dominant sector of the country, but due to repaid growth of industrial sector in Pakistan, the agriculture land is cutting. Besides this, rapid increase in population causes deforestation; Pakistan is top ranked country in Asian countries that faces the problem of deforestation. Increase in economic growth and industrial sectors use energy for growth that causes environmental degradation. Pakistan is facing high demand of energy for which traditional energy sources are used to meet its fast increasing demand for energy. Wolde-Rufael and Menyah (2010) stated that use of traditional energy resources causes to discharges carbon dioxide that helps to deteriorate environmental quality. Ahmed et al. (2015) stated that environmental degradation affect the environment and health of the human being in Pakistan. Yang and Li (2017) stated that environmental degradation is caused by vast amount of greenhouse gas emissions, including carbon dioxides, nitrous oxide, and methane. Shahbaz et al. (2013) stated that use of fossil fuels for daily life, massive smoke expulsion from the factories and consumption of wood as an energy
source boost the CO2 emissions. Carbon dioxide emissions have a destructive impact on the economy and other sectors such as agriculture and forestry.
Chaudhry (2010); Pao and Tsai (2010); Siddiqui (2004) investigated the association between energy consumption, economic growth, and sustainable environment. Most re-searches have been done for developed countries such as European countries and American countries (Kasman and Selman 2015). Early researches on the same subject have generally concluded that the development of economy and energy consumption causes the CO2emissions.
Several research studies have pointed out the relationship between the development of the economy, non-renewable energy and CO2 emissions, that is essential for under-standing and refining the development pattern of developing countries like Pakistan. The societies which have gifted with plentiful natural resources can efficiently mitigate import of fossil sources and emissions of carbon dioxide. Balsalobre et al. (2018) stated that energy strategy implementation is validated to decrease dependence on the use of non-renewable energy sources. Non-renewable energy sources still profoundly influ-ence the energy mix. This explicates the sustainability of both energy sources, i.e., re-newable and non-rere-newable that may occur in the long-run.
The main objective of this research study is to investigate the association between en-ergy consumption, economic growth, and carbon dioxide emission in Pakistan. Different researchers identified that environmental degradation is caused by using non-renewable energy consumption and economic growth in developed countries. This research study will help to clear the gap between early researches by controlling the model for energy consumption, economic growth, and CO2 emissions. This research study used newly de-veloped econometric techniques the Auto-Regressive Distributive Lag (ARDL) bound testing for cointegration. ARDL model have different advantages as compared to other cointegration method. ARDL model can be applied if the variables are stationary at level or first difference of both of them while other cointegration methods need same order of integration. Different lag can be used for dependent and independent variables (Pesaran et al. (2001). This study will provide a new vision for policymakers to design key policy in-struments on balancing economic growth and environmental quality.
Literature review
Acar and Lindmark (2017) investigated the convergence of CO2 emissions in OECD countries by using (oil vs. coal) as energy source. The authors divided the study period into two sub-periods. The first period covers the oil price shocks of OPEC, where the OECD oil policy was to a great extent governed by energy security concerns and Cold War strategic considerations. The second period correspond rise climate policy in sev-eral OECD countries. Due to such contextual differences, oil and coal behave differ-ently in the two sub-periods on economic growth.
Destek (2017) indicated that economic development is positively affected by non-renewable biomass energy consumption countries. Fan and Lei (2017) examined the as-sociations between environmental degradation transportation and economic develop-ment in Beijing by using time series data for econometric analysis from 1995 to 2014. The estimated results pointed out that transportation and CO2 emissions have a posi-tive influence on economic growth.
Işik et al. (2017) applied Autoregressive distributed lag (ARDL) model to check the association between the study variables. The estimated results revealed that economic growth, the growth of financial system, international trade and tourism expenditures positively impact the Greece’s CO2 emissions. They stated that tourism, as a leading sector in the Greek economy, has severe negative environmental impacts for Greece in the long run. Therefore, they suggested that Greece should actively take into consider-ation this threat from the tourism sector as this one sector dominates the whole Greek economy.
Isik et al. (2019) investigated the impact of real GDP, population, and renewable en-ergy and fossil enen-ergy consumptions on CO2 emissions in ten US states from 1980 to 2015. The examined results indicated that the EKC hypothesis is valid for the following states Florida, Illinois, Michigan, New York, and Ohio. The results indicated that fossil energy consumption have negative impacts on CO2 emission levels in Texas while en-ergy consumption having positively influence on CO2 emissions in Florida but this im-pact is lower as compared to other states of US.
Azam et al. (2016) inspected the influences of CO2 emissions, energy use, trade, and human capital on economy growth from 1971 and 2013 for China, the USA, India, and Japan by utilizing panel fully modified ordinary least squares (FMOLS) for checking the association among the study variables. The examined results pointed out that CO2 emissions and energy consumption negatively and significantly influences the economic growth while trade and human capital positively and significantly influences the eco-nomic growth.
Hanif (2018) studied the influences of economic growth; urban expansion; and con-sumption of fossil fuels, solid fuels, and renewable energy on CO2 emission in Sub-Saharan Africa economies from 1995 to 2015 by utilizing the GMM model for examin-ation of the associexamin-ation among the study variables. The examined results indicated that consumption of fossil and solid fuels positively impact the CO2 emissions while renew-able energy helps to decrease the CO2 emissions.
Saboori et al. (2017) examined the association of oil consumption, economic growth and with environmental degradations in three Asian countries from 1980 to 2013 by applying Johansen cointegration test for checking the relationship among the study var-iables. The examined results indicated that uni-directional causality running from oil consumption to economic growth in China and Japan, while oil consumption to CO2 emissions in South Korea.
Bhat (2018) studied the impact of energy consumption, economic growth on carbon diox-ide from 1992 to 2016 by utilizing Panel ARDL model for checking the association among the study variables. The examined results indicated that capital, labor, population, per-capita income, and non-renewable energy consumption positively impact the CO2 emissions.
model. The examined results indicated that economic growth is not impacted by by en-ergy consumption and CO2 emission while enen-ergy consumption and economic growth positively influence the CO2 emission.
Tamba et al. (2017) inspected the impact of gasoline energy consumption on eco-nomic growth in Cameroon by utilizing autoregressive vector (VAR) model and Wald test for testing causality. The estimated results showed that no long-term relationship exists among the study variables. Bidirectional causality relationship between gasoline consumption and economic growth exists in Cameroon. The estimated results showed that reducing gasoline consumption without appropriate and established energy policies are not a possible solution to maintain Cameroon’s economic growth.
Apergis et al. (2010) and Zoundi (2017) stated that renewable energy exploitation was restricted by different conditions and the level of economic growth in the low-income countries. Sinha and Shahbaz (2018) stated that the high cost of initial stage of able energy development results demotivate in developing countries to invest in renew-able energy sources. It appears that promoting renewrenew-able energy in some low-income countries may lead to restrain their economic progress in the short run. Inglesi-Lotz and Dogan (2018) suggested that shifting energy consumption away from fossil fuels to renewable energy sources is a challenge for developing countries. Different energy structures between the developing and developed countries are different because of technological and economic conditions.
Methodology
Unit root test
Stationarity in time series data is a common problem. It is necessary to check the station-arity of the variables before using ARDL model. Traditional methods for assessment in applied econometrics are based on the supposition of normality saying mean, and variance does not change over time. However, the mean and variance of many economic elements do not remain constant and such type of variables is known as unit root variables. Trad-itional approach (i.e., ordinary least square, OLS) produces biased and unreliable estimates in the presence of stationary data. In this research, we used a great unit root test, such as PP (Phillips and Perron 1988), ADF (Dickey et al. 1979). Our empirical analysis checks stationarity of each variable by applying PP and ADF unit root test.
Autoregressive distributive lag
Time series data for this study was collected from world development indicator World Bank, from 1965 to 2015. The selection choice of the period was based on the data avail-ability. Carbon dioxide emissions is used as a measure for environmental degradation, and it is measured as CO2emission per capita, PCI is used as proxy for economic growth,
measured as percentage of gross domestic product (constant 2010 USD), CLCNM is coal consumption, OLCNM is oil consumption, NTGCNM is the natural gas consumption are explanatory variables. Following is the main regression equation for our variables.
CO2emt ¼β0þβ1PCItþβ2CLCNMtþβ3OLCNMtþβ4NTGCNMtþεt
estimate the long run estimates between CO2emission, economic growth, energy
con-sumption. Prior studies in energy economics suggest several econometric approaches to check the existence of the cointegration. However, the bound testing approach was preferred due to several reasons. The ARDL bound testing method is most suitable when the variables are integrated at the order of 1(0) or 1(1). Besides, it is useful when data size is small. The lag modification in the ARDL model gives fair estimations of the long run and effective t-statistic value even in the presence of endogeneity (Pesaran et al.2001). Therefore, this study applied the ARDL method to investigate cointegration among energy consumption, economic growth, and CO2emission.
The ARDL Bound testing approach is given by the following equations:
ΔCO2emt ¼β0þ Xq1
i¼1
β1iΔCO2emt−iþ
Xq2
i¼1
β2iΔPCIt−iþ
Xq3
i¼1
β3iΔCLCNMt−i
þX
q4
i¼1
β4iΔOLCNMt−iþ
Xq5
i¼1
β5iΔNTGCNMt−iþδ0CO2emt−iþδ1PCIt−i
þδ2CLCNMt−iþδ3OLCNMt−iþδ4NTGCNMt−iþμt
ΔPCIt ¼β0þ Xq1
i¼1
β1iΔPCIt−iþ Xq2
i¼1
β2iΔCO2emt−iþ Xq3
i¼1
β3iΔCLCNMt−i
þX
q4
i¼1
β4iΔOLCNMt−iþ
Xq5
i¼1
β5iΔNTGCNMt−iþδ0PCIt−iþδ1CO2emt−i
þδ2CLCNMt−iþδ3OLCNMt−iþδ4NTGCNMt−iþμt
ΔCLCNMt¼β0þ Xq1
i¼1
β1iΔCLCNMt−iþ Xq2
i¼1
β2iΔCO2emt−iþ Xq3
i¼1
β3iΔPCIt−i
þX
q4
i¼1
β4iΔOLCNMt−iþ Xq5
i¼1
β5iΔNTGCNMt−iþδ0CLCNMt−i þδ1CO2emt−iþδ2PCIt−iþδ3OLCNMt−iþδ4NTGCNMt−iþμt
ΔOLCNMt ¼β0þ Xq1
i¼1
β1iΔOLCNMt−iþ Xq2
i¼1
β2iΔCO2emt−iþ Xq3
i¼1
β3iΔPCIt−i
þX
q4
i¼1
β4iΔCLCNMt−iþ Xq5
i¼1
β5iΔNTGCNMt−iþδ0OLCNMt−i þδ1CO2emt−iþδ2PCIt−iþδ3CLCNMt−iþδ4NTGCNMt−iþμt
ΔNTGCNMt ¼β0þ Xq1
i¼1
β1iΔNTGCNMt−iþ
Xq2
i¼1
β2iΔCO2emt−iþ
Xq3
i¼1
β3iΔPCIt−i
þXq 4
i¼1
β4iΔCLCNMt−iþ Xq5
i¼1
β5iΔOLCNMt−iþδ0NYGCNMt−i
þδ1CO2emt−iþδ2PCIt−iþδ3CLCNMt−iþδ4OLCNMt−iþμt
δ1=δ2=δ3=δ4= 0 and alternative hypothesis H0:δ0≠δ1≠δ2≠δ3≠δ4≠0 indicating
the long run association between the study variables. Cointegration is based on the re-sults of the F value in the bound testing approach. If the calculated F-value exceeds the upper bound, the null hypothesis of no cointegration is rejected, but the result is con-sidered un-decidable when the F-value lies between upper and lower bound values. The error correction model for the estimation of the short-run relationships is specified as:
ΔCO2emt ¼β0þ Xq1
i¼1
β1iΔCO2emt−iþ
Xq2
i¼0
β2iΔPCIt−iþ
Xq3
i¼0
β3iΔCLCNMt−i
þX
q4
i¼0
β4iΔOLCNMt−iþ
Xq5
i¼0
β5iΔNTGCNMt−iþη1ECTt−iþμt
ΔPCIt ¼β0þ Xq1
i¼1
β1iΔPCIt−iþ
Xq2
i¼0
β2iΔCO2emt−iþ
Xq3
i¼0
β3iΔCLCNMt−i
þXq 4
i¼0
β4iΔOLCNMt−1þ Xq5
i¼0
β5iΔNTGCNMt−iþη2ECTt−iþμt
ΔCLCNMt¼β0þ Xq1
i¼1
β1iΔCLCNMt−iþ Xq2
i¼0
β2iΔCO2emt−iþ Xq3
i¼0
β3iΔPCIt−i
þX
q4
i¼0
β4iΔOLCNMt−iþ Xq5
i¼0
β5iΔNTGCNMt−iþη3ECTt−iþμt
ΔOLCNMt ¼β0þ Xq1
i¼1
β1iΔOLCNMt−iþ Xq2
i¼0
β2iΔCO2emt−iþ Xq3
i¼0
β3iΔPCIt−i
þX
q4
i¼0
β4iΔCLCNMt−iþ
Xq5
i¼0
β5iΔNTGCNMt−iþη4ECTt−iþμt
ΔNTGCNMt ¼β0þ Xq1
i¼1
β1iΔNTGCNMt−iþ
Xq2
i¼0
β2iΔCO2emt−iþ
Xq3
i¼0
β3iΔPCIt−i
þX
q4
i¼0
β4iΔCLCNMt−iþ
Xq5
i¼0
β5iΔOLCNMt−iþη5ECTt−iþμt
In the above equations η1 to η5 indicating the speed of adjustment, ECTt−i is the lagged error correction term. ECTt−i is expected to be negative and significant. The CUSUM and CUSMSQ are also used for model stability check (Brown et al. 1975). Breusch–Godfrey is used for checking the serial correlation, and Breusch-Pagan-Godfrey was used for checking Heteroskedasticity.
Results and discussions (Table 1)
model can be applied for checking the short and long run association among the study variables.
Table 2 shows the results of Lag length selection criteria for Co-integration. Usually, the researcher uses AIC and SC criteria for lag length selection because these two are superior for the small sample. We have selected AIC lag length from the above table. According to AIC lag length selection criteria lag 2 is the best option for lag length and is appropriate for ARDL approach.
Table 3 shows the results of Heteroskedasticity and serial correlation LM test. The result of Breusch Pagan Godfrey chi-square value is 0.7259 which higher than 5%, which indicates that there is no Heteroskedasticity problem in our data. The result of the LM test shows that probability chi-square is more significant than 5% that indicates that our data is free of the problem of serial correlation.
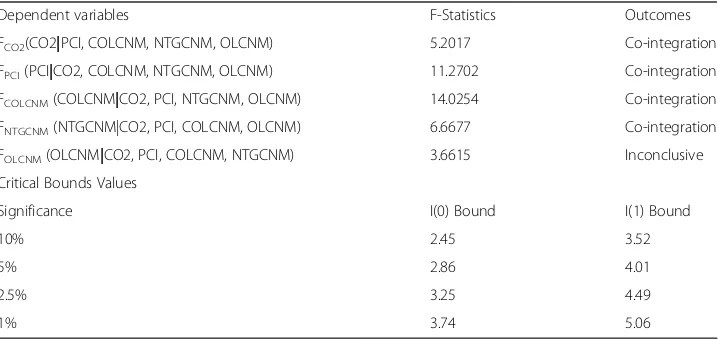
Table 4indicates the results of Bound test; F statistic applied for investigation of co-integration relationship. The above-estimated results are according to Narayan (2005). The empirical results show that the estimated F-statistics for FCO2(CO2|PCI,
COLCNM, NTGCNM, OLCNM) value is 5.2017 that is higher than the upper bound value at 5%, based on the estimated result of first equation co-integration exists among the variables. In the second equation, we changed the dependent variable from CO2 emission to per capita income FPCI (PCI|CO2, COLCNM, NTGCNM, OLCNM).
F-statistics value of the second equation indicates that cointegration exists at 5% because Table 1Unit Root Test
ADF Phillips-Perron
Level
Variables Intercept Trend & Intercept Intercept Trend & Intercept
Co2 Per Capita −0.0105 −3.9313** −0.1172 −2.3169
Per Capita % Of GDP −6.6133* −6.6682* −6.6134* −6.6690*
Coal Consumption −0.4811 −1.8007 −0.2819 −2.5639
Natural Gas Consumption 0.2805 −1.9188 0.7109 −1.6321
Oil Consumption 1.0150 −2.0356 1.2493 −1.6065
First Difference
Co2 Per Capita −6.6240* −6.5945* −6.6824* −6.6536*
Per Capita % Of GDP −6.6240* −11.3836* −6.6824* −26.4811*
Coal Consumption −3.9032** −4.4879** −7.0700* −7.1254*
Natural Gas Consumption −3.5880** −3.7317** −3.5408* −3.6997**
Oil Consumption −3.5999** −4.0415** −4.0651** −4.7010**
1, 5 and 10% levels is indicated respectively by *, ** and ***
Table 2Lag length criteria for Co-integration
Lag LogL LR FPE AIC SC HQ
0 −381.6793 NA 9.6319 16.4544 16.6513 16.5285
1 −140.3190 421.0967 0.0009 7.2476 8.4286 7.6920
2 −76.9002 97.1521* 0.0002* 5.6128* 7.7778* 6.4275*
3 −59.8911 22.4376 0.0003 5.9528 9.1019 7.1379
4 −30.7264 32.2673 0.0003 5.7756 9.9089 7.3309
the F-statistics value is 11.2702 that is higher than the upper bound. In third equation FCOLCNM (COLCNM|CO2, PCI, NTGCNM, OLCNM) we used coal consumption as
the dependent variable, results show that F-statistics value is 14.0254 that is higher than upper bound, results of F-statistics indicates the long run relationship of the third equation. In the fourth equation of bound test, we used FNTGCNM (NTGCNM|CO2,
PCI, COLCNM, OLCNM) natural gas consumption as the dependent variable. F-statistics result indicates a long-run relationship between the variables at 5%. In the last equation we used oil consumption as dependent variable FOLCNM(OLCNM|CO2, PCI,
COLCNM, NTGCNM), F-statistics indicate no-long run association among variables because the F-statistics value is between the lower and upper bound at 5%.
Table 5shows the results of long-run coefficients of ARDL model; CO2emission per
capita is the dependent variable. Three proxies were used for measuring energy con-sumption, i.e., coal concon-sumption, natural gas concon-sumption, and oil consumption and per capita income is used to measure the economic growth in Pakistan.
Non-renewable energy resources have a positive and significant effect on environ-mental degradation. Coal consumption indicates positively effect on CO2 emissions in Pakistan. 1% increase in consumption of coal for energy use increase CO2emissions up
to 6.70% in Pakistan. Another source of non-renewable energy is natural gas that is mostly used for energy consumption in Pakistan; the coefficient of natural gas indicates the positive and statistically non-significant effect on CO2 emissions in Pakistan. The coefficient of natural gas indicates that 1% increase in the use of natural gas for energy consumption boosts environmental degradation 3.05% in Pakistan. Oil consumption is the primary source of energy consumption in Pakistan, and the coefficient indicates a Table 3Serial Correlation and Heteroskedasticity Test
Breusch-Godfrey Serial Correlation LM Test
F-statistic 1.8491 Prob. F(2,23) 0.1724
Obs*R-squared 4.6827 Prob. Chi-Square(2) 0.0962
Heteroskedasticity Test: Breusch-Pagan-Godfrey
F-statistic 0.6425 Prob. F(25,6) 0.7808
Obs*R-squared 7.8589 Prob. Chi Square(12) 0.7259
1, 5 and 10% levels is indicated respectively by *, **and ***
Table 4Bounds test for the existence of Co-Integration
Dependent variables F-Statistics Outcomes
FCO2(CO2|PCI, COLCNM, NTGCNM, OLCNM) 5.2017 Co-integration
FPCI(PCI|CO2, COLCNM, NTGCNM, OLCNM) 11.2702 Co-integration
FCOLCNM(COLCNM|CO2, PCI, NTGCNM, OLCNM) 14.0254 Co-integration
FNTGCNM(NTGCNM|CO2, PCI, COLCNM, OLCNM) 6.6677 Co-integration
FOLCNM(OLCNM|CO2, PCI, COLCNM, NTGCNM) 3.6615 Inconclusive
Critical Bounds Values
Significance I(0) Bound I(1) Bound
10% 2.45 3.52
5% 2.86 4.01
2.5% 3.25 4.49
positive and statistically significant effect on environmental degradation in Pakistan. 1% increase in Oil consumption for energy production or industrial production in the economy enforce to increase environmental degradation by 0.09% in Pakistan. The findings are supported by Dogan and Seker (2016), Jebli et al. (2016), Ali et al. (2015), and Shahbaz et al. (2014). It is observed from the previous studies that the use of non-renewable energy natural resource increases pollution and degrades environmental quality by contributing to CO2 emission. Mostly these resources of non-renewable en-ergy are used for economic activities in developing countries that cause the degradation of the environment in of CO2 emissions. In practice, this requires the governments to take wide-ranging initiatives to diversify its energy supply, in the long run, to meet in-creasing demand and also attract foreign investors who provide green production tech-nologies and capital.
Economic activities in developing countries also cause environmental degradation be-cause these countries are using non-renewable energy resources for industrial and other economic activities that boost CO2 emissions in society. Concerning the environ-mental impact of economic growth, economic growth has a positive and statistically non-significant effect on environmental degradation. Estimated results show that when economic growth in Pakistan increases in shape of industrial development or any other economic activity the CO2emissions also increases. The coefficient of per capita shows
that 1% elevation in economic growth increases environmental degradation in the economy of Pakistan about 1.03%. Ang (2007) stated that economic growth has a posi-tive effect on CO2 emission, degradation of the environment is caused by economic growth and industrial development. Arouri et al. (2012) also stated that GDP growth is the primary cause of environmental degradation in MENA countries (Table6).
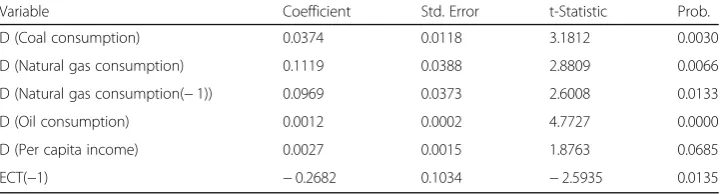
Results of short-run ARDL are same as long-run ARDL model. Coal consumption, oil consumption, and natural gas consumption are the primary source of non-renewable energy consumption in Pakistan. Results of non-non-renewable energy consump-tion indicate a positive impact on environmental degradaconsump-tion in Pakistan. Economic growth also causes environmental degradation due to repaid growth of industries and Table 5Long Run ARDL Results
Variable Coefficient Std. Error t-Statistic Prob.
Coal consumption 0.0670 0.0316 2.1202 0.0408
Natural gas consumption 0.0305 0.0374 0.8156 0.4200
Oil consumption 0.0009 0.0002 4.2382 0.0001
Per capita income 0.0103 0.0071 1.4388 0.1586
C 0.2012 0.0339 5.9396 0.0000
Table 6Short Run ARDL Results
Variable Coefficient Std. Error t-Statistic Prob.
D (Coal consumption) 0.0374 0.0118 3.1812 0.0030
D (Natural gas consumption) 0.1119 0.0388 2.8809 0.0066
D (Natural gas consumption(−1)) 0.0969 0.0373 2.6008 0.0133
D (Oil consumption) 0.0012 0.0002 4.7727 0.0000
D (Per capita income) 0.0027 0.0015 1.8763 0.0685
other sectors in the economy. Economic growth indicates a positive effect on the deg-radation of the environment in Pakistan. It is average in developing countries economy when the economic growth increases, so it causes to raise the CO2 emissions in the economy because of the economic activities in shape of a considerable number of fac-tories which cause CO2 emissions. The coefficient of ECT is negative and statistically significant that suggests that any change in CO2 emissions from short-run towards long period is accurate by 26.81% every year (Table7).
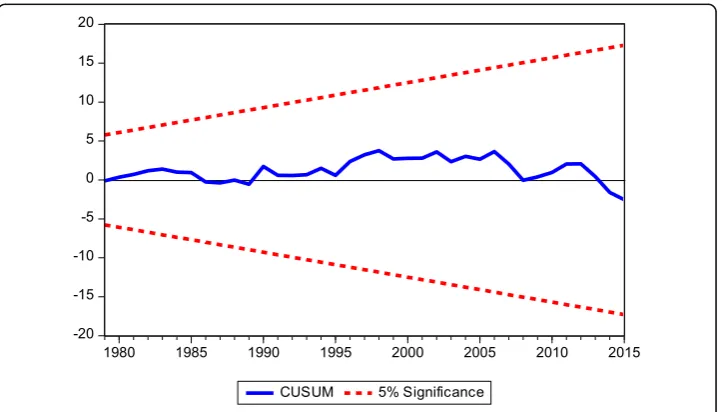
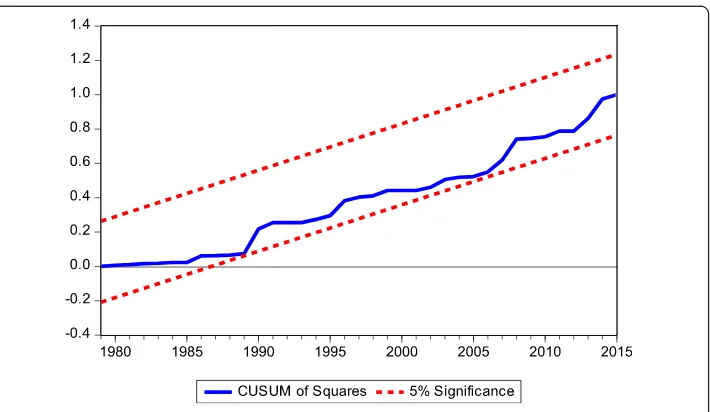
The above shows the diagnostics test. The r-squared value indicates that 99% vari-ation independent variable is explained by coal consumption, oil consumption, natural gas consumption these three are used for measuring energy consumption and per capita income which is used to measure economic growth. AIC and SIC showed that the model is fit; Durbin Watson indicates that there is no problem of autocorrelation in our data (Figs.1and2).
CUSUM and CUSUM of squares indicate that the model is stable because the blue line among the two red lines which shows the stability of coefficients.
Conclusions and recommendations
This primary objective of this paper is to examine the nexus between energy consump-tion, economic growth and CO2 emission in Pakistan from 1965 to 2015. Stationarity
of each time series was checked through Augmented Dickey–Fuller (ADF) and Phillips-Perron (PP) Unit Root Tests. The results of the Augmented Dickey–Fuller (ADF) and Phillips-Perron (PP) Unit Root Tests indicated that all the time series are stationary at Table 7Diagnostics Test
R-squared 0.9950 Akaike info criterion −5.0097
Adjusted R-squared 0.9935 Schwarz criterion −4.5464
F-statistic 669.4427 Durbin-Watson stat 2.4669
Prob(F-statistic) 0.0000
level and first difference and none of the series are at second difference. Autoregressive distributed lag (ARDL) is applied for checking cointegration among the series. Long run ARDL results pointed out that energy consumption have a positive effect on CO2 emissions in Pakistan. Coefficient of economic growth indicates a positive effect on the CO2 emissions in Pakistan both short and long run.
Based on the results of this study, it is recommended that government of Pakistan should educate the local people to motive them toward plantation with forest depart-ment to increase the share of the forest to control environdepart-mental degradation in Pakistan. Estimated results indicated that environmental degradation is the main cause of economic growth so it is recommended to revise policy related to economic growth in Pakistan for controlling the environmental degradations. Non-renewable sources of energy are used as a fuel and for industrial production and household energy consump-tion in Pakistan so it is recommended to adopt such energy sources that cause mini-mum environmental degradation. To control the environmental degradations in the long run, the policy makers are recommended to adopt such policies that encourage using environment-friendly equipment, machinery, vehicles, and utilities to minimize the environmental degradations.
Abbreviations
ADF:Augmented Dickey-Fuller; ARDL: Autoregressive distributed lag; CO2: Carbon Dioxide emissions; COLCNM: Coal Consumption; ECM: Error correction model; NTGCNM: Natural gas consumptions; OLCNM: Oil consumptions; PCI: Per capita income is used for Economic growth; PP: Phillips and Perron
Acknowledgments
I am very thankful to all friends for their help and suggestion their valuable comments regarding this research paper.
Authors’contributions
We are very thankful to all friends for their help and suggestion their valuable comments regarding this research paper. Currently this research paper did not receive any financial aid from any source.
Funding
Currently, this research paper did not receive any financial aid from any source.
Availability of data and materials
The data used in this research paper were obtained from the World Development indicator (World Bank):https://data. worldbank.org/products/wdi
Competing interests
The authors declare that they have no competing interests.
Received: 12 November 2018 Accepted: 20 November 2019
References
Acar S, Lindmark M (2017) Convergence of CO2 emissions and economic growth in the OECD countries: did the type of fuel matter? Energy Sources Part B: Econ Planning Policy 12(7):618–627
Ahmad A, Zhao Y, Shahbaz M, Bano S, Zhang Z, Wang S, Liu Y (2015) Carbon emissions, energy consumption and economic growth: An aggregate and disaggregate analysis of the Indian economy. Energy Policy, 96, 131–143
Ali A, Khatoon S, Ather M, Akhtar N (2015) Modeling energy consumption, carbon emission and economic growth: Empirical analysis for Pakistan. International Journal of Energy Economics and Policy, 5(2), 624–630
Alshehry AS, Belloumi M (2015) Energy consumption, carbon dioxide emissions, and economic growth: the case of Saudi Arabia. Renew Sust Energ Rev 41:237–247
Ang JB (2007) CO2 emissions, energy consumption, and output in France. Energy Policy 35:4772–4778
Apergis N, Payne JE, Menyah K, Wolde-Rufael Y (2010) On the causal dynamics between emissions, nuclear energy, renewable energy, and economic growth. Ecol Econ 69(11):2255–2260
Arouri MEH, Youssef AB, M'henni H, Rault C (2012) Energy consumption, economic growth and CO 2 emissions in the Middle East and north African countries. Energy Policy 45:342–349
Asumadu-Sarkodie S, Owusu PA (2017a) A multivariate analysis of carbon dioxide emissions, electricity consumption, economic growth, financial development, industrialization, and urbanization in Senegal. Energy Sources Part B: Econ Planning Policy 12(1):77–84
Asumadu-Sarkodie S, Owusu PA (2017b) The causal effect of carbon dioxide emissions, electricity consumption, economic growth, and industrialization in Sierra Leone. Energy Sources Part B: Econ Planning Policy 12(1):32–39
Azam M, Khan AQ, Abdullah HB, Qureshi ME (2016) The impact of CO 2 emissions on economic growth: evidence from selected higher CO 2 emissions economies. Environ Sci Pollut Res 23(7):6376–6389
Balsalobre-Lorente D, Shahbaz M, Roubaud D, Farhani S (2018) How economic growth, renewable electricity and natural resources contribute to CO2 emissions?. Energy Policy, 113, 356–367
Bhat JA (2018) Renewable and non-renewable energy consumption—impact on economic growth and CO 2 emissions in five emerging market economies. Environ Sci Pollut Res 25(35):35515–35530
Brown RL, Durbin J, Evans JM (1975) Techniques for testing the constancy of regression relationships over time. J R Stat Soc Ser B Methodol 37(2):149–163.
Chaudhry AA (2010) A panel data analysis of electricity demand in Pakistan
Destek MA (2017) Biomass energy consumption and economic growth: evidence from top 10 biomass consumer countries. Energy Sources Part B: Econ Planning Policy:1–6
Dickey, D.A, Fuller, W.A (1979) Distribution of the estimators for autoregressive time series with a unit root. Journal of the American statistical 10.1186/s40854-019-0162-0 association, 74(366a), 427–431
Dogan E, Seker F (2016) The influence of real output, renewable and non-renewable energy, trade and financial
development on carbon emissions in the top renewable energy countries. Renewable and Sustainable Energy Reviews, 60, 1074–1085
Fan F, Lei Y (2017) The responsive relationship between energy-related carbon dioxide emissions from the transportation sector and economic growth in Beijing—based on decoupling theory. Int J Sustainable Transport 11(10):764–775 Hanif I (2018) Impact of economic growth, nonrenewable and renewable energy consumption, and urbanization on carbon
emissions in sub-Saharan Africa. Environ Sci Pollut Res 25(15):15057–15067
Inglesi-Lotz R, Dogan E (2018) The role of renewable versus non-renewable energy to the level of CO2 emissions a panel analysis of sub-Saharan Africa’sΒig 10 electricity generators. Renew Energy 123:36–43
Işik C, KasımatıE, Ongan S (2017) Analyzing the causalities between economic growth, financial development, international trade, tourism expenditure and/on the CO2 emissions in Greece. Energy Sources Part B: Econ Planning Policy 12(7):665– 673
Işık C, Ongan S, Özdemir D. (2019). Testing the EKC hypothesis for ten US states: an application of heterogeneous panel estimation method. Environmental Science and Pollution Research 26(11) 10846–10853
Jebli MB, Youssef SB (2015a) Economic growth, combustible renewables, and waste consumption, and CO2 emissions in North Africa. Environ Sci Pollut Res 22(20):16022–16030
Jebli MB, Youssef SB (2015b) The environmental Kuznets curve, economic growth, renewable and non-renewable energy, and trade in Tunisia. Renew Sust Energ Rev 47:173–185
Jebli M.B, Youssef S.B, Ozturk I (2016) Testing environmental Kuznets curve hypothesis: The role of renewable and non-renewable energy consumption and trade in OECD countries. Ecological Indicators, 60, 824–831
Kasman A, Duman Y.S (2015) CO2 emissions, economic growth, energy consumption, trade and urbanization in new EU member and candidate countries: a panel data analysis. Economic Modelling, 44, 97–103
Khan M.K, Teng J.Z, Khan M.I, Khan M.O (2019a) Impact of globalization, economic factors and energy consumption on CO2 emissions in Pakistan. Science of the total environment, 688, 424–436
Khan M.K, Teng J.Z, Khan M.I (2019b) Effect of energy consumption and economic growth on carbon dioxide emissions in Pakistan with dynamic ARDL simulations approach. Environmental Science and Pollution Research, 1–11
Menyah K, Wolde-Rufael Y (2010) Energy consumption, pollutant emissions and economic growth in South Africa. Energy economics, 32(6), 1374–1382
Narayan P.K (2005) The saving and investment nexus for China: evidence from cointegration tests. Applied economics, 37(17), 1979–1990. Phillips, P. C., & Perron, P. (1988). Testing for a unit root in time series regression. Biometrika, 75(2), 335–346 Pao HT, Tsai CM (2010) CO 2 emissions, energy consumption and economic growth in BRIC countries. Energy Policy 38(12):
7850–7860
Pesaran MH, Shin Y, Smith RJ (2001) Bounds testing approaches to the analysis of level relationships. J Appl Econ 16(3):289–326 Phillips P.C, Perron P (1988) Testing for a unit root in time series regression. Biometrika, 75(2), 335–346
Saboori B, Rasoulinezhad E, Sung J (2017) The nexus of oil consumption, CO 2 emissions and economic growth in China, Japan and South Korea. Environ Sci Pollut Res 24(8):7436–7455
Shahbaz M, Solarin S.A, Mahmood H, Arouri M (2013) Does financial development reduce CO2 emissions in Malaysian economy? A time series analysis. Economic Modelling, 35, 145–152
Shahbaz M, Uddin G.S, Rehman I.U, Imran K (2014) Industrialization, electricity consumption and CO2 emissions in Bangladesh. Renewable and Sustainable Energy Reviews, 31, 575–586
Siddiqui R (2004) Energy and economic growth in Pakistan. Pak Dev Rev 175–200
Sinha A, Shahbaz M (2018) Estimation of environmental Kuznets curve for CO2 emission: role of renewable energy generation in India. Renew Energy 119:703–711
Sulaiman C, Abdul-Rahim AS (2017) The relationship between CO 2 emission, energy consumption and economic growth in Malaysia: a three-way linkage approach. Environ Sci Pollut Res 24(32):25204–25220
Tamba JG, Nsouandélé JL, Lélé AF (2017) Gasoline consumption and economic growth: evidence from Cameroon. Energy Sources Part B: Econ Planning Policy 12(8):685–691
Yang L, Li Z (2017) Technology advance and the carbon dioxide emission in China–Empirical research based on the rebound effect. Energy Policy 101:150–161
Zoundi Z (2017) CO2 emissions, renewable energy and the environmental Kuznets curve, a panel cointegration approach. Renew Sust Energ Rev 72:1067–1075
Publisher’s Note