R E S E A R C H
Open Access
Development of methods to objectively identify
time spent using active and motorised modes of
travel to work: how do self-reported measures
compare?
Jenna Panter
1,2*, Silvia Costa
1,2, Alice Dalton
2,3, Andy Jones
2,3and David Ogilvie
1,2Abstract
Background:Active commuting may make an important contribution to population health. Accurate measures of these behaviours are required, but it is unknown how self-reported estimates compare to those derived from objective measures. We sought to develop methods for objectively deriving time spent in specific travel behaviours from a combination of locational and activity data, and to assess the convergent validity of two self-reported estimates. Methods:In 2010 and 2011, a sub-sample of participants from the Commuting and Health in Cambridge study concurrently completed objective monitoring using combined heart rate and movement sensors and global positioning system devices and reported their past-week commuting in a questionnaire (modes used, and usual time spent walking and cycling per trip) and in a day-by-day diary (all modes and durations). Automated and manual approaches were used to objectively identify total time spent using active and motorised modes. Agreement between self-reported and objectively-derived times was assessed using Lin’s concordance coefficients, Bland-Altman plots and signed-rank tests. Results:Compared to objective assessments, day-by-day diary estimates of time spent using active modes on the commute were overestimated by a mean of 1.1 minutes/trip (95% limits of agreement (LOA):−7.7 to 9.9, p < 0.001). The magnitude of overestimation was slightly larger, but not significant (p = 0.247), when walking or cycling was used alone (mean: 2.4 minutes/trip, 95% LOA:−6.8 to 11.5). Total time spent on the commute was overestimated by a mean of 1.9 minutes/trip (95% LOA:−15.3 to 19.0, p < 0.001). The mean differences between self-reported usual time and objective estimates were−1.1 minutes/trip (95% LOA:−8.7 to 6.4) for cycling and +2.4 minutes/trip (95% LOA:−10.9 to 15.7) for walking. Mean differences between usual and daily estimates of time were <1 minute/trip for both walking and cycling.
Conclusions:We developed a novel method of combining objective data to identify time spent using active and motorised modes, and total time spent commuting. Compared to objectively-derived times, self-reported times spent active commuting were slightly overestimated with wide LOA, suggesting that they should be used with caution to infer aggregate weekly quantities of activity on the commute at the individual level.
Keywords:Physical activity, Heart rate monitoring, GPS, Convergent validity, Walking, Cycling, Transport
* Correspondence:[email protected]
1MRC Epidemiology Unit, School of Clinical Medicine, University of Cambridge, Box 285, Cambridge Biomedical Campus, Cambridge CB2 0QQ, UK
2
UKCRC Centre for Diet and Activity Research (CEDAR), School of Clinical Medicine, University of Cambridge, Cambridge, UK
Full list of author information is available at the end of the article
Introduction
The concept of ‘active living’ incorporates activities
across the recreational, household, transport and occu-pational domains [1]. As a result, interventions to pro-mote more active lifestyles increasingly target activities performed in the course of everyday life, such as walking and cycling for transport. Accurate measurement of these activities in free-living conditions is important for understanding the descriptive epidemiology and deter-minants of target behaviours and behaviour change; for the evaluation of interventions; and for the attribution of subsequent health impacts.
Self-reported measures of activity can capture infor-mation on the types and contexts of behaviours, whereas objective measures can provide more accurate estimates of the intensity, frequency and duration of physical activ-ity. Self-reported measures are often used in large studies because they may impose a lower burden on participants, are easier to administer en masse and are relatively in-expensive compared to many objective measures [2]. However, a recent review of 187 studies concluded that self-reported estimates of total physical activity generally have low correlations with those derived from objective measures [3]. Importantly, such self-report instruments tend to perform particularly poorly for activities in the transport domain [3-5]. One possible reason is that rela-tively simple questions are often used to assess these activ-ities, such as asking for the usual main mode of travel to work. These fail to capture the frequency or duration of particular behaviours, which are more often asked about in relation to recreational activities. They also fail to capture day-to-day or week-to-week variation and other aspects of the complexity of travel behaviour. Whilst com-muting may be habitual for many people, the total time spent walking or cycling may vary from week to week [6] and it can be difficult to disaggregate commuting from other activities with which it is often combined, such as shopping or escorting children to school [7]. Furthermore, some people use public transport, which often involves a small amount of walking and cycling [8], whilst others walk or cycle sections of a longer car journey to avoid driving in congested urban centres [9]. These combina-tions of active and sedentary behaviours are often not captured in simple travel behaviour questions such as those typically included in global activity questionnaires, and the quantities of physical activity associated with journeys of this kind are poorly understood [10].
As interest grows in the interface between transport and public health, researchers need valid measures of transport-related physical activity that are sensitive enough to capture the variation and complexity of travel behaviour but are also simple enough to be administered as part of longer questionnaires. However, at the time of first data collection in this study (in 2009) there were no short
self-report measures of time spent walking or cycling for transport validated in free-living populations [10], and only limited validation of detailed day-by-day travel diaries had been reported [11]. In validating self-report measures in this field, the selection of a gold standard method is challenging as direct observation is often impractical. Whilst wearable cameras have been shown to be a feasible method of collecting data on mode of travel in a small convenience sample [12], it is unknown whether members of a larger, more representative popu-lation sample would consent to wearing such devices, particularly given some of the privacy-related concerns [13]. The analysis of objective physical activity data
alone – even using data from multiple monitoring
de-vices – is not sufficiently advanced to enable the time
spent in different types of activities to be confidently identified [14]. On the other hand, global positioning
system (GPS) devices – which are increasingly being
used in research [15]–allow the objective identification
of locations and journeys and therefore the computation of journey times, but provide no measure of activity or intensity other than the speed at which the wearer has moved in a given time period. Whilst several studies of travel behaviour have used GPS data, papers often re-port little information about the processing and clean-ing of the data, which is essential information if studies are to be replicated. A recent systematic review compar-ing self-reported and GPS-measured journey duration found that self-reported journey times tended to be greater than those derived from GPS data, with a mean difference of 3.2 minutes/trip compared with a mean trip duration of 17.9 minutes [11]. However, this difference is not necessarily due only to error in the self-reported journey times, because the collection and interpretation of GPS data remain subject to a number of limitations including signal dropout in urban areas and potential misclassification of modes of travel [16].
methods for deriving time spent in specific travel behav-iours from a combination of data sources, and to compare these objective estimates with those derived from various self-report instruments in order to clarify the strengths and limitations of detailed objective measures as well as simple and more detailed self-report instruments.
In this paper, we use data collected as part of the Commuting and Health in Cambridge study [22]: first, to develop a method for identifying time spent using active and motorised modes of transport for commuting, and total commuting travel time, from combined heart rate and movement sensors and GPS devices; and sec-ond, to compare objective and self-reported estimates of active, motorised and total commuting travel time. Spe-cifically, we aimed to answer three research questions:
(1)How do estimates of time spent using active and motorised modes for commuting, and total commuting travel time, from a detailed seven-day diary compare to those derived from objective assessment?
(2)How do questionnaire estimates of usual time spent using active modes on the commute compare to those derived from objective assessment?
(3)How do questionnaire estimates of usual time spent using active modes on the commute compare to those derived from a detailed seven-day travel diary?
Methods
Study setting and recruitment
The Commuting and Health in Cambridgestudy proto-col and recruitment have been reported elsewhere [22-24]. Adults aged 16 years or older were eligible to take part in the study if they lived within 30 km of the city centre and travelled to work in Cambridge, UK. Par-ticipants were recruited in 2009 predominantly through workplaces via emails, recruitment stands and advertise-ments. Participants were recruited from a range of types of workplace within Cambridge, including local author-ities, healthcare providers and retail outlets as well as institutions of higher and further education, and there was heterogeneity in their geographical settings which spanned city centre and urban fringe locations. Ethical approval was obtained from the Hertfordshire Research Ethics Committee (reference numbers 09/H0311/116 and 10/H0311/65) and written informed consent was provided by each participant.
Data collection procedures
Between May and October 2009, 1164 participants com-pleted a questionnaire to assess their physical activity, travel behaviours and personal characteristics, and a sub-sample of 475 participants who expressed a willing-ness to do so also wore accelerometers for seven days
[23,25,26]. As the number of willing participants exceeded the number of monitors available, monitors were sent to a random sample of willing participants in batches as described in a previous paper [19]. In 2010 and 2011, the sub-sample who had completed a questionnaire and pro-vided valid accelerometer data in 2009 were invited to wear a combined heart rate and movement sensor and a GPS device, and to complete a questionnaire and a de-tailed travel diary. Participants attended one-to-one appointments with a research assistant, at either the
research institute or the participant’s workplace, during
which the research assistant took consent and fitted the devices. Participants were instructed to wear both de-vices simultaneously, to complete the travel diary at the end of each day, and to complete the questionnaire at the end of the seven-day measurement period. They returned all questionnaires and devices to the research institute by post.
Objective measures
Participants undertook seven consecutive days of moni-toring and wore combined heart rate and movement sensors and GPS devices. The Actiheart combined sen-sor (AccHR) is a lightweight waterproof device that clips onto two standard electrocardiogram electrodes on the chest and collects data in either 60-second epochs (using Actiheart devices in 2010) or 15-second epochs (using Actiheart 4 devices in 2011). Monitors provide no feed-back to participants, are waterproof and do not need to be removed for showering, swimming or any other rea-son except to change electrodes if necessary. The AccHR has been shown to be a valid and reliable tool for meas-uring both acceleration and heart rate and offers a more accurate assessment of physical activity energy expend-iture (PAEE) than accelerometry alone [21]. A simple calibration protocol based on sleeping heart rate and gender has been shown to be adequate for free-living studies [27].
A range of devices is available for collecting loca-tional data including data loggers without displays, GPS watches and mobile phones [16]. We used the QStarz BT1000X receiver, a small, portable data logging device without a display which has been used in previous studies [28,29]. The receiver records the spatial coordi-nates of participants at five-second intervals. As the device is lightweight and small, it was worn on an elastic belt on the waist during waking hours and participants were provided with a charger and asked to recharge the battery each night.
Questionnaire and travel diary
adapted from one previously shown to have acceptable test-retest reliability [30]. Participants were also asked if they ever cycled part or all of the way to work (yes or
no) and if they responded‘yes’, were then asked to
re-port the typical duration of the cycling stage of the jour-ney (in minutes). These questions were repeated for walking (Additional file 1). Participants concurrently completed a seven-day travel diary booklet closely based on that used in the UK National Travel Survey [31]. At the end of each day participants recorded the start and end time of each trip and the mode, distance and dur-ation of all the stages of each journey they had made (Additional file 2). Participants also reported all the demographic and socio-economic information shown in Table 1.
Data processing Objective data
To objectively identify time spent using active and motorised modes, and total commuting travel time, it was necessary to process the objective data to identify trips (or stages within trips). The manual processing and cleaning of trip-level data is a labour-intensive process, and web-based services to identify trips automatically from GPS data are in their infancy [32]. As a result, we quasi-randomly selected a purposive quota sample for analysis from the 182 participants who provided object-ive data and information on commuting in the travel diary and questionnaire in 2010 or 2011. This quasi-random quota sampling was designed to achieve at least 50 journeys for each of the six most commonly reported trip patterns in the sample: walking, cycling, car or motor-cycle only, car in combination with walking, car in com-bination with cycling, and bus with or without walking or cycling. Relatively few participants reported walking all the way to or from work in the sample. This reflected our recruitment strategy for the wider study, which focussed on commuters who did not live in the same immediate area of the city as their workplace, and the relative prevalences of walking and cycling in Cambridge more generally. As a result we were unable to obtain 50 trips made by walking alone. Participants were selected for analysis if their GPS data contained at least two trips on at least one day. GPS trips were only included if they
represented ‘usual’ commuting trips (i.e. between their
usual home and usual work locations) and could be matched to a synchronous travel diary record on at least three days. GPS and AccHR data were summarised in one-minute epochs for the purposes of processing. Figure 1 illustrates the selection of participants for analysis.
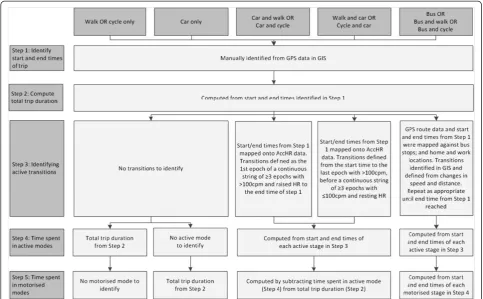
The approach to identifying time spent using active and motorised modes, and total commuting travel time at the trip level, was tailored according to the modes of travel reported in the travel diary for that trip. Manual
procedures were used in steps 1–2 and automatic
proce-dures were used in steps 2–5. The process is described
in detail below and summarised in Figure 2.
Step 1: Identifying the start and end times of trips
GPS data were visually inspected in the geographic information system (GIS) software package ArcGIS to identify the start and end times for each trip to and from work. Home and work locations were identified from the questionnaire and mapped using GIS and routes were overlaid with background mapping. The start time was defined as the first epoch after which participants left either the home or work location, and the end time was defined as the last epoch before the participant reached the building outline representing their work-place or home respectively.
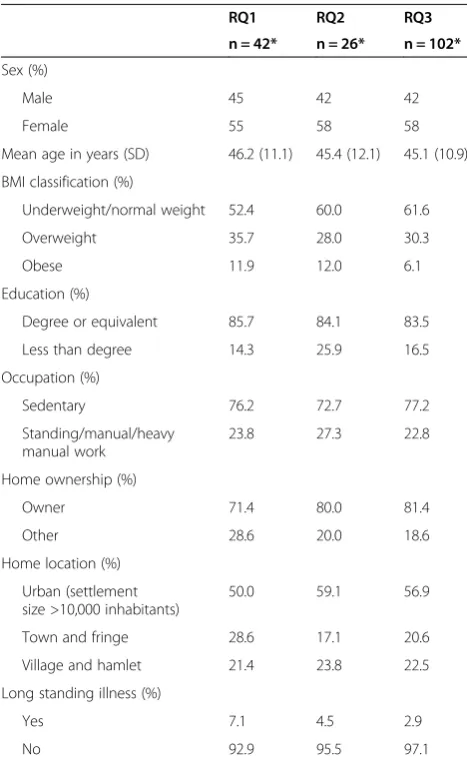
Table 1 Participants included for each research question
RQ1 RQ2 RQ3
n = 42* n = 26* n = 102*
Sex (%)
Male 45 42 42
Female 55 58 58
Mean age in years (SD) 46.2 (11.1) 45.4 (12.1) 45.1 (10.9)
BMI classification (%)
Underweight/normal weight 52.4 60.0 61.6
Overweight 35.7 28.0 30.3
Obese 11.9 12.0 6.1
Education (%)
Degree or equivalent 85.7 84.1 83.5
Less than degree 14.3 25.9 16.5
Occupation (%)
Sedentary 76.2 72.7 77.2
Standing/manual/heavy manual work
23.8 27.3 22.8
Home ownership (%)
Owner 71.4 80.0 81.4
Other 28.6 20.0 18.6
Home location (%)
Urban (settlement size >10,000 inhabitants)
50.0 59.1 56.9
Town and fringe 28.6 17.1 20.6
Village and hamlet 21.4 23.8 22.5
Long standing illness (%)
Yes 7.1 4.5 2.9
No 92.9 95.5 97.1
RQ: Research Question. Some small categories have been combined. For example, few participants were classified as underweight, and these were therefore grouped with those of normal weight.
Step 2: Computing total trip duration
Total trip duration was computed by subtracting the end time from the start time identified in step 1.
Step 3: Identifying modal transitions and destinations en route For trips made using combinations of modes, it was necessary to identify transitions between active and motorised transport modes. As the range of intensities of activity for walking and cycling in free-living condi-tions is poorly understood [10], times spent in active stages of a trip were identified using GPS data with or without AccHR data as follows. For trips involving walk-ing and cyclwalk-ing in combination with car travel, inspec-tion of the AccHR data annotated with the trip start and end times from GPS indicated that the start of the active stage could be consistently defined as the first one-minute epoch of a continuous string of three or more epochs with >100 counts per minute (cpm) and a heart rate increasing at a rate of at least 10 beats per minute (bpm) per min (for example 80 to 90 to 100 bpm over three epochs). The end of the active stage was defined as the last one-minute epoch with >100 cpm before a
con-tinuous string of ≥3 epochs with <100 cpm and a heart
rate decreasing at a rate of at least 10 bpm per minute
(for example 100 to 90 to 80 bpm). The 100 cpm
cut-point corresponds to around 0.3 m/s2 acceleration and
was chosen to discriminate non-walking from walking as it is one-third of the trunk acceleration associated with walking at 3 km/hr [27].
Initial inspection of the AccHR data indicated that distinguishing walking or cycling stages from bus travel within a public transport journey was difficult because there were no clear delineations in activity and heart rate, hence GPS data were mapped against public trans-port interchange locations to identify start and end times for each stage of a bus journey. For example, a bus jour-ney from home to work was split into at least three stages: (1) from home to the bus stop, (2) the bus jour-ney to the final bus stop, and (3) from the final bus stop to work, with the start and end times for each stage be-ing visually identified from changes in the speed of travel and distance between GPS points. Waiting times at bus stops before or after boarding were identified by GPS points with non-regular speeds in close geographical proximity, and were excluded.
As not all trips were made directly between the home and work locations, we also identified whether the par-ticipant travelled to or from work via an additional
location such as a school or shop (visible on background mapping) and remained there for more than five mi-nutes without a reported change in mode. Modal transi-tions and destinatransi-tions en route were only identified where GPS or AccHR data were of good quality and where plausible heart rate values were recorded. Where data were of insufficient quality to allow modal transi-tions and destinatransi-tions en route to be confidently identi-fied, trips were included only in the analysis of total trip duration (step 2) and excluded from the analyses of time spent using active or motorised modes (steps 4 and 5).
Step 4: Computing time spent using active modes
When walking or cycling was the only reported mode used on a trip, the time spent using that mode was equal to the total trip duration in step 2. When walking or cyc-ling were used in combination with the car on a trip, the duration of the active stage(s) was computed either from the start time identified in step 3 to the GPS-derived end time (if the car was the first mode reported on the trip) or from the GPS-derived start time to the end time identified in step 3 (if walking or cycling was the first mode reported on the trip). For bus trips, the duration of each active stage of a trip was computed from the start and end times derived in step 3; in the case of
multiple active stages, these were summed to produce the total active time per trip used in the analysis.
Step 5: Computing time spent using motorised modes For bus journeys, the time spent using a motorised mode was defined using the start and end times of the bus stage identified from GPS data. When trips were re-ported as car-only, the total trip duration was used to define the time spent using a motorised mode. When walking or cycling were reported in combination with the car on a trip, the time spent travelling by car was calculated by subtracting the duration of the active stage(s) from the total trip duration.
Self-reported data
No further processing of the questionnaire data was re-quired. For the travel diary data, the start and end times of each trip were used to compute the total trip duration and time spent in active and motorised modes were re-trieved from the respective stages unless a commuting trip included a stop at a location between home and work, in which case the reported durations of each mov-ing stage of the trip were summed to provide the total trip duration.
Inclusion criteria
A summary of the inclusion criteria is shown in Figure 1. For research questions 1 and 2 participants with proc-essed GPS data and synchronous travel diary data were included. For the analysis of time spent using active and motorised modes in research question 1, participants were included if they reported times using active or motorised modes. For research questions 2 and 3, partic-ipants were included only if they walked or cycled on the commute, reported a usual time in the question-naire, and reported at least two trips involving walking or cycling in the travel diary (as it was not possible to compute mean time walking/cycling with fewer than two trips). Participants could report a usual time for both walking and cycling if they did both, and could therefore contribute to both the walking and cycling analyses. For research question 3, the availability of fully-processed GPS data was not a criterion for inclusion.
Statistical analysis
Analyses were conducted using Stata (v.11) and SPSS (v.21) statistical software packages. Participant character-istics were summarised using means and percentages and duration and distance of trips from GPS were sum-marised using medians and inter-quartile ranges (IQR). All continuous variables were tested for normality using the Shapiro-Wilk test.
For the comparison between the detailed travel diary and objective estimates (research question 1), we speci-fied our analysis at the trip level, because participants re-ported the time spent using each mode on each trip. As trips were clustered within participants, we tested for
differences using the Newson’s within-cluster Somer’s D
test [33]. A small amount of walking or cycling is often involved to get to or from the bus stop at the origin and destination, but 10 participants reported only the bus stages and failed to report their access and egress modes; their time spent walking and cycling on these trips was set to zero to reflect their reporting. For the comparison between the usual time spent walking or cycling per trip and the objective estimates (research question 2) and the mean time spent walking and cycling reported in the diary (research question 3), we specified our analysis at the participant level. Differences were tested with an adapted paired-sample Wilcoxon signed-rank test since the data were non-normally distributed.
We assessed the agreement between estimates of time
using Lin’s concordance coefficient [34,35], McBride’s
criteria for strength of agreement [36] and
Bland-Altman plots [37]. For McBride’s criteria, concordance
coefficients of <0.9 are regarded as poor, 0.90-0.95 are mod-erate and 0.95 to 0.99 are substantial. Post-hoc Bonferroni corrections were applied taking the multiple comparisons into account.
We hypothesised that the agreement between self-reported and objective times may differ according to whether trips were direct or indirect (via an intermediate destination), and whether they involved single modes or combinations of modes, because of the difficulties in re-cording times spent at intermediate destinations, waiting for public transport or in transitions between modes. We therefore stratified our analyses according to these subgroups where data were available and sample sizes were sufficient.
Results
The sociodemographic characteristics of participants are shown in Table 1 and an overview of the sample in-cluded in each analysis is shown in Figure 1.
Processing of GPS data
Of the 424 potential trips, 344 were complete usual commuting trips with at least three trips per participant, and of these, 204 trips (made by 42 participants who had provided matching diary data for at least three days and had reported a median of five trips/week (inter-quartile range: 3 to 7)) provided the necessary variation in travel modes and formed the dataset of GPS trips for further analysis (Figure 1).
Research question 1: Comparison between objective and travel diary estimates
Total time spent using active and motorised modes on the commute
For the comparison of active travel time, 151 trips were made by active modes (or included active stages) and 136 had good quality AccHR and/or GPS data in which only one mode was used or modal transitions could be identified (Figure 1). For the comparison of motorised travel time, 155 trips were made by motorised modes (or included motorised stages) and of these, 139 had good quality AccHR and/or GPS data in which only one mode was used or modal transitions could be identified.
Time spent using active modes on the commute was overestimated in the travel diary by a mean of
1.13 minutes/trip (95% limits of agreement (LOA): −7.67
to 9.95, p = 0.001; Table 2), compared with a median total journey time of 38 minutes. The magnitude of overesti-mation of active travel time was slightly larger when walk-ing or cyclwalk-ing was used alone (mean: 2.39 minutes/trip,
95% LOA:−6.78 to 11.55, compared with a median
jour-ney time of 17 minutes), but there was no significant dif-ference between self-reported and objective estimates in
this subset of trips (p= 0.247). Agreement for time spent
between estimates of active travel time was smaller (+0.40 minute/trip) but this difference remained signifi-cant (p = 0.001). Time spent using motorised modes was subject to larger overestimation than active travel time, with a mean overestimation of 10.48 minutes/trip (95%
LOA: −13.62 to 34.58) compared with a median total
journey time of 40 minutes. This appeared to be largely explained by trips involving motorised modes in combin-ation with active modes (mean difference: 14.49 minutes/
trip, 95% LOA:−8.86 to 37.84, compared with a median
total journey time of 45 minutes.
Total time spent on the commute
Total travel time was overestimated in the travel diary by a mean of 1.85 minutes/trip (p < 0.001) with wide
limits of agreement (95% LOA:−15.31 to 19.01; Table 2).
We saw no increase in the difference between the two measures as journey duration increased (Figure 3). Agreement was closer for single-mode journeys than for those involving a combination of modes (1.40 versus
2.21 minutes/trip overestimation), although the difference between self-reported and objective estimates was
signifi-cant in both trip categories (p< 0.001). The overestimation
was also smaller for direct trips (1.74 minutes/trip, n = 175) than for indirect trips (2.50 minutes/trip, n = 29).
Research question 2: Comparison between questionnaire and objective estimates
Of the 42 participants, 11 and 16 met the inclusion cri-teria for the walking and cycling analyses respectively (in that they had recorded at least two walking or cycling trips from which a mean could be computed and had reported a usual time spent walking or cycling) and provided syn-chronous GPS and AccHR data. For participants reporting combinations of active and motorised modes, good quality AccHR data were also required (Figure 1).
The mean difference between the participants’reported
usual time and the mean time derived from the objective measures was smaller, and the 95% LOA were narrower,
for cycling (mean:−1.12 minutes/trip, 95% LOA:−8.67 to
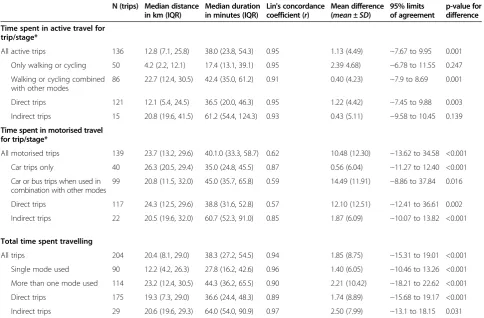
Table 2 Agreement between travel diary and objective estimates of time spent using active and motorised modes and total time spent travelling
N (trips) Median distance in km (IQR)
Median duration in minutes (IQR)
Lin's concordance coefficient (r)
Mean difference (mean ± SD)
95% limits of agreement
p-value for difference
Time spent in active travel for trip/stage*
All active trips 136 12.8 (7.1, 25.8) 38.0 (23.8, 54.3) 0.95 1.13 (4.49) −7.67 to 9.95 0.001
Only walking or cycling 50 4.2 (2.2, 12.1) 17.4 (13.1, 39.1) 0.95 2.39 4.68) −6.78 to 11.55 0.247
Walking or cycling combined with other modes
86 22.7 (12.4, 30.5) 42.4 (35.0, 61.2) 0.91 0.40 (4.23) −7.9 to 8.69 0.001
Direct trips 121 12.1 (5.4, 24.5) 36.5 (20.0, 46.3) 0.95 1.22 (4.42) −7.45 to 9.88 0.003
Indirect trips 15 20.8 (19.6, 41.5) 61.2 (54.4, 124.3) 0.93 0.43 (5.11) −9.58 to 10.45 0.139
Time spent in motorised travel for trip/stage*
All motorised trips 139 23.7 (13.2, 29.6) 40.1.0 (33.3, 58.7) 0.62 10.48 (12.30) −13.62 to 34.58 <0.001
Car trips only 40 26.3 (20.5, 29.4) 35.0 (24.8, 45.5) 0.87 0.56 (6.04) −11.27 to 12.40 <0.001
Car or bus trips when used in combination with other modes
99 20.8 (11.5, 32.0) 45.0 (35.7, 65.8) 0.59 14.49 (11.91) −8.86 to 37.84 0.016
Direct trips 117 24.3 (12.5, 29.6) 38.8 (31.6, 52.8) 0.57 12.10 (12.51) −12.41 to 36.61 0.002
Indirect trips 22 20.5 (19.6, 32.0) 60.7 (52.3, 91.0) 0.85 1.87 (6.09) −10.07 to 13.82 <0.001
Total time spent travelling
All trips 204 20.4 (8.1, 29.0) 38.3 (27.2, 54.5) 0.94 1.85 (8.75) −15.31 to 19.01 <0.001
Single mode used 90 12.2 (4.2, 26.3) 27.8 (16.2, 42.6) 0.96 1.40 (6.05) −10.46 to 13.26 <0.001
More than one mode used 114 23.2 (12.4, 30.5) 44.3 (36.2, 65.5) 0.90 2.21 (10.42) −18.21 to 22.62 <0.001
Direct trips 175 19.3 (7.3, 29.0) 36.6 (24.4, 48.3) 0.89 1.74 (8.89) −15.68 to 19.17 <0.001
Indirect trips 29 20.6 (19.6, 29.3) 64.0 (54.0, 90.9) 0.97 2.50 (7.99) −13.1 to 18.15 0.031
*Where only one mode is used, this represents the time for the trip; where a combination of modes is used, this represents the time for the active or motorised stage(s) of the trip. Distances and durations given are derived from objective estimates. IQR: inter-quartile range.
6.44,n= 11, compared with a median reported usual time of 17 minutes) than for walking (mean: 2.37 minutes/trip,
95% LOA: −10.91 to 15.64, compared with a median
re-ported usual time of 13 minutes); neither difference was statistically significant (Figure 4 and Additional file 3). The questionnaire and objective measures showed substantial agreement for time spent cycling (concordance coefficient = 0.96) but poorer agreement for time spent walking (concord-ance coefficient = 0.84).
Research question 3: Comparison between questionnaire and travel diary estimates
As fully-processed objective data were not required for these comparisons, the sample was drawn from the lar-ger pool of 182 participants. Of these, 102 had synchron-ous questionnaire and travel diary data, reported a usual time spent walking or cycling on the commute in the questionnaire, and recorded two or more trips involving walking or cycling in the travel diary. This resulted in 36 participants for the walking analysis and 78 participants for the cycling analysis (Figure 1).
The questionnaire estimates of usual time spent either walking or cycling were not significantly different from the mean duration derived from the trips reported in the
travel diary (p> 0.1) and showed moderate agreement
(concordance coefficients ranged from 0.92 to 0.93), with an average difference of less than one minute for both cycling and walking (Figure 5). The overestimation was slightly higher when walking was the only mode
used on the trip (mean: 2.00 minutes/trip, 95% LOA:−8.65
to 12.65, compared with a median reported usual time of 20 minutes; Figure 5 and Additional file 4). Performing the same analysis excluding indirect trips did not alter the results significantly.
Discussion Principal findings
In this paper we have demonstrated a method for object-ively defining the time spent using active and motorised modes of transport (either alone or in combination) on the journey to work in a free-living sample using a com-bination of AccHR and GPS data. This was achieved by a combination of automated and manual methods and, as far as we are aware, has not previously been reported. When we compared these estimates to those derived from self-report instruments, we found the results were broadly comparable in that the mean differences in total and active travel time were relatively small, both for de-tailed travel diaries (around a one-minute overestimation per trip) and for retrospective questionnaires (around a one-minute underestimation for cycling and a two-minute overestimation for walking). Although these mean differ-ences were small, self-reported measures should never-theless be used with caution to infer aggregate weekly quantities of activity on the commute because, for ex-ample, a two-minute overestimation per trip corresponds to a 20-minute difference over a five-day working week. Self-reported time spent using motorised modes of
p<0.001
-60
-40
-20
0
20
40
0 20 40 60 80 100 120 140 160
Mean of self-report and objective (in minutes)
Self-report minus objective (in minutes)
transport showed poor agreement with objective esti-mates; this was mostly explained by journeys involving combinations of modes, particularly bus journeys. There were no significant differences between the usual and day-by-day estimates of time spent walking or cycling derived from the shorter questionnaire and the more detailed travel diary respectively.
Strengths and limitations
A key strength of this study was the development of a novel method of combining detailed spatial and activity data to objectively identify the time spent using active and motorised modes and total time spent commuting. Combined heart rate and movement sensors provided more accurate estimation of activity than hip-worn
p=0.091
-10
0
10
20
0 10 20 30 40 50
Mean of self-report and objective (in minutes)
Walking
p=0.180
-10
0
10
20
0 10 20 30 40 50
Mean of self-report and objective (in minutes)
Cycling
Self-report minus objective (in minutes)
Self-report minus objective (in minutes)
accelerometers which are more often used. Our analyses of the convergent validity of objective and self-reported estimates of time investigated the differences between these measures in free-living conditions, and how these varied according to whether active or motorised modes of transport were used or combinations of modes were used, for example in public transport journeys.
We could have inferred travel mode using only the aver-age and maximum speeds recorded on the trip, as other authors have done. However, those authors reported that this correctly identified travel mode in only 70% of cases [38]. In our sample, the risk of misclassification may have been higher as many participants travelled into city centre locations where average speeds could be relatively low,
-10
0
10
20
0 10 20 30 40 50 60
Mean of self-report and objective (in minutes)
Cycling
-10
0
10
20
0 10 20 30 40 50 60
Mean of self-report and objective (in minutes)
Walking
Self-report minus objective (in minutes)
Self-report minus objective (in minutes)
and used a combination of modes which would not have been identified. We therefore used the travel modes re-ported by the participants.
Our rules for processing the measurement data were newly developed for this study and remain untested in other samples. One implication of this is that the differ-ences we observed are not necessarily wholly attribut-able to self-report measurement error. For example, while we collected data in one-minute epochs in 2010, in 2011 we were able to collect data in 15-second epochs as a result of technological advances. In order to com-bine data between waves, however, we had to summarise all the data at the one-minute level for the purposes of this analysis, and this may have contributed to the small apparent overestimation in the self-reported measures. A more general implication is that although our analysis used data from a relatively large and heterogeneous val-idation sample (the largest comparison containing 204 trips), our methods and findings should be replicated in larger samples. This is particularly so for the comparison of self-reported usual times with objective estimates, which was conducted at the participant level: the conse-quent reduction in sample size may have resulted in a lack of power to detect associations. We have sought to document our methods as clearly as possible, in the hope that other researchers will test, adapt and refine these methods in future research.
Our sample contained a large proportion (85%) of par-ticipants educated to degree level and a smaller propor-tion of obese adults than the general populapropor-tion of Cambridgeshire, no doubt reflecting the focus of the overall study on the predominantly healthy working adult popula-tion. A degree of volunteer bias is somewhat inevitable in measurement studies of this kind and it is questionable whether members of a larger, more representative popula-tion sample would be equally willing to wear multiple devices and complete multiple self-report instruments, al-though this possibility could be investigated in future work. We had only a few participants who reported walking all the way to work, and whilst this reflects the recruitment strategy of the overall study and local travel patterns, our smaller sample size for the analyses of time spent walking means that we can be less confident about these results than about those for the other modes of transport.
Comparison with other studies
The magnitude of the overestimation of self-reported journey times in this study was comparable to that re-ported in a recent systematic review of the difference be-tween GPS-derived and self-reported journey times, in which the pooled mean difference was 3.2 minutes or 20.3% of mean total journey time [11]. A recent study comparing self-reported journey times with those esti-mated using wearable cameras found that total journey
time for a range of journey purposes was overestimated by around two minutes on average, with 95% limits of
agreement from −9 to +13 minutes [12]. In contrast to
that study, when we compared diary-based with objective estimates we did not observe an increase in the difference between the two measures as journey duration increased, suggesting that the difference was not dependent on jour-ney length. We cannot confidently exclude the possibility of such bias with respect to self-reported estimates of usual times, because the smaller sample size for that ana-lysis may have limited our power to detect any bias.
One of the novel aspects of this study was our assess-ment of the agreeassess-ment between self-reported and object-ive estimates of time spent using actobject-ive and motorised modes of transport in which we separated trips involving only one mode from those involving a combination of modes. For trips made only by walking or cycling, the difference between self-reported and objectively-derived times was not significant. However, where active and motorised modes were used in combination, the differ-ence (while small in absolute terms) was significant. For trips made only by motorised modes, self-reported esti-mates were considerably less accurate with the mean overestimation increasing to around 14 minutes/trip. This probably reflects two sources of error in the self-report data, both mainly pertaining to the use of public transport. First, some participants who reported using the bus assigned their total journey time to that mode (resulting in an overestimation of the motorised travel time) and failed to report the mode of transport used to get to and from the bus stop (which was likely to have been walking). Second, participants may have included transport-related activities or public transport waiting times in their reporting of journeys in the travel diary, despite specific instructions to exclude these periods [12]. When the car was the only mode of transport reported on the journey, the mean difference was very small (less than one minute). Given the increasing research interest in time spent in sedentary behaviours such as motor vehicle use, and the uncertainty in the estimation of travel time particularly for public transport journeys, future research should aim to develop methods to elicit more accurate in-formation about the use of motor vehicles.
Acknowledging the likely magnitude of overestimation in self-reported measures
Objective measures, although more accurate, are not al-ways appropriate to use in all situations. For example, self-reported methods of capturing physical activity are often more feasible for use in population surveillance. Consider-able caution should be exercised in using very simple domain-specific measures of walking or cycling for
trans-port — such as a single question to ascertain the usual
changes in the quantity of physical activity being under-taken [4,5]. Our more detailed and specific (but still relatively simple) self-reported measures of walking and cycling on the commute appear to have performed well, with only a small degree of overestimation on average, but they are far from ideal.
It is widely acknowledged that that the use of self-reported data may result in overestimates of time spent in physical activity. Previous studies have suggested sev-eral potential reasons for overestimation of time spent travelling using self-reported measures, such as the rounding of travel times [39] and the inclusion of visits to destinations en route and activities at either end of the journey such as parking, locking up or loading [12]. The tendency for overestimation could also reflect the way in which questions are sometimes structured such that the details and complexities of journeys are not
cap-tured. Systematic error–where such error is predictable
and constant between individuals – would not be
ex-pected to introduce bias into estimates of associations with health or other outcome variables in epidemiological analyses, whereas imprecise measurement of exposure variables with random error may lead to an underestima-tion of such associaunderestima-tions [40]. The error we observed in this study was non-systematic, with inconsistent evidence for patterning by journey duration. As such, we cannot predict what effect this error may have when using such measures in epidemiological studies because this would depend on the associations between errors, exposures, outcomes and other covariates in any analyses. Neverthe-less, researchers should be aware of the possible cumula-tive effect of the overestimation of accumula-tive travel time which, over a week, could be substantial and should use self-reported estimates with caution.
Self-reported measures: fit for purpose?
Estimates of the usual time spent walking and cycling per trip were very similar to the trip-level durations re-ported in the detailed travel diary, and to the average dura-tions recorded over a number of trips using a combination of objective measures. This suggests that groups of partici-pants can accurately report such information, and because commuting is often a regular and habitual activity, it may therefore be entirely appropriate to use a simple self-reported measure if only an estimate of the usual time spent walking or cycling on the commute is required to answer the research question in a given study. The small mean overestimation of time from the self-reported mea-sures indicates that these provide a good estimate of popu-lation levels of activity. However, the wide limits of agreement indicate a risk of substantial over- or under-estimation at an individual level. The implications of these findings depend on the research question for which such data are to be used. For population-level surveillance and
monitoring, self-reported measures of time spent walking and cycling appear likely to perform well. However, for re-search focused on detecting changes within individuals over time, the noise of the potentially large measurement error may mask the signal of small but important real changes in behaviour. We have previously shown that the effect sizes of the most promising interventions to
pro-mote walking for transport are of the order of 15–30
minutes per week [41], which is directly comparable to the size of the measurement error suggested by the ana-lysis reported in this paper. This suggests that evaluations of interventions that are anticipated to have relatively modest effect sizes may have limited power to detect ef-fects on time spent in active commuting if they rely on self-reported measures alone.
Conclusions
We have shown how a combination of data can be used to provide estimates of times spent using active and sed-entary modes of transport to which self-reported esti-mates can be compared. In general, self-reported active, motorised and total travel times on the journey to work were subject to small overestimations at the trip level. Overestimation of travel time was smaller when active modes of transport were used alone and larger when ac-tive modes were combined with the use of motor vehi-cles. Self-report data should be used with caution to infer aggregate weekly quantities of physical activity at-tributable to commuting or to assess changes in longitu-dinal and evaluation studies.
Additional files
Additional file 1:Questions assessing travel to work in the last seven days in the Questionnaire.
Additional file 2:Example travel diary for one day.
Additional file 3:Agreement between reported usual time from questionnaire and mean time derived from objective measures.
Additional file 4:Agreement between reported usual time from questionnaire and mean duration reported in travel diary.
Competing interests
The authors declare that they have no competing interests.
Authors’contributions
JP and DO conceived of the study and AJ and DO advised on its design. SC processed and matched the AccHR data and conducted the statistical analysis. AD processed the GPS data and mapped these in GIS. JP drafted the manuscript. All authors contributed to the critical revision of the paper and approved the final manuscript.
Acknowledgments
Council, National Institute for Health Research and the Wellcome Trust, under the auspices of the UK Clinical Research Collaboration, is gratefully acknowledged. The study is now funded by the National Institute for Health Research Public Health Research programme (project number 09/3001/06: see http://www.phr.nihr.ac.uk/funded_projects). The views and opinions expressed herein are those of the authors and do not necessarily reflect those of the NIHR PHR programme or the Department of Health. The funders had no role in study design, data collection and analysis, the decision to publish, or the preparation of the manuscript.
We thank all staff from the MRC Epidemiology Unit Functional Group Team, in particular for study coordination and data collection (led by Cheryl Chapman and Fiona Whittle), physical activity data processing (Kate Westgate and Stephanie Mayle) and data management. We also thank Søren Brage and Stephen Sharp for his advice on the approach to analysis and comments on the manuscript.
Author details
1
MRC Epidemiology Unit, School of Clinical Medicine, University of Cambridge, Box 285, Cambridge Biomedical Campus, Cambridge CB2 0QQ, UK.2UKCRC Centre for Diet and Activity Research (CEDAR), School of Clinical Medicine, University of Cambridge, Cambridge, UK.3Norwich Medical School, University of East Anglia, Norwich, UK.
Received: 16 April 2014 Accepted: 8 September 2014
References
1. Sallis JF, Cervero RB, Ascher W, Henderson KA, Kraft MK, Kerr J:An ecological approach to creating active living comunities.Annu Rev Public Health2006,27:297–322.
2. Janz KF:Physical activity in epidemiology: moving from questionnaire to objective measurement.Br J Sports Med2006,40:191–192.
3. Prince S, Adamo K, Hamel M, Hardt J, Gorber S, Tremblay M:A comparison of direct versus self-report measures for assessing physical activity in adults: a systematic review.Int J Behav Nutr Phys Act2008,5:56.
4. Besson H, Brage S, Jakes RW, Ekelund U, Wareham NJ:Estimating physical activity energy expenditure, sedentary time, and physical activity intensity by self-report in adults.Am J Clin Nutr2010,
91:106–114.
5. Hagstromer M, Oja P, Sjostrom M:The International Physical Activity Questionnaire (IPAQ): a study of concurrent and construct validity. Public Health Nutr2006,9:755–762.
6. Heinen E, Maat K:Are longitudinal data unavoidable? Measuring variation in bicycle mode choice.Transportation Res Rec2012,2314:72–80. 7. Primerano F, Taylor MP, Pitaksringkarn L, Tisato P:Defining and
understanding trip chaining behaviour.Transportation2008,
35:55–72.
8. Rissel C, Curac N, Greenaway M, Bauman A:Physical activity associated with public transport Use—a review and modelling of potential benefits. Int J Environ Res Public Health2012,9:2454–2478.
9. Panter J, Desousa C, Ogilvie D:Incorporating walking or cycling into car journeys to and from work: the role of individual, workplace and environmental characteristics.Prev Med2013,56:211–217. 10. Shephard RJ:Is active commuting the answer to population health?
Sports Med2008,38:751–758.
11. Kelly P, Krenn P, Titze SPS, Foster C:Quantifying the difference between self-reported and global positioning systems-measured journey durations: a systematic review.Transp Rev2013,33:443–459.
12. Kelly P, Doherty A, Berry E, Hodges S, Batterham A, Foster C:Can we use digital life-log images to investigate active and sedentary travel behaviour? Results from a pilot study.Int J Behav Nutr Phys Act2011,
8:44.
13. Allen A:Dredging up the past: lifelogging, memory, and surveillance. University of Chicago Law Rev2008,75:47–74.
14. van Hees VT, Golubic R, Ekelund U, Brage S:Impact of study design on development and evaluation of an activity-type classifier.J Appl Physiol 2013,114:1042–1051.
15. Maddison R, Ni Mhurchu C:Global positioning system: a new opportunity in physical activity measurement.Int J Behav Nutr Phys Act2009,6:73.
16. Krenn PJ, Titze S, Oja P, Jones A, Ogilvie D:Use of global positioning systems to study physical activity and the environment: a systematic review.Am J Prev Med2011,41:508–515.
17. Troped PJ, Oliveira MS, Matthews CE, Cromley EK, Melly SJ, Craig BA:
Prediction of activity mode with global positioning system and accelerometer data.Med Sci Sports Exerc2008,40:972–978.
18. Audrey S, Procter S, Cooper A:The contribution of walking to work to adult physical activity levels: a cross sectional study.Int J Behav Nutr Phys Act2014,11:37.
19. Kang B, Moudon AV, Hurvitz PM, Reichley L, Saelens BE:Walking objectively measured: classifying accelerometer data with GPS and travel diaries.Med Sci Sports Exerc2013,45:1419–1428.
20. Rodriguez DA, Cho GH, Elder JP, Conway TL, Evenson KR, Ghosh-Dastidar B, Shay E, Cohen D, Veblen-Mortenson S, Pickrell J, Lytle L:Identifying walking trips from GPS and accelerometer data in adolescent females.J Phys Act Health2012,9:421–431.
21. Brage S, Brage N, Franks PW, Ekelund U, Wareham NJ:Reliability and validity of the combined heart rate and movement sensor Actiheart. Eur J Clin Nutr2005,59:561–570.
22. Ogilvie D, Griffin S, Jones A, Mackett R, Guell C, Panter J, Jones N, Cohn S, Yang L, Chapman C:Commuting and health in Cambridge: a study of a 'natural experiment' in the provision of new transport infrastructure. BMC Public Health2010,10:703.
23. Panter J, Griffin S, Jones A, Mackett R, Ogilvie D:Correlates of walking and cycling to work: baseline results from the Commuting and Health in Cambridge study.Int J Behav Nutr Phys Act2011,8:124.
24. Yang L, Griffin S, Chapman C, Ogilvie D:The feasibility of rapid baseline objective physical activity measurement in a natural experimental study of a commuting population.BMC Public Health 2012,12:841.
25. Panter J, Griffin S, Ogilvie D:Correlates of reported and recorded time spent in physical activity: results from the Commuting and Health in Cambridge study.PLoS One2012,7:e42202.
26. Yang L, Panter J, Griffin S, Ogilvie D:Associations between active commuting and physical activity in working adults: cross-sectional results from the commuting and health in Cambridge study.Prev Med 2012,55:453–457.
27. Brage S, Ekelund U, Brage N, Hennings MA, Froberg K, Franks PW, Wareham NJ:Hierarchy of individual calibration levels for heart rate and accelerometry to measure physical activity.J Appl Physiol2007,
103:682–692.
28. Evenson KR, Wen F, Hillier A, Cohen DA:Assessing the contribution of parks to physical activity using global positioning system and accelerometry.Med Sci Sports Exerc2013,45:1981–1987. 29. O'Connor TM, Cerin E, Robles J, Lee RE, Kerr J, Butte N, Mendoza JA,
Thompson D, Baranowski T:Feasibility study to objectively assess activity and location of Hispanic preschoolers: a short communication.Geospat Health2013,7:375–380.
30. Shannon T, Giles-Corti B, Pikora T, Bulsara M, Shilton T, Bull F:Active commuting in a university setting: assessing commuting habits and potential for modal change.Transp Policy2006,13:240–253. 31. Stratford N, Simmonds N, Nicolaas G, Costigan P:National travel survey.
London: Department for Transport; 2003.
32. Klinker C, Schipperijn J, Christian H, Kerr J, Ersboll A, Troelsen J:Using accelerometers and global positioning system devices to assess gender and age differences in children's school, transport, leisure and home based physical activity.Int J Behav Nutr Phys Act2014,11:8.
33. Newson R:Confidence intervals for rank statistics: somers’D and extensions.Stata J2006,6:309–334.
34. Lin L:A concordance correlation coefficient to evaluate reproducibility. Biometrics1989,45:255–268.
35. Lin L:A note on the concordance correlation coefficient.Biometrics2000,
56:324–325.
36. McBride G:A proposal for strength-of-agreement criteria for Lin's Concordance Correlation Coefficient; 2005.
37. Bland M, Altman D:Statistical method for assessing agreement between two methods of clinical measurement.Lancet1986,
327:307–310.
39. Hensher D, Button K, Haynes K, Stopher P:Handbook of transport geography and spatial systems.Oxford: Elsevier; 2008.
40. Hutcheon J, Chiolero A, Hanley J:Random measurement error and regression dilution bias.Br Med J2010,340:1402–1406.
41. Ogilvie D, Foster C, Rothnie H, Cavill N, Hamilton V, Fitzsimons C, Mutrie N:
Interventions to promote walking: systematic review.Br Med J2007,
334:1204–1207.
doi:10.1186/s12966-014-0116-x
Cite this article as:Panteret al.:Development of methods to objectively identify time spent using active and motorised modes of travel to work: how do self-reported measures compare?International Journal of Behavioral
Nutrition and Physical Activity201411:116.
Submit your next manuscript to BioMed Central and take full advantage of:
• Convenient online submission
• Thorough peer review
• No space constraints or color figure charges
• Immediate publication on acceptance
• Inclusion in PubMed, CAS, Scopus and Google Scholar
• Research which is freely available for redistribution