CURRICULUM/EDUCATION ARTICLE
Assessment of Biology Majors
’
Versus Nonmajors
’
Views
on Evolution, Creationism, and Intelligent Design
Guillermo Paz-y-Miño C.&Avelina Espinosa
Published online: 19 November 2008
#Springer Science + Business Media, LLC 2008
Abstract The controversy around evolution, creationism, and intelligent design resides in a historical struggle between scientific knowledge and popular belief. Four hundred seventy-six students (biology majorsn=237, non-majorsn=239) at a secular liberal arts private university in Northeastern United States responded to a five-question survey to assess their views about: (1) evolution, creation-ism, and intelligent design in the science class; (2) students’ attitudes toward evolution; (3) students’position about the teaching of human evolution; (4) evolution in science exams; and (5) students’ willingness to discuss evolution openly. There were 60.6% of biology majors and 42% of nonmajors supported the exclusive teaching of evolution in the science class, while 45.3% of nonmajors and 32% of majors were willing to learn equally about evolution, creationism, and intelligent design (question 1); 70.5% of biology majors and 55.6% of nonmajors valued the factual explanations evolution provides about the origin of life and its place in the universe (question 2); 78% of the combined responders (majors plus nonmajors) preferred science courses where evolution is discussed comprehensively and humans are part of it (question 3); 69% of the combined responders (majors plus nonmajors) had no problem answering questions concerning evolution in science exams (question 4); 48.1% of biology majors and 26.8% of
nonmajors accepted evolution and expressed it openly, but 18.2% of the former and 14.2% of the latter accepted evolution privately; 46% of nonmajors and 29.1% of biology majors were reluctant to comment on this topic (question 5). Combined open plus private acceptance of evolution within biology majors increased with seniority, from freshman (60.7%) to seniors (81%), presumably due to gradual exposure to upper-division biology courses with evolutionary content. College curricular/pedagogical reform should fortify evolution literacy at all education levels, particularly among nonbiologists.
Keywords Evolution . Creationism . Intelligent design . College education . Assessment
Introduction
The controversy around evolution, creationism, and intel-ligent design, which generates much debate in the USA (Petto and Godfrey 2007), resides in a historical struggle between scientific knowledge and popular belief. The theory of evolution proposes that the molecular and physiological processes responsible for the origin and diversification of life on Earth are the consequence of natural selection, mutations, gene flow, and genetic drift (Mayr2001). Since the publication ofThe Origin of Species by Charles Darwin, in 1859, Darwinian evolution has been scrutinized experimentally; today, Darwinism is widely accepted by the scientific community. Creationism and its various forms, including theistic evolution, creation sci-ence, or young-earth creationism (Petto and Godfrey2007), rely on the assumption that the universe and life were created by a Creator who guided the process. This faith-based view is not recognized by scientists as a rational G. Paz-y-Miño C.
Department of Biology, University of Massachusetts Dartmouth, 285 Old Westport Road,
North Dartmouth, MA 02747-2300, USA
A. Espinosa (*)
Department of Biology, Roger Williams University, One Old Ferry Road,
explanation about the ways of the cosmos. Intelligent design (ID), a doctrine born in the 1980s, proposes that a Designer is responsible for the complexity in biological systems and that Darwinism cannot explain holistically the origin and evolution of the natural world, nor the intricate chemical assemblage of most organic structures (Forrest and Gross2004; Young and Taner 2004; Miller 2007). In 2005, ID was exposed in court (Dover, Pennsylvania, Kitzmiller versus Dover Area School District) for violating the rules of science by“invoking and permitting supernat-ural causation” in matters of evolution and for“failing to gain acceptance in the scientific community”(Kitzmiller et al. versus Dover School District et al.2005).
Thousands of articles and hundreds of books address the philosophical, political, social, and scientific components of the evolution/creationism/ID debate. Little is known, however, about how students’ views vary concerning the acceptance, learning, and teaching of evolution in college. Here, we explore students’ perspectives about: evolution, creationism, and intelligent design in the science class; students’ attitudes toward evolution; students’ position about the teaching of human evolution; evolution in science exams; and students’ willingness to discuss evolution openly. We compare/contrast the views of biology majors (BM) with those of nonmajors (NM) and document how majors’ acceptance of evolution increases with their academic level, from freshman to senior. By assessing students’ opinions concerning evolution, we hope to improve the approach with which evolution is taught and contribute to curricular/pedagogical reform for its effective teaching in college.
Methods
Four hundred seventy-six students (biology majorsn=237, nonmajors n=239), native to 17 states in the USA, but mostly from the Northeastern region (Table 1), responded to a five-question anonymous survey to assess their views about evolution, creationism, and intelligent design. All participants signed a consent form prior the completion of the survey, which was conducted September 17–24, 2007 (weeks 4–5 of classes). The Human Subject Review Board at Roger Williams University, a secular liberal arts private school, approved the study. Students answered questions 1– 5 in order and were instructed to not skip or go back to previous questions to fix and/or compare answers. Each question had five possible choices, which were presented randomly, and only one choice was possible per question; however, for the purpose of reporting the data in this article and matching the description of each question with the figure legends (results, below), here, we state the questions as follows: Question 1: Evolution, creationism, and
intelligent design in the science class. Which of the following explanations about the origin and development of life on Earth should be taught in science classes? A = evolution, B = equal time to evolution, creationism, intelligent design, C = do not know enough to say, D = creationism, E = intelligent design. Question 2: Evolution and your reaction to it. Which of the following statements fits best your position concerning evolution? A = hearing about evolution makes me appreciate the factual explana-tion about the origin of life on Earth and its place in the universe, B = hearing about evolution makes no difference to me because evolution and creationism are in harmony, C = do not know enough to say, D = hearing about evolution makes me uncomfortable because it is in conflict with my faith, E = hearing about evolution makes me realize how wrong scientists are concerning explanations about the origin of life on Earth and the universe. Question 3: Your position about the teaching of human evolution. With which of the following statements do you agree? A = I prefer science courses where evolution is discussed com-prehensively and humans are part of it, B = I prefer science courses where plant and animal evolution is discussed but not human evolution, C = do not know enough to say, D = I prefer science courses where the topic evolution is never addressed, E = I avoid science courses with evolutionary content.Question 4: Evolution in science exams. Which of the following statements fits best your position concerning science exams? A = I have no problem answering questions concerning evolution, B = science exams should always include some questions concerning evolution, C = do not know enough to say, D = I prefer not to answer questions concerning evolution, E = I never answer questions concerning evolution. Question 5: Your willingness to discuss evolution. Select the statement that describes you best: A = I accept evolution and express it openly regardless of other’s opinions, B = no opinion, C = I accept evolution but do not discuss it openly to avoid conflicts with friends and family, D = I believe in creationism and express it openly regardless of others’ opinions, E = I believe in creationism but do not discuss it openly to avoid conflicts with friends and family.
created 2×3 contingency tables for the remaining groups in each question, i.e., for question 1 or 3: BM, NM × A, B, C (chi-square tests, null hypotheses rejected atPvalue≤0.05). Below, we refer to these groups as combined student responders: BM and NM in three choices (note: total value ofn, as well asn for biology majors or nonmajors, varied depending on the number of responders). Pair-wise com-parisons between BM and NM of the relevant groups were analyzed with Sign test two-tail, null hypotheses rejected at Pvalue≤0.05).
Because at Roger Williams University exposure to evolutionary theory increases with academic level, from basic to advance biology major courses (Table 1), while nonmajors attend a single core course with introductory evolutionary content (Core-101 Scientific Discoveries in Context, sophomore year), we analyzed responses of biology majors to questions 1–5 (above) as function of school year of enrollment (i.e., freshman, sophomore, junior, senior; chi-square tests of percentage values, null hypotheses rejected atPvalue≤0.05).
Results
Evolution, Creationism, and Intelligent Design in the Science Class Fifty-one percent of the combined student responders (n=467, biology majors n=231, nonmajorsn= 236) considered that evolution should be taught in science classes as an explanation about the origin and development of life on Earth (Fig. 1a); 39% favored equal time to evolution, creationism, and intelligent design, and 10% did not know enough to say (chi-square=16.594,df= 2, P value≤0.001). Pair-wise comparisons indicate that significantly more biology majors (60.6%) than nonmajors (42%) supported the exclusive teaching of evolution, while more nonmajors (45.3%) than majors (32%) were willing to learn equally about evolution, creationism, and intelligent design (Sign test two-tail P value≤0.02). Agreement with the teaching of evolution in science classes increased as a function of biology majors’ academic level, from 50.6% among freshman to 81.6% among seniors (Fig. 1b); although 41.2% of freshman agreed with the statement of
Table 1 Profile of participants in the study (n=476) in respect to the total number of full time students at Roger Williams University and the Biology Department (Roger Williams University Fact Book2007–2008)
Students at RWU Biology Department Participants in study
Biomajorsi Nonmajorsk
Number Percenta Number Percente Number Percentj Number Percentj
Total 3,806 100 322 100 237 49.7 239 50.3
8.5a 6.2a 6.3a
73.6e NA
Females 1,899 49.9 214 66.4 138 58.2 118 49.5
Males 1,907 50.1 108 33.6 99 41.8 121 50.5
Freshman 1,179 31.0 107 33.3 91 38.4 10 4.2
Sophomore 947 24.9 81 25.3 73 30.8 159 66.6
Junior 905 23.8 69 21.3 34 14.5 40 16.7
Senior 775 20.4 65 20.1 39 16.3 30 12.5
New England 2,942 77.3b 239 74.2f NA NA NA NA
East Coast 719 18.9c 66 20.4g NA NA NA NA
Other 145 3.8d 17 5.4h NA NA NA NA
Note that except for the larger enrollment of female than male students in biology, the biology profile is in accordance with the entire university, a trend that coincides with thebiomajorssubsample. Thenonmajorssubsample has a heavier representation of sophomores who are expected to enroll in science core during their second academic year. Participants in the study represent 12.5% of the total number of students at RWU
a
Percentages in respect to total number of full time students at Roger Williams University
b
RWU New England natives correspond to MA 36.3%, CT 20.8%, RI 11.6%, NH 4.7%, ME 2.4%, VT 1.5%
c
RWU East Coast natives correspond to NY 10.0%, NJ 6.8%; PA, MD, DC, VA (<2%)
d
RWU other natives correspond to 20 states (<1%)
e
Percentages in respect to Biology Department
f
Biology Department New England natives correspond to MA 34.3%, CT 18.5%, RI 10.8%, NH 5.9%, VT 2.5%, ME 2.2%
gBiology Department East Coast natives correspond to NY 10.2%, NJ 7.4%, PA 2.5%, MD 0.3% hBiology Department other natives correspond to seven states (<2%)
iBiology majors responded to the survey during lecture hours in ten courses (Fall semester). Freshman: Introductory Biology (91); sophomore:
Anatomy and Physiology (19), Animal Behavior (13), Conservation Biology (4); junior: Ichthyology (28), Marine Vertebrate Biology (23), Genetics (4); senior: Ecology (23), Phycology (17), Developmental Biology (15). Note that Evolution, Cell Biology, Biochemistry, Virology, and Microbiology (not listed) are offered in the Spring semester; biology courses at RWU have an evolutionary perspective
j
Percentages in respect to participants in the study
k
equal time[in the science class]to evolution,creationism, and intelligent design, this opinion dropped to 13.1% among seniors (Fig. 1b; chi-square of percentage values= 22.129,df=6,Pvalue=0.001).
Evolution and Students’ Reaction to It Sixty-three percent of all-combined student responders (n=476, biology majors n=237, nonmajors n= 239) thought that hearing about evolution makes them appreciate the factual explanation about the origin of life on Earth and its place in the universe (Fig. 2a); 17% considered that hearing about evolution makes no difference because evolution and creationism are in harmony; the remaining 20% either did not know enough
to say or agreed that evolution makes them uncomfortable because it is in conflict with their faith or makes them realize how wrong scientists are concerning explanations about the origin of life on Earth and the universe (chi-square = 19.725, df= 4, P value≤0.001). More biology majors (70.5%) than nonmajors (55.6%) appreciated the factual explanations evolution provides about the origin of
69.3%
Percentage of Student Responses
80 –
60 –
40 –
20 –
0 –
b
A B C
100 –
F So 73.1%
80.6% 89.5%
25.0%
11.1% 7.9% 17.9%
5.7%9.0%8.3%2.6% 70.5%
*
Percentage of Student Responses
80 –
60 –
40 –
20 –
0 –
a
A B C D E
55.6%
17.7% 16.7%
7.2% 17.2%
3.4% 6.3% 1.2%4.2%
*
J Sr F So J Sr F So J Sr
Fig. 2 a Percentage of biology majors (black bars, n=237) and nonmajors (white bars, n=239) who think one of the following statements fits best their position concerning evolution:A= hearing about evolution makes me appreciate the factual explanation about the origin of life on Earth and its place in the universe,B= hearing about evolution makes no difference to me because evolution and creationism are in harmony, C = do not know enough to say, D= hearing about evolution makes me uncomfortable because it is in conflict with my faith, and E= hearing about evolution makes me realize how wrong scientists are concerning explanations about the origin of life on Earth and the universe. Raw data chi-square=19.725, df= 4, P≤0.001; asterisks indicate Sign test two-tail pair-wise comparisons A—Pvalue=0.056, C—Pvalue≤0.01.bPercentage of freshman (F), sophomore (So), junior (J), and senior (Sr) biology majors who think statements A, B, or C (above) fit best their position concerning evolution (D and E were excluded from the analysis because over 20% of their expected values were less than 5). Chi-square of percentage values=17.418,df=6,Pvalue=0.008
60.6%
42.0%
32.0% 45.3%
7.4% 12.7%
*
*
Percentage of Student Responses
70 –
60 –
50 –
40 –
30 –
20 –
10 –
0 –
a
A B C
50.6%
Percentage of Student Responses
80 –
60 –
40 –
20 –
0 –
b
A B C
100 –
F 64.3%63.9%
81.6%
41.2%
27.8%
13.1% 28.6%
8.2% 8.3% 5.3% 7.1%
So J Sr F So J Sr F So J Sr
life (Sign test two-tail P value =0.056) but significantly more nonmajors (17.2%) than majors (7.2%) did not know enough to assess this topic (Sign test two-tail P value≤ 0.01). Agreement with factual explanations about the origin of life on Earth and its place in the universe increased as a function of biology majors’academic level, from 69.3% among freshman to 89.5% among seniors (Fig. 2b); although 25% of freshman thought thathearing about evolution makes no difference because evolution and creationism are in harmony, this opinion dropped to 7.9% among seniors (Fig. 2b; chi-square of percentage values= 17.418,df=6,Pvalue=0.008).
Students’Position About the Teaching of Human Evolution Seventy-eight percent of the combined student responders (n=461, biology majorsn=234, nonmajorsn=227) preferred science courses where evolution is discussed comprehen-sively and humans are part of it (Fig. 3a); 10% preferred evolution discussions about plants and animals but not humans; the remaining 12% did not know enough to say (chi-square = 11.879, df= 2, P value≤0.01). Nonmajors (17.2%) were significantly less informed than majors (6.8%) about this topic (Sign test two-tail P value≤0.01). Agreement with science courses where evolution is dis-cussed comprehensively and humans are part of it increased as a function of biology majors’academic level, from 82.2% among freshman to 92.1% among seniors (Fig.3b; the value for sophomores (75.7%) may have been low, or the fresh-man’s high, at the time of the survey); although 11.1% of freshman preferred evolution discussions about plants and animals but not humans, this opinion dropped to 2.6% among seniors (Fig.3b; the value for sophomores (15.7%) may have been high, or the freshman’s low, at the time of the survey; chi-square of percentage values=13.676, df=6, Pvalue=0.033).
Evolution in Science Exams Sixty-nine percent of all-combined student responders (n=476, biology majors n= 237, nonmajors n=239) had no problem with answering questions concerning evolution in science exams (Fig.4a); 14% considered that science exams should always include some questions concerning evolution; the remaining 17% either did not know enough to say, or agreed to prefer not to answer questions concerning evolution, or never answer such questions (chi-square=27.026,df=4,Pvalue≤0.001). Significantly more biology majors (20.3%) than nonmajors (7.9%) considered that evolution should be in science tests, while nonmajors (13%) were significantly less informed than majors (4.2%) about this topic (Sign test two-tail P value≤0.002). Agreement with answering questions concerning evolution in science exams was equally high among all biology majors’ academic levels (mean=71%, Fig. 4b); support for the idea that science exams should
always include some questions concerning evolutionvaried with no particular trend (range 16.3–29%), perhaps because twice as many freshman, or more, expressed not knowing enough to say in respect to other academic levels (chi-square of percentage values = 15.316, df= 6, P value = 0.018).
Students’ Willingness to Discuss Evolution Thirty-seven percent of all-combined student responders (n=476, biolo-gy majors n=237, nonmajors n=239) indicated to accept evolution and express it openly regardless of others’ opinions (Fig. 5a); 38% preferred not to comment on this
83.0% 72.7%
10.2% 10.1%
6.8% 17.2%
*
Percentage of Student Responses
80 –
60 – 100 –
40 –
20 –
0 –
a
A B C
82.2%
Percentage of Student Responses
80 –
60 –
40 –
20 –
0 –
b
A B C
100 –
F So J Sr F So J Sr F So J Sr 75.7%
86.1%92.1%
11.1% 5.6%
2.6% 15.7%
6.7%8.6%8.3%5.3%
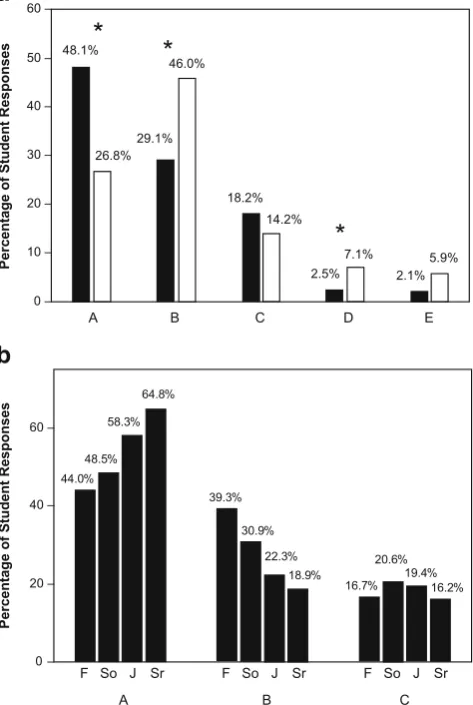
issue; 16% admitted toaccept evolution but not discuss it openly to avoid conflicts with friends and family; the remaining 9% either believe in creationism and express it openly regardless of others’ opinions, or believe in creationism but do not discuss it openly to avoid conflicts with friends and family(chi-square=34.573,df=4,Pvalue≤ 0.001). Significantly more biology majors (48.1%) than nonmajors (26.8%) admitted to accept evolution and express it openly, but nonmajors (46%) were more reluctant than biology majors (29.1%) to comment on this topic (Sign test two-tail P value≤0.04). Biology majors’
willingness to discuss evolution increased as a function of their academic level, from 44% among freshman to 64.8% among seniors (Fig. 5b); although 39.3% of freshman preferred not to comment on this topic, this view dropped to 18.9% among seniors. An average of 18.2% biology majors admitted to accept evolution but not discuss it openly to avoid conflicts with friends and family (Fig.5b; chi-square of percentage values=14.535, df=6, P value= 0.024).
44.0%
Percentage of Student Responses
60 –
40 –
0 –
b
A B C
F So 48.5%
58.3% 64.8%
39.3%
22.3% 18.9% 30.9%
16.7% 19.4%16.2% 20.6% 20 –
48.1%
*
Percentage of Student Responses
60 –
40 –
20 –
0 –
a
A B C D E
26.8%29.1% 46.0%
18.2% 14.2%
2.5% 7.1%
2.1% 5.9%
*
10 – 30 – 50 –
*
J Sr F So J Sr F So J Sr
Fig. 5 a Percentage of biology majors (black bars, n=237) and nonmajors (white bars,n=239) who consider one of the following statements describes them best:A= I accept evolution and express it openly regardless of other’s opinions,B= no opinion,C= I accept evolution but do not discuss it openly to avoid conflicts with friends and family, D = I believe in creationism and express it openly regardless of others’opinions, andE= I believe in creationism but do not discuss it openly to avoid conflicts with friends and family. Raw data chi-square=34.573,df=4,P≤0.001;asterisksindicate Sign test two-tail pair-wise comparisonsP≤0.04.bPercentage of freshman (F), sophomore (So), junior (J), and senior (Sr) biology majors who consider statements A, B, or C (above) describes them best (D and E were excluded from the analysis because over 20% of their expected values were less than 5). Chi-square of percentage values=14.535, df=6,Pvalue=0.024
69.2%
*
Percentage of Student Responses
80 –
60 –
40 –
20 –
0 –
a
A B C D E
68.6%
20.3%
7.9% 4.2%
13%
5.9% 8.4%
0.4% 2.1%
*
70.9%
Percentage of Student Responses
80 –
60 –
40 –
0 –
b
A B C
F So J Sr F So J Sr F So J Sr 68.1%
73.5% 73.0%
16.3% 23.5%
21.6% 29.0%
12.8%
3.0% 5.4% 2.9% 20 –
Fig. 4 a Percentage of biology majors (black bars, n=237) and nonmajors (white bars,n=239) who agree with one of the following statements concerning evolution in science exams: A= I have no problem answering questions concerning evolution, B = science exams should always include some questions concerning evolution, C= do not know enough to say,D= I prefer not to answer questions concerning evolution, andE= I never answer questions concerning evolution. Raw data chi-square=27.026, df=4, P≤0.001; asterisks indicate Sign test two-tail pair-wise comparisons P≤0.002. b
Discussion
Acceptance of evolution differs between biology majors and nonmajors: 60.6% of biology majors versus 42% of nonmajors supported the exclusive teaching of evolution in science classes, 70.5% of biology majors versus 55.6% of nonmajors valued the factual explanations evolution pro-vides about the origin of life and its place in the universe, and 48% of biology majors versus 26.8% of nonmajors expressed their acceptance of evolution openly (Figs. 1a,
2a, and 5a, choice A). In contrast, 45.3% of nonmajors versus 32% of biology majors favored equal time in the science class to evolution, creationism, and intelligent design, and 46% of nonmajors versus 29.1% of biology majors preferred not to comment on their willingness to discuss evolution or creationism openly (Figs. 1a and 5a, choice B). The combined responses of students who accept evolution and express it openly plus those who accept evolution privately (Fig. 5a, choices A plus C) show that 66.3% of all biology majors versus 41% of all nonmajors accept evolution.
Acceptance of evolution within biology majors increased with their academic level, from the freshman to the senior year, e.g., support to the teaching of evolution in the science class (50.6% in freshman, 81.6% in seniors; Fig.1b, choice A), appreciation for the factual explanations about the origin of life on Earth and its place in the universe (69.3% in freshman, 89.5% in seniors; Fig.2b, choice A), or willingness to discuss evolution openly (44% in freshman, 64.8% in seniors; Fig. 5b, choice A). The combined responses of biology majors who accept evolu-tion and express it openly plus those who accept evoluevolu-tion privately (Fig.5b, choices A plus C) show that 60.7% of freshman and 81% of seniors accept evolution. Freshman biology majors alone showed higher overall acceptance of evolution than nonmajors (e.g., 50.6% of freshman biology majors versus 42% nonmajors supported the exclusive teaching of evolution; Fig. 1a,b, choice A; 69.3% of freshman biology majors versus 55.6% of nonmajors valued the factual explanations evolution provides about the origin of life and its place in the universe; Fig. 2a,b, choice A; 44% of freshman biology majors versus 26.8% of nonmajors expressed their acceptance of evolution openly; Fig.5a,b, choice A), suggesting a precollege background in support of evolution, probably linked to household influ-ence and/or high school sciinflu-ence education. In some cases, freshman’s views were comparable to nonmajors’ (e.g., 41.2% of freshman biology majors versus 45% nonmajors favored equal time in the science class to evolution, creationism, and intelligent design; Fig. 1a,b, choice B), but the overall trend showed an increase in acceptance of evolution (Figs.1b,2b, and5b, choice A) and a decrease in support of other alternatives (Figs. 1b, 2b, and 5b, choice
B) from the freshman to the senior year. Gradual exposure to upper-division biology courses with evolutionary content might explain this trend (i.e., freshman—Introductory Biology; sophomore—Anatomy and Physiology, Animal Behavior, Conservation Biology; junior—Ichthyology, Ma-rine Vertebrate Biology, Genetics; senior—Ecology, Phy-cology, Developmental Biology; Table 1). Note that at Roger Williams University, nonmajors attend a single core course, mainly during their sophomore year, with introduc-tory evolutionary content (Core-101 Scientific Discoveries in Context; eight sections, 30 students/section; Table 1). We had no accurate way to assess their longitudinal range of views about evolution but suspect that nonmajors may not increase their acceptance of evolution chronologically as much as biology majors, considering that nonmajors never reached the freshman’s biology majors’ baseline support of evolution (data above). We point out, however, that nonmajors are willing to learn evolution: 55.6% of them appreciate factual explanations about the origin of life on Earth and its place in the universe (Fig.2a, choice A), 72.7% prefer science courses where evolution is discussed comprehensively and humans are part of it (Fig.3a, choice A), and 68.6% have no problem answering questions concerning evolution in science exams (Fig.4a, choice A).
It is intriguing that 32% of biology majors favored equal time in the science class to evolution, creationism, and intelligent design (Fig. 1a, choice B). Further analysis of this group reveals that 41.2% of freshman biology majors agreed with this view, an opinion that drops to only 13.1% by the senior year (Fig. 1b, choice B). There is little knowledge, however, about ID among all-combined student responders (biology majors plus nonmajors): 48.5% have no opinion about it, 18% believe it is a scientific theory about the origin and evolution of life on Earth, 15.5% consider it religious doctrine consistent with creationism, 11% see it as not scientific but proposed to counter evolution based on false scientific claims, and 7% think it is a scientific alternative to evolution of equal scientific validity among scientists (chi-square=2.227,df=4,Pvalue= 0.69, data not shown).
concerning evolution in science exams; and 0.4% of biology majors and 2.1% of nonmajors never answer such questions (Fig.4a, choices D, E).
These results may represent a general tendency among secular liberal arts private colleges in Northeastern United States, particularly those similar to Roger Williams University (middle/upper-middle income population); more than 90% of the students at this institution are native to New England (77.3%) and the East Coast of the US (18.9%; Table 1). Because public support to science correlates positively to level of schooling and income (National Science Foundation
2006), local and regional differential acceptance of evolution should be expected if similar assessments were conducted at public or religious institutions.
Objections to teaching evolution in the science class presumably come from misinformed adults, rather than college students. In fact, acceptance of the theory of evolution in the USA increases with level of education, from 20% in high school to 52% and 65% among college-or postgraduates, respectively (Brumfield 2005); our results (70.5% biology majors (Fig.2a choice A); 66.3% biology majors (Fig. 5a choices A plus C)) surpass the latter. Adults who, for example, believe that humans were designed in the present form within the last 10,000 years coincide with the views of the least educated population of adolescents between the ages 13 and 17 (Brumfield
2005).
The literature illustrates this further and helps us understand the transition of the evolution/creationism controversy from high school to college. Because parents and some community leaders influence high school policies, teachers avoid conflicts with them by weakening the science curriculum. To comply with parents’ demands and student’s curiosity for catchy jargon, such as “ intelli-gent design,” 43% of high school teachers are willing to dedicate“equal time”to science and ID (National Science Foundation 2006), and 30% and 31% admit to having omitted evolution from their lessons or included nonscien-tific alternatives to evolution in their classes due to pressure, respectively (US National Science Teachers Association 2005). As a result, students arrive at college with weak science backgrounds; our data on nonmajors’ acceptance of evolution (41%; Fig.5a, choices A plus C) demonstrates that.
Does assessing student acceptance of evolution matter? Because college curriculum development is conceptualized by institutional committees (National Science Foundation
2006), influenced by public opinion (Petto and Godfrey
2007; The Gallup Poll 2007), it is crucial to understand students’perception of science and tendency of acceptance of scientific principles. The major implication of our findings, for the purpose of curricular/pedagogical reform, is that evolution (the course, the core theme of all sciences,
the centerpiece of all rational explanations about the natural world and the cosmos) should be required at and integrated into all educational levels. Evolutionary theory should be offered widely and taught without distinction between biology majors and nonmajors as part of their science literacy. Our study demonstrates that students can be, and are, enthusiastic about learning factual explanations about the origin and diversification of life, including humans, and that contact with science education, particularly biology, determines their acceptance of evolutionary theory. Stu-dents exposed to evolution in the classroom accept it, while those deprived of it can adopt nonscientific interpretations about the reality of the universe in which they live. We are confident that comprehensive science education, particular-ly directed at nonbiology majors, can correct this anomaparticular-ly, but public and institutional support are crucial to guarantee such outcome. Outreach education programs for nontradi-tional students, school teachers, and the public are fundamental to integrate evolution into our society’s culture. Although the majority of students in our survey seem receptive to learning about evolution, a possible trend at sister secular liberal arts private institutions in North-eastern United States, we must continue assessing how their views evolve with time, particularly now that objections to evolutionary theory reappear with vigor.
We consider it important to improve the approach with which evolution should be taught. The following tips have helped us communicate evolutionary theory to our students and motivate them to pursue careers in the sciences: (1) be as sensitive to students’faith preferences as to other types of diversity in the classroom, such as cultural backgrounds and gender orientation; (2) discuss evolution as scientific fact and in a comparative manner across taxa, always including humans as part of nature (Gould2002; Dawkins
to illustrate adaptive radiation, speciation, and extinctions of formerly successful taxa (Human Evolution Lab: Using Fossil Replicas, available from the authors); (8) conduct field courses in exemplar environments where geologic time can be appreciated at large scale, i.e., Grand Canyon, Hawaiian, or Galapagos archipelagos (Evolution on Islands: Using the Galapagos Archipelago as a Model, syllabus available from the authors); (9) discuss novel examples of micro- and macroevolution currently at work, e.g., tuberculosis resistance to antibiotics (Ernst et al.
2007), beak evolution in Darwin’s finches (Grant and Grant
2006); and (10) leave the students with the idea that evolution is a gradual process by which the universe changes and that it includes the origin of life, its diversification, and the synergistic phenomena resulting from the interaction between life and the environment.
Acknowledgments We thank the students at Roger Williams
University for participating in this study; Kerri Warren, Brian Wysor, Dale Leavitt, David Taylor, Harold Pomeroy, Loren Byrne, Marcie Marston, Paul Webb, Scott Rutherford, Sean Colin, Timothy Scott, Tom Sorger, Anthony Viola, Christopher Laperle, and Mary Rapien distributed the surveys to the students. Patricia Kennedy facilitated the administrative and logistics aspects of the study. Gregory Rogers provided the raw data used to build Table 1. The Human Subject Review Board at Roger Williams University approved the protocol. Two reviewers and a guest editor provided comments that helped us improve the manuscript.
References
Brumfield G. Who has designs on your students’ minds. Nature 2005;434:1062–5.
Dawkins R. The ancestor’s tale. Boston: Houghton Mifflin Company; 2004.
Ernst JD, Trevejo-Nuñez G, Banaiee N. Genomics and the evolution, pathogenesis, and diagnosis of tuberculosis. J Clin Invest. 2007;117:1738–45.
Forrest B, Gross RP. Creationism’s Trojan Horse: the wedge of intelligent design. New York: Oxford University Press; 2004.
Gould SJ. The structure of evolutionary theory. Cambridge: The Belknap Press of Harvard University; 2002.
Grant PR, Grant BR. Evolution of character displacement in Darwin’s finches. Science 2006;313:224–6.
Kitzmiller et al. versus Dover Area School District et al.; http:// msnbcmedia.msn.com/i/msnbc/sections/news/051220_kitzmiller_ 342.pdf; 2005.
Lecointre G, Le Guyader H. The Tree of Life, a phylogenetic classification. Cambridge: Belknap; 2007.
Lewin R, Foley RA. Principles of human evolution. Malden: Black-well; 2004.
Mayr E. What evolution is. New York: Basic Books; 2001. McKee JK, Poirier FE, McGraw WS. Understanding human
evolu-tion. Upper Saddle River: Pearson Prentice Hall; 2005. Miller KR. Falling over the edge. Nature 2007;447:1055–6. National Science Foundation. Science and technology: public attitudes
and understanding. In: Science and engineering indicators, chapter 7; 2006. p. 7.1–7.46.
Petto AJ, Godfrey LR, editors. Scientists confront intelligent design and creationism. New York: Norton; 2007
Roger Williams University Fact Book 2007–2008. Office of Institu-tional Research, p. 5–13.
Stringer C, Andrews P. The complete world of human evolution. London: Thames & Hudson; 2005.
The Gallup Poll. Evolution, creationism, intelligent design. http:// www.galluppoll.com/content/?ci=21814&pg=1; 2007.
US National Science Teachers Association. Survey indicates science teachers feel pressure to teach nonscientific alternatives to evolution. http://science.nsta.org/nstaexpress/nstaexpress_ 2005_03_28_pressrelease.htm; 2005.