Journal of Patient-Centered
Journal of Patient-Centered
Research and Reviews
Research and Reviews
Volume 6 Issue 1 Article 3
1-28-2019
Development of the Resident Wellness Scale for Measuring
Development of the Resident Wellness Scale for Measuring
Resident Wellness
Resident Wellness
R. Brent Stansfield Dan Giang
Tsveti Markova
Follow this and additional works at: https://aurora.org/jpcrr
Part of the Health and Medical Administration Commons, Medical Education Commons, Mental and Social Health Commons, Occupational Health and Industrial Hygiene Commons, and the Social
Psychology Commons
Recommended Citation Recommended Citation
Stansfield RB, Giang D, Markova T. Development of the Resident Wellness Scale for measuring resident wellness. J Patient Cent Res Rev. 2019;6:17-27. doi: 10.17294/2330-0698.1653
www.aurora.org/jpcrr 17
R. Brent Stansfield, PhD,1 Dan Giang, MD,2 Tsveti Markova, MD1
1Graduate Medical Education, Wayne State University School of Medicine, Detroit, MI; 2School of Medicine, Loma Linda University, Loma Linda, CA
ORIGINAL RESEARCH
Development of the Resident Wellness Scale for
Measuring Resident Wellness
R
esidency is physically and emotionallydemanding, and many residents are burned out, depressed, or suicidal.1,2 When residents
are unwell, they provide poorer patient care1 and make
more clinical errors.3,4 To address this problem, the
Accreditation Council for Graduate Medical Education (ACGME) recently added program and institutional requirements to monitor resident wellness: “[P]rograms … have the same responsibility to address
well-being as they do to evaluate other aspects of resident competence.”5 To meet these requirements and this
responsibility, and to be able to evaluate the effectiveness of wellness interventions, residency programs need measures of resident wellness.6,7
Resident wellness is not the absence of burnout and depression. It is a distinct construct and should be measured directly.8 Resident wellness can be
conceptualized as a resource, the depletion of which results in burnout and depression9 or as a set of
“driver dimensions” that make the difference between burnout and engagement.7 In these conceptualizations,
decreases in resident wellness will precede burnout and depression. Measuring resident wellness directly,
Purpose Graduate medical education programs have a responsibility to monitor resident wellness. Residents are at risk of burnout, depression, and suicide. Burnout and depression are associated with poor patient care. Many existing tools measure burnout, depression, and general human well-being, but resident wellness is a distinct construct. We aimed to develop an instrument to measure resident wellness directly.
Methods An expert panel from two purposefully different graduate medical education institutions generated a behavior- and experience-based model of resident wellness. The panel and resident leaders from both institutions generated 92 items, which were tested alongside anchor scales measuring burnout, depression, personality, optimism, life satisfaction, and social desirability in a convenience sample of 62 residents. Ten items were selected using a combination of factor analysis, a genetic algorithm, and purposeful selection. The 10-item scale was distributed to 5 institutions at which 376 residents completed it anonymously. Exploratory factor analysis was used to examine the factor structure of the scale.
Results The model of resident wellness aligned with an accepted framework of well-being in the literature. The 10-item Resident Wellness Scale broadly covered the model and correlated meaningfully with anchor scales. The factor structure of the scale suggested sensitivity to meaningful work, life security, institutional support, and social support.
Conclusions This novel Resident Wellness Scale is designed to track residents’ wellness longitudinally. It is sensitive to aspects of resident wellness that have been shown to reduce burnout and depression and appears to be a psychometrically strong measure of resident wellness. (J Patient Cent Res Rev. 2019;6:17-27.) Keywords resident wellness; scale development; burnout; factor analysis; graduate medical education
Correspondence: R. Brent Stansfield, PhD,
Graduate Medical Education Office, 540 E. Canfield Street, 4374 Scott Hall, Detroit, MI 48201 (rbstansfield@wayne.edu)
therefore, is necessary for an assessment program that is sensitive to the full spectrum of resident wellness.
The literature provides myriad broad, ambiguous definitions of human well-being10 covering to various
degrees psychological, physical, emotional, mental, and social aspects, each of which can each be understood in terms of pleasure and arousal, hedonic and eudaimonic well-being.11,12 Many measures of human well-being
exist, covering many facets of human experience,13 but
only a subset of these facets are relevant to physician wellness.14 Resident wellness is distinct from physician
wellness: residency is a unique situation in clinician professional development because residents face stressors that other physicians do not. Residents are learners but no longer students, autonomous but strictly supervised, assessed frequently and summatively. The clinical environment requires different coping skills than the classroom.15 Maintaining a positive
outlook, achievement of goals, and social relationships are major drivers of happiness in residency,16,17 and
residents’ recovery from burnout requires connections with patients and colleagues and a sense of meaning in one’s work.18 The distinction between human
well-being and the narrower construct of resident wellness suggests existing measures of human or even physician
wellness may be inappropriate for measuring resident wellness. A recent literature review found that resident wellness was most associated with residents’ sense of autonomy, competence, and social relatedness and concluded there is a need for a “consensus on appropriate well-being scales in the field….”6
To meet this need and to better meet the ACGME requirements, we sought to develop a measurement tool to specifically measure resident wellness. We aimed to create a scale that was short, psychometrically sound, and targeted towards aspects of wellness directly relevant to residents. We aimed to make our scale sensitive to changes in resident wellness over time and to distribute it freely for use by residency programs. This scale could be used to measure the effectiveness of various program and institutional interventions to improve resident wellness. Such a scale would be a novel and important contribution to the literature.
METHODS
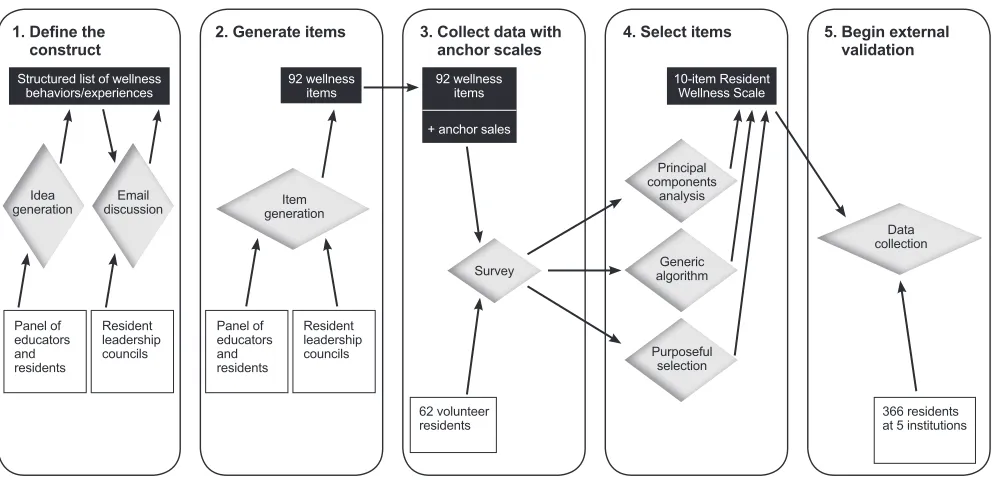
To develop the scale, we followed Clark and Watson’s 5-step framework: 1) define the construct, 2) generate items, 3) collect data with anchor scales, 4) select items, and 5) begin external validation.19 Figure 1 illustrates
this process: In step 1, a panel of educators and residents
Figure 1. Flow chart showing the 5 steps of scale development. Participants are shown in white boxes, processes in gray diamonds, and results in black boxes.
366 residents at 5 institutions
Data collection
5. Begin external validation
Principal components
analysis
Generic algorithm
Purposeful selection
10-item Resident Wellness Scale 4. Select items
Panel of educators and residents
Resident leadership councils Item generation
92 wellness items 2. Generate items
1. Define the
construct Structured list of wellness
behaviors/experiences
Panel of educators and residents
Resident leadership councils Idea
generation discussionEmail
62 volunteer residents
Survey
92 wellness items
+ anchor sales 3. Collect data with
www.aurora.org/jpcrr 19
and a broader group of resident leaders generated a behavioral/experiential model of resident wellness; in step 2, these same groups wrote a collection of wellness items; in step 3, resident volunteers completed all the wellness items alongside a set of other validated measures of constructs related to wellness; in step 4, 10 items were selected after 3 methods of analysis of the collected data; and in step 5, the 10-item Resident Wellness Scale was distributed to a broader population of residents at multiple institutions.
All work was found exempt by the Wayne State University institutional review board (protocols 1702000307 and 1705000562).
Defining the Construct
The goal of step 1 was to generate “… a precise and detailed conception of the target construct and its theoretical context.”19
Panel of Educators and Residents: In the fall of 2016, a panel of medical educators, psychologists specializing in psychosocial development of physicians-in-training, and resident leaders from two institutions was convened. Participating institutions were 1) a Midwestern public university with 10 sole-sponsored residency programs, and 2) a large West Coast private university with 23 sole-sponsored residency programs. The panel included a cognitive research psychologist with expertise in medical education learning environments and professional development, a marriage and family therapist with experience working with residents, 2 physicians designated institutional officials (a family medicine physician and a neurologist), and 4 residents identified as resident leaders. The panel therefore represented a broad range of experiential and academic expertise around the stressors of residency and the qualities of residents who flourish or struggle.
The panel met by conference call and later communicated by email to answer these questions: “What behaviors or experiences does a well resident have that an unwell resident does not?” and “How does resident wellness relate to depression, burnout, optimism, and life satisfaction, and what correlation would you expect between measures of these constructs?” The terms “well” and “unwell” in the instructions were not defined to avoid biasing the panel towards or
away from certain types of responses and to ensure that responses reflected the panel’s experience-based understanding of the construct of resident wellness. The authors (R.B.S., D.G, T.M.) organized the list of responses into themes, and the organized list served as the “precise and detailed conception of the target construct” required by Clark and Watson.19
Resident Leadership Councils: The organized list of behaviors and experiences was then distributed by email to members of the resident councils at both institutions. Each respective council is comprised of peer-selected residents. These councils act as liaisons of residents’ concerns and interests with the program and institutional administration. Four residents from these councils made changes to the organized list; these were incorporated into the final organized list, which was then compared with published frameworks of well-being to find concordance with generally accepted models of well-being.
Generate Items
The goal of step 2 was the creation of a set of possible items that is “broader and more comprehensive than one’s own theoretical view of the target construct” and also includes items that are “tangential or even unrelated to the core construct.”19
In the winter of 2016, the final organized list of behaviors and experiences from step 1 was distributed to the original panel and the members of the institutions’ resident councils who served as item writers. Item writers were instructed to read the organized list and to write items that followed this stem: “Please rate how often you have done or experienced each of the following items in the past 3 weeks.”
This stem was chosen to make the scale appropriate for tracking wellness longitudinally. The 3-week period is sufficiently long to capture relatively infrequent behaviors, but short enough for episodic memory to be reliable (young adults’ memories have approximately 70% sensitivity and 70% specificity after 3 weeks20). Residents’ work environments
change with each rotation, which typically last 1 or 2 months, therefore a 3-week span is a reliable period of stability between a resident orienting him or herself to and completion of a rotation.
Items were to be answered using a 5-point frequency scale: “never,” “seldom,” “sometimes,” “often,” and “very often.” This frequency scale anchor set was drawn from existing successful frequency scales in various self-report measures around wellness and education.21-24 Items were collected by email and
lightly edited by the first author for clarity and style.
Data Collection With Anchor Scales
The goal of step 3 was to test how residents respond to the items and to compare items with other related and unrelated constructs.19
In the winter of 2016, volunteer residents recruited by email completed an online survey of all written items alongside the abbreviated Maslach Burnout Inventory (aMBI),25 the Beck Depression Inventory (BDI),26
the Life Orientation Test (Revised) (LOT-R),27 the
Satisfaction with Life Scale (SLS),28 the first 12 items
of the Social Desirability Scale (SDS),29 and the
Ten-Item Personality Inventory (TIPI).30 Responses were
anonymous and saved in an online database.
These scales were chosen to reflect the discussion by the panel of educators and residents from step 1. The panel agreed that resident wellness should correlate negatively with depression (BDI) and burnout (aMBI’s emotional exhaustion and depersonalization categories), though not strongly since residents’ wellness may vary among residents who are neither depressed nor burned out. The panel agreed that resident wellness should correlate positively with personal accomplishment (aMBI’s personal accomplishment category), optimism (LOT-R), and possibly with cognitive appraisal of life choices (SLS). Scale items should be free from bias, so social desirability (SDS, a measure of how much a respondent is telling you what you want to hear) and the “Big 5” personality traits (TIPI) should have low correlations with the final scale.
Psychometric Analysis and Item Selection
The goal of step 4 was to select a meaningful subset of items.19 Items with skewed response distributions were
eliminated since such items provide less information due to floor and ceiling effects. Very rare or very common behaviors or experiences are not useful for distinguishing between people since many people give the same response. Floor and ceiling effects were
identified as items with greater than 30% “never” or “very often” responses, which is consistent with or more lenient than other scale developers’ cut-offs.31,32
The remaining items were examined and their correlation with the other scales in the survey computed. Missing responses were imputed from item means, which is superior to listwise or casewise deletion.33
Three methods were used in parallel to identify the best subset of items: principal components analysis, a genetic algorithm, and purposeful selection.
Principal Components Analysis: Principal components analysis on the correlation matrix of the anchor scale scores and remaining items was used to find the items with the most unique variance. Items that loaded highly on the first principal component and lower on subsequent components were considered strong candidates for the final scale since these showed the most promise for discriminating the target construct from other nuisance constructs.19
Genetic Algorithm: The authors used a modified genetic algorithm similar to the one used by Eisenbarth et al to optimally reduce the number of items on a large personality scale.34 The use of this algorithm allowed
the generation of a psychometrically desirable 10-item scale — negative correlation with burnout and depression, positive correlation with optimism and life satisfaction, low correlation with social desirability — without subjective bias of researchers choosing their favorite items. The algorithm is nonlinear and therefore capable of finding effective combinations of items that elude linear methods such as factor analysis.
Purposeful Selection: Each item was categorized into themes independently by 2 raters, the first author and another graduate medical education expert independent from the research team. The authors reviewed the principal components analysis results and algorithmically generated scales and chose 10 items that 1) had highly discriminatory factor scores, 2) combined well according to genetic algorithm results, and 3) gave the broadest coverage of the identified themes.
www.aurora.org/jpcrr 21
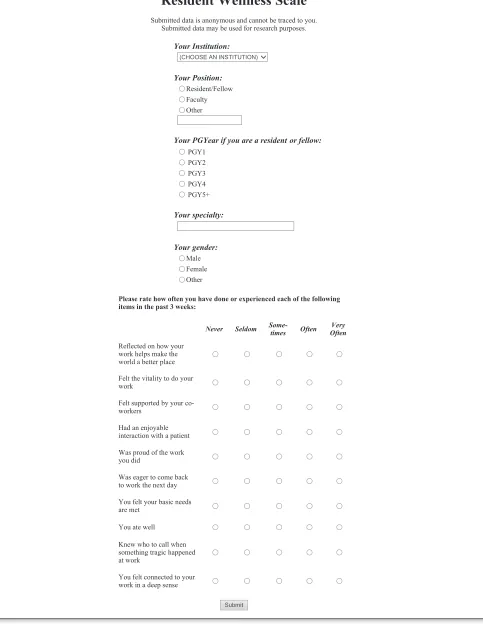
Figure 2. The 10-item Resident Wellness Scale.
Resident Wellness Scale
Submitted data is anonymous and cannot be traced to you. Submitted data may be used for research purposes.
Your Institution:
(CHOOSE AN INSTITUTION)
Your Position:
Resident/Fellow Faculty Other
Your PGYear if you are a resident or fellow: PGY1 PGY2 PGY3 PGY4 PGY5+ Your specialty: Your gender: Male Female Other
Please rate how often you have done or experienced each of the following items in the past 3 weeks:
Never Seldom Some-times Often OftenVery
Reflected on how your work helps make the world a better place
Page 1 of 2 Resident Wellness Scale (RWS)
1/10/2019 file:///S:/Limberg/%60RMP%20design/JPCRR/Volume%206,%202019/Volume%206%20...
Felt the vitality to do your work
Felt supported by your co-workers
Had an enjoyable interaction with a patient
Was proud of the work you did
Was eager to come back to work the next day
You felt your basic needs are met
You ate well
Knew who to call when something tragic happened at work
You felt connected to your work in a deep sense
Submit
Page 2 of 2 Resident Wellness Scale (RWS)
1/10/2019 file:///S:/Limberg/%60RMP%20design/JPCRR/Volume%206,%202019/Volume%206%20...
Resident Wellness Scale
Submitted data is anonymous and cannot be traced to you. Submitted data may be used for research purposes.
Your Institution:
(CHOOSE AN INSTITUTION)
Your Position:
Resident/Fellow Faculty Other
Your PGYear if you are a resident or fellow: PGY1 PGY2 PGY3 PGY4 PGY5+ Your specialty: Your gender: Male Female Other
Please rate how often you have done or experienced each of the following items in the past 3 weeks:
Never Seldom Some-times Often OftenVery
Reflected on how your work helps make the world a better place
Page 1 of 2 Resident Wellness Scale (RWS)
1/10/2019 file:///S:/Limberg/%60RMP%20design/JPCRR/Volume%206,%202019/Volume%206%20...
Felt the vitality to do your work
Felt supported by your co-workers
Had an enjoyable interaction with a patient
Was proud of the work you did
Was eager to come back to work the next day
You felt your basic needs are met
You ate well
Knew who to call when something tragic happened at work
You felt connected to your work in a deep sense
Submit
Page 2 of 2 Resident Wellness Scale (RWS)
1/10/2019 file:///S:/Limberg/%60RMP%20design/JPCRR/Volume%206,%202019/Volume%206%20...
Begin External Validation
The goal of step 5 was to test the performance of the Resident Wellness Scale in a normative population of residents.
Because validation is a continuous cycle of testing and revision,19,35 we made the Resident Wellness Scale
freely available for use by volunteer institutions. From the summer of 2017 through the summer of 2018, 5 institutions used the Resident Wellness Scale through a custom-built web interface with data stored on a secure server. Institutions could log in to the interface to retrieve their institution’s data at any time, and all data were available for analysis by the authors in accordance with institutional review board guidelines and a signed data-sharing agreement by each institution. Partnering institutions agreed to share their data with the research team with the assurance of institutional anonymity through a formal data-sharing agreement.
Factor structure is a source of validity evidence; it reveals response patterns across multiple items, which indicate meaning.19,35 Resident Wellness Scale
responses from the 5 institutions were analyzed. Responses with any missing item responses were removed. Horn’s parallel analysis for common factors determined the number of factors to retain. Exploratory factor analysis using maximum likelihood and oblimin rotation on the item covariance matrix was used to determine the factor structure of the scale.36
Factors scores were computed for each resident using Bartlett’s weighted least squares method.37 Factor
scores were tested for differences between gender (Welch-corrected t-tests) and for effects of postgraduate training year (linear regression).
All statistical analyses were conducted using R, an open-source statistical computing language.38 The
“paran” package was used for parallel analysis, and the “psych” package was used for exploratory factor analysis and to compute Cronbach’s alpha and item-total correlations.
RESULTS
Define the Construct
The panel discussion generated over 100 behaviors and experiences associated with resident wellness, and the
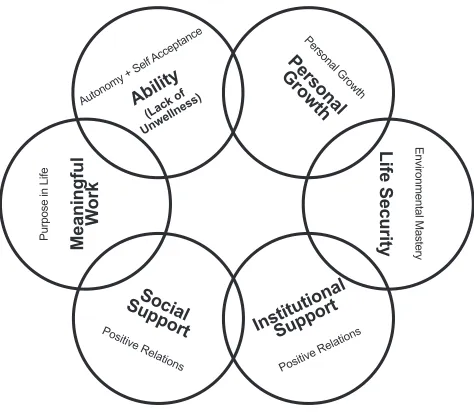
broader group of resident leaders added another 12. The authors identified 7 themes of these behaviors: 1) ability (sense of competence and skill); 2) meaningful work (sense of personal connection and value of work); 3) social support (peer and family connections and activities); 4) institutional support (sense of belonging and security in the clinical and educational setting); 5) personal growth (the experience of professional development and learning); 6) life security (having basic needs met); and 6) lack of unwellness (avoidance of destructive or negative behaviors).
Of the literature reviewed by authors, the 6 categories of well-being defined by Ryff and Keyes39 were found
to closely fit our themes. Lack of unwellness contained behaviors and experiences (ie, “you never lack patience”) that were the opposite of those in the ability theme (ie, “you focus on the positive aspects of tough situations”), and so these themes were combined. Figure 3 shows the resulting 6-aspect construct of resident wellness.
Item Generation
Item writers contributed 92 items. Items ranged in specificity from broad assessments of categories (ie, “felt robust”) to more specific (ie, “talked to a friend about a difficulty at work”). While item writers were instructed to write positively worded items, many
Autonomy + Self Acceptance
Purpose in Life
Environmental Mastery
Personal Growth
(Lack of
Unwellness)
Positive Relations
Positive Relations
Ability
Social Support
Institutional
Support
Meaningful
W
ork
Life Security
Personal
Growth
www.aurora.org/jpcrr 23
wrote negatively worded items to measure unwellness (ie, “resented your patients”). These negatively worded items were kept as written.
Data Collection With Anchor Scales
A total of 63 residents volunteered to complete the full survey of the 92 items and the other scales. One respondent completed fewer than half of the survey and was excluded, leaving 62 full responses. Of these, 13 (21%) were PGY1, 6 (10%) were PGY2, 20 (32%) were PGY3, 15 (24%) were PGY4, and 3 (5%) were PGY5 or higher. The majority of respondents (77%) were from one institution.
Item Selection
There were 18 items showing floor effects and 8 showing ceiling effects. These were removed. The remaining items had item means from 2.24 (just above “rarely”) to 3.94 (just below “often”), reflecting wide range of response sensitivity despite removal of items nearer to the floor and ceiling of the response scale.
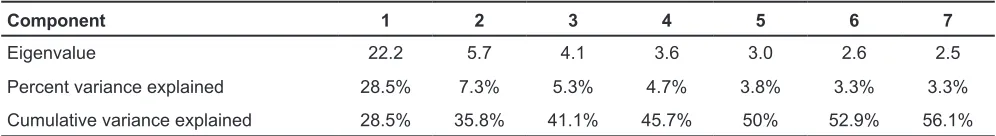
Principal Components Analysis: Anchor scale scores and items had a strong common component (Table 1). The first component’s eigenvalue was 22.2, and the second component’s eigenvalue was only 5.7. Anchor scale scores loaded meaningfully on the first factor — depression (BDI: -0.14), burnout, emotional exhaustion (aMBI: -0.15), and burnout, depersonalization (aMBI: -0.10) loaded negatively with this component. Burnout, personal accomplishment (aMBI: 0.14), optimism (LOT-R: 0.13), and life satisfaction (SWL: 0.14) loaded positively with the first component. Social desirability (SDS: 0.06) and personality scores loaded mostly weakly (extraversion: 0.04; agreeableness: 0.02; conscientiousness: 0.04; emotional stability: 0.09; openness to experience: 0.10). Items that loaded
highly on this factor and low on subsequent factors were considered strong candidates for inclusion in the scale.19
Genetic Algorithm: Several 10-item scales created by the genetic algorithm were reviewed by the authors. One was chosen since all the items selected were considered strong from the principal components analysis results.
Purposeful Selection: The item categorizations by 2 raters each overlapped closely with Ryff and Keyes’ 6 aspects of well-being,39 therefore each item was
categorized into one aspect (Figure 3). One item on the algorithmically generated scale was swapped to increase coverage of the life security aspect of wellness.
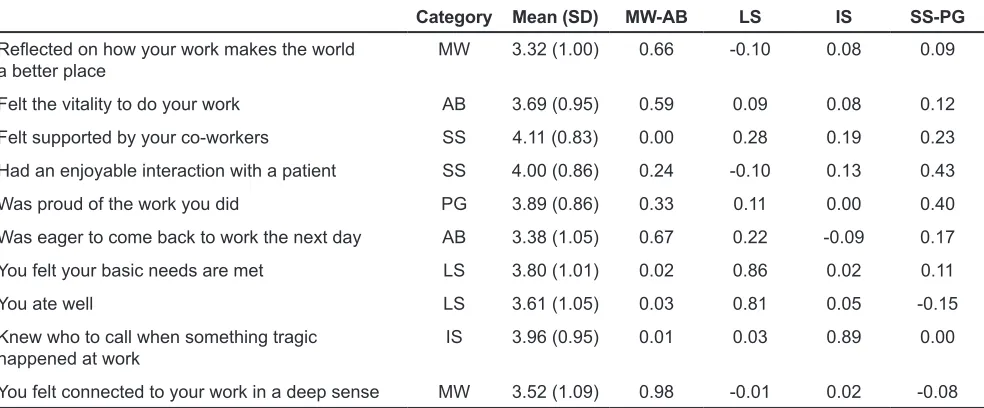
The result was a 10-item scale covering all 6 themes of well-being approximately equally (Table 2) and showing meaningful correlations with other scales. The resulting scale consisted of 2 meaningful work items, 2 ability items, 2 life security items, 2 social support items, 1 personal growth item, and 1 institutional support item. Item correlations were high (between 0.10 and 0.72) with a high Cronbach’s alpha of 0.87, suggesting strong internal consistency. Item means ranged from 2.9 to 3.9 with standard deviations between 0.81 and 1.20, suggesting a broad range of responses on every item.
Begin External Validation
There were 383 resident responses from the 5 institutions, 17 of which were removed for having at least one missing item response. Institutional N values ranged from 21 to 129.
Parallel analysis indicated 4 correlated factors. Exploratory factor analysis yielded a very good fit with root mean square error of approximation of 0 (90% CI: 0–0.054) and a Tucker-Lewis index of 1.001.
Component 1 2 3 4 5 6 7
Eigenvalue 22.2 5.7 4.1 3.6 3.0 2.6 2.5
Percent variance explained 28.5% 7.3% 5.3% 4.7% 3.8% 3.3% 3.3%
Cumulative variance explained 28.5% 35.8% 41.1% 45.7% 50% 52.9% 56.1%
Table 1. Eigenvalues and Percent Variance Explained by the First 7 Principal Components Analysis of 66 Candidate Item Ratings and 12 Anchor Scale Scores
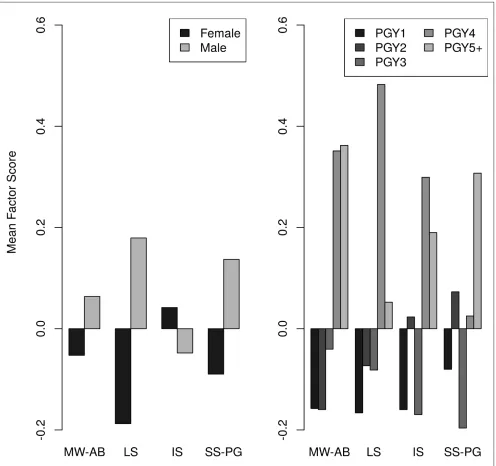
The 4 factors suggested meaningful response patterns and showed significant differences by gender and postgraduate training year.
• Meaningful work/Ability: The highest loading items on this factor related to personal meaning in work and engagement. There was a nonsignificant gender difference on these factor scores (t[355.8] = -1.07, P=ns). Factor scores increased significantly by training year (F[1,364] = 13.8, P<0.001).
• Life security: The highest loading items on this factor related to having basic needs met. Females had lower scores (t[355.8] = -3.3, P<0.001). Factor scores increased significantly by training year (F[1,364] = 6.5, P<0.025).
• Institutional support: The highest loading item on this factor related to knowing who to call when something tragic happened at work. There was a nonsignificant gender difference (t[355.8] = 0.76, P=ns). Factor scores increased significantly by training year (F[1,364] = 4.1, P<0.05).
• Social support/Personal growth: The highest loading items on this factor related to positive interactions with patients and peers. There was a nonsignificant gender difference (t[355.8] = -1.42, P=ns). Factor scores did not change significantly across training years (F[1,364] = 0.73, P=ns).
Figure 4 shows mean differences in factor scores by gender and postgraduate training year. Table 3 shows the correlation of factor scores.
DISCUSSION
The 10-item Resident Wellness Scale is a measure of aspects of resident wellness identified by residents and experts in psychosocial and professional development in graduate medical education. The scale measures residents’ perceived frequency of behaviors and experiences related to meaningful work, ability, personal growth, life security, institutional support, and social support. The scale shows evidence of reliability and validity though, as Clark and Watson point out, validity requires a continuous cycle of scale administration, analysis, and improvement.19 This
paper describes the first round of this cycle.
There is a plethora of models of wellness in the literature; the aspects of wellness identified by the expert panel and arising from the factor analysis of the Resident Wellness Scale aligned well with a 6-part framework offered by Ryff and Keyes.39 The factor structure of the
Resident Wellness Scale shows meaningful response patterns in line with this model as well. These identified factors, especially social support and meaningful
Category Mean (SD) MW-AB LS IS SS-PG
Reflected on how your work makes the world
a better place MW 3.32 (1.00) 0.66 -0.10 0.08 0.09
Felt the vitality to do your work AB 3.69 (0.95) 0.59 0.09 0.08 0.12
Felt supported by your co-workers SS 4.11 (0.83) 0.00 0.28 0.19 0.23
Had an enjoyable interaction with a patient SS 4.00 (0.86) 0.24 -0.10 0.13 0.43
Was proud of the work you did PG 3.89 (0.86) 0.33 0.11 0.00 0.40
Was eager to come back to work the next day AB 3.38 (1.05) 0.67 0.22 -0.09 0.17
You felt your basic needs are met LS 3.80 (1.01) 0.02 0.86 0.02 0.11
You ate well LS 3.61 (1.05) 0.03 0.81 0.05 -0.15
Knew who to call when something tragic
happened at work IS 3.96 (0.95) 0.01 0.03 0.89 0.00
You felt connected to your work in a deep sense MW 3.52 (1.09) 0.98 -0.01 0.02 -0.08 Table 2. Resident Wellness Scale Items, Item Categories, Means, and Standard Deviations in the
Multisite Sample (N=366) and Factor Loadings
www.aurora.org/jpcrr 25
Figure 4. Gender and postgraduate training year differences in the 4-factor scores in the external validation sample. MW-AB, meaningful work/ability; LS, life security; IS, institutional support; SS-PG, social support/personal growth.
MW-AB LS IS SS-PG
Meaningful work/Ability (MW-AB) -- 0.52 0.39 0.42
Life security (LS) -- 0.40 0.19
Institutional support (IS) -- 0.14
Social support/Personal growth (SS-PG)
--Table 3. Intercorrelations of Bartlett Factor Scores
work, are known ways in which residents recover from burnout.18 Shanafelt puts “meaning in work”
at the center of his “Driver Dimensions,” aspects of physician work-life that make the difference between burnout and engagement.7 Perceived social support has
been shown to be negatively associated with burnout,40
further suggesting it is an important aspect of resident wellness.
Future work will address limitations in the research presented herein. The definition of resident wellness is derived from one panel’s understanding of the construct of resident wellness; additional work should help refine this definition and the Resident Wellness Scale to increase generalizability. The generation of the scale is built from data on a small sample of residents. The data collection from multiple sites provided a large enough sample to warrant factor analysis, but more data are needed to demonstrate generalizability.
The scale is designed to measure longitudinal changes in resident wellness, but none of the data presented here use identifiable responses. This precludes longitudinal analysis for individual residents. However, changes in wellness at the program and institutional level can be derived from these data and used to assess the impact of wellness interventions. Further data collection in larger samples with identifiable participants will allow the introduction of new items and removal of redundant items to improve the scale’s usefulness for monitoring an individual resident’s wellness. The utility of the scale for predicting burnout and depression before it occurs needs to be demonstrated empirically.
CONCLUSIONS
Residency programs have a responsibility to monitor the wellness of the residents they train because the demands of residency are stressful. We support the argument that resident wellness is a distinct construct and that an assessment program focused on burnout and depression is insufficient.8,41 By focusing
assessment on resident wellness rather than illness, we anticipate that residency programs can improve their work and learning environments to a level that not only avoids burnout and depression, but fosters a sense of meaningful work, self-care, and social support necessary for effective professional development.
Patient-Friendly Recap
• Resident physicians, that is, doctors practicing under supervision of a senior clinician, report high levels of burnout and depression, two mental states shown to negatively impact quality of patient care.
• The authors queried dozens of residents to formulate a 10-item scale that measures resident wellness, thereby providing graduate medical education programs a valuable assessment tool.
• Their Resident Wellness Scale proved sensitive to common resident concerns, including the desire for meaningful work, life security, and institutional and social support.
Author Contributions
Study design: all authors. Data acquisition or analysis: Stansfield. Manuscript drafting: all authors. Critical revision: Stansfield,
Markova.
Conflicts of Interest
None.
References
1. Shanafelt TD, Bradley KA, Wipf JE, Back AL. Burnout and
self-reported patient care in an internal medicine residency program. Ann Intern Med. 2002;136:358-67. CrossRef
2. Shanafelt TD, Hasan O, Dyrbye LN, et al. Changes in burnout and satisfaction with work-life balance in physicians and the general US working population between 2011 and 2014. Mayo Clin Proc. 2015;90:1600-13. CrossRef
3. Fahrenkopf AM, Sectish TC, Barger LK, et al. Rates of
medication errors among depressed and burnt out residents: prospective cohort study. BMJ. 2008;336:488-91. CrossRef
4. Hall LH, Johnson J, Watt I, Tsipa A, O’Connor DB. Healthcare
staff wellbeing, burnout, and patient safety: a systematic review. PloS One. 2016;11(7):e0159015. CrossRef
5. Accreditation Council for Graduate Medical Education. ACGME Common Program Requirements. http://www. acgme.org/Portals/0/PFAssets/ProgramRequirements/ CPRs_2017-07-01.pdf. Accessed Aug. 1, 2018.
6. Raj KS. Well-being in residency: a systematic review. J Grad Med Ed. 2016;8:674-84. CrossRef
7. Shanafelt TD, Noseworthy JH. Executive leadership and
physician well-being: nine organizational strategies to promote engagement and reduce burnout. Mayo Clin Proc. 2017;92:129-46. CrossRef
8. Eckleberry-Hunt J, Lick D, Boura J, et al. An exploratory
www.aurora.org/jpcrr 27
9. Dunn LB, Iglewicz A, Moutier C. A conceptual model of medical student well-being: Promoting resilience and preventing burnout. Acad Psychiatry. 2008;32:44-53. CrossRef
10. King MF, Renó VF, Novo EM. The concept, dimensions
and methods of assessment of human well-being within a socioecological context: a literature review. Soc Indic Res. 2014;116:681-98. CrossRef
11. Danna K, Griffin RW. Health and well-being in the
workplace: a review and synthesis of the literature. J Manage. 1999;25:357-84. CrossRef
12. Ryan RM, Deci EL. On happiness and human potentials: a review of research on hedonic and eudaimonic well-being. Annu Rev Psychol. 2001;52:141-66. CrossRef
13. Roscoe LJ. Wellness: a review of theory and measurement
for counselors. J Couns Dev. 2009;87:216-26. CrossRef
14. Brady KJS, Trockel MT, Khan CT, et al. What do we mean by physician wellness? A systematic review of its definition and
measurement. Acad Psychiatry. 2018;42:94-108. CrossRef
15. Schiller JH, Stansfield RB, Belmonte DC, et al. Medical
students’ use of different coping strategies and relationship with academic performance in preclinical and clinical years. Teach Learn Med. 2018;30:15-21. CrossRef
16. Manusov EG. Happiness and residency: a qualitative study. Arch Fam Med. 1994;3:61-7.
17. Weiner EL, Swain GR, Wolf B, Gottlieb M. A qualitative study of physicians’ own wellness-promotion practices. West J Med. 2001;174:19-23.
18. Abedini NC, Stack SW, Goodman JL, Steinberg KP. “It’s
not just time off”: a framework for understanding factors promoting recovery from burnout among internal medicine residents. J Grad Med Ed. 2018;10:26-32. CrossRef
19. Clark LA, Watson D. Constructing validity: basic issues in objective scale development. Psychol Assess. 1995;7:309-19.
CrossRef
20. Mitchell DB, Brown AS, Murphy DR. Dissociations between procedural and episodic memory: effects of time and aging. Psychol Aging. 1990;5:264-76. CrossRef
21. Fraser BJ, Fisher DL. Predicting students’ outcomes from
their perceptions of classroom psychosocial environment. Am Educ Res J. 1982;19:498-518. CrossRef
22. Fraser BJ. Classroom environment instruments: development,
validity and applications. Learn Environ Res. 1998;1:7-34. 23. Wahl OF. Mental health consumers’ experience of stigma.
Schizophr Bull. 1999;25:467-78.
24. Kessler RC, Adler L, Ames M, et al. The World Health
Organization Adult ADHD Self-Report Scale (ASRS): a short screening scale for use in the general population. Psychol Med. 2005;35:245-56.
25. Maslach C, Leiter MP. Early predictors of job burnout and engagement. J Appl Psychol. 2008;93:498-512. CrossRef
26. Beck AT, Steer RA, Carbin MG. Psychometric properties
of the Beck Depression Inventory: twenty-five years of
evaluation. Clin Psychol Rev. 1988;8:77-100. CrossRef
27. Scheier MF, Carver CS, Bridges MW. Distinguishing optimism from neuroticism (and trait anxiety, self-mastery, and self-esteem): a reevaluation of the Life Orientation Test. J Pers Soc Psychol. 1994;67:1063-78. CrossRef
28. Diener ED, Emmons RA, Larsen RJ, Griffin S. The
satisfaction with life scale. J Pers Assess. 1985;49:71-5.
CrossRef
29. Crowne DP, Marlowe D. A new scale of social desirability independent of psychopathology. J Consult Psychol. 1960;24:349-54. CrossRef
30. Gosling SD, Rentfrow PJ, Swann Jr WB. A very brief
measure of the Big-Five personality domains. J Res Pers. 2003;37:504-28. CrossRef
31. Jones PW, Harding G, Berry P, Wiklund I, Chen WH, Kline Leidy N. Development and first validation of the COPD
Assessment Test. Eur Respir J. 2009;34:648-54. CrossRef
32. Anderson RT, Rajagopalan R. Development and validation of a quality of life instrument for cutaneous diseases. J Am Acad Dermatol. 1997;37:41-50. CrossRef
33. Roth PL, Switzer III FS, Switzer DM. Missing data in multiple item scales: a Monte Carlo analysis of missing data techniques. Organ Res Methods. 1999;2:211-32. CrossRef
34. Eisenbarth H, Lilienfeld SO, Yarkoni T. Using a genetic algorithm to abbreviate the Psychopathic Personality Inventory–Revised (PPI-R). Psychol Assess. 2015;27:194-202. CrossRef
35. Cook DA, Beckman TJ. Current concepts in validity
and reliability for psychometric instruments: theory and application. Am J Med. 2006;119:166.e7-16. CrossRef
36. Fabrigar LR, Wegener DT, MacCallum RC, Strahan
EJ. Evaluating the use of exploratory factor analysis in
psychological research. Psychol Methods. 1999;4:272-99.
CrossRef
37. DiStefano C, Zhu M, Mîndrilă D. Understanding and using
factor scores: considerations for the applied researcher. http://pareonline.net/getvn.asp?v=14&n=20. Pract Assess Res Eval. 2009;14(20):1-11.
38. R Core Team. R: A language and environment for statistical
computing. https://www.R-project.org/. Vienna, Austria:
R Foundation for Statistical Computing, 2013. Accessed September 6, 2018.
39. Ryff CD, Keyes CL. The structure of psychological
well-being revisited. J Pers Soc Psychol. 1995;69:719-27.
CrossRef
40. Eckleberry-Hunt J, Van Dyke A, Lick D, Tucciarone J.
Changing the conversation from burnout to wellness: physician well-being in residency training programs. J Grad Med Ed. 2009;1:225-30. CrossRef
41. Eckleberry-Hunt J, Kirkpatrick H, Barbera T. The problems
with burnout research. Acad Med. 2018;93:367-70. CrossRef
© 2019 Aurora Health Care, Inc.