O R I G I N A L A R T I C L E
Open Access
Emphysema quantification using chest CT:
influence of radiation dose reduction and
reconstruction technique
Annemarie M. den Harder
1*, Erwin de Boer
2, Suzanne J. Lagerweij
1, Martijn F. Boomsma
2,
Arnold M. R. Schilham
1, Martin J. Willemink
1, Julien Milles
3, Tim Leiner
1, Ricardo P. J. Budde
4and Pim A. de Jong
1Abstract
Background:Computed tomography(CT) emphysema quantification is affected by both radiation dose (i.e. image noise) and reconstruction technique. At reduced dose, filtered back projection (FBP) results in an overestimation of the amount of emphysema due to higher noise levels, while the use of iterative reconstruction (IR) can result in an underestimation due to reduced noise. The objective of this study was to determine the influence of dose reduction and hybrid IR (HIR) or model-based IR (MIR) on CT emphysema quantification.
Methods:Twenty-two patients underwent inspiratory chest CT scan at routine radiation dose and at 45%, 60% and 75% reduced radiation dose. Acquisitions were reconstructed with FBP, HIR and MIR. Emphysema was quantified using the 15th percentile of the attenuation curve and the percentage of voxels below -950 HU. To determine whether the use of a different percentile or HU threshold is more accurate at reduced dose levels and with IR, additional measurements were performed using different percentiles and HU thresholds to determine the optimal combination.
Results:Dose reduction resulted in a significant overestimation of emphysema, while HIR and MIR resulted in an underestimation. Lower HU thresholds with FBP at reduced dose and higher HU thresholds with HIR and MIR resulted in emphysema percentages comparable to the reference. The 15th percentile quantification method showed similar results as the HU threshold method.
Conclusions:This within-patients study showed that CT emphysema quantification is significantly affected by dose reduction and IR. This can potentially be solved by adapting commonly used thresholds.
Keywords:Densitometry, Emphysema, Radiation dosage, Thorax, Tomography (x-ray computed)
Key points
Dose reduction resulted in a significant CT overestimation of emphysema, while iterative reconstruction resulted in a significant underestimation
This can potentially be solved by adapting the commonly used densitometry thresholds The maximal intraclass correlation coefficient
between reduced dose and the reference standard
was achieved at 75% reduced dose with hybrid iterative reconstruction
Background
Chest computed tomography (CT) offers the possibility of quantifying the amount of emphysema. The number of chest CT acquisitions is expected to increase due to the favourable results of the National Lung Screening Trial [1] and the interest in subtyping chronic obstructive pulmon-ary disease (COPD) patients [2]. Additional quantification of emphysema on screening CT acquisitions will therefore likely gain importance. Furthermore, this additional infor-mation may also contribute to optimisation of the benefits and cost-effectiveness of CT screening [3]. CT can be used to both identify patients with emphysema as well as to * Correspondence:[email protected]
1Department of Radiology, University Medical Center Utrecht, Utrecht, The
Netherlands
Full list of author information is available at the end of the article
monitor progression in patients with COPD. Although em-physema is traditionally a pathology-based diagnosis [4,5], CT densitometry of the lungs has demonstrated it to be as-sociated with airflow obstruction, forced expiratory volume in 1 s and severity according to the Global initiative for chronic Obstructive Lung Disease (GOLD) criteria [6–8]. CT densitometry is based on either the 15th percentile of the attenuation curve or the percentage of voxels below -950 HU because those parameters show the strongest correlation with microscopic and macroscopic emphy-sema findings [8,9]. Although pulmonary function tests measure limitation of airflow, they are not able to dif-ferentiate between airway obstruction and emphysema-tous destruction. CT, on the other hand, provides in
vivo information about pathological changes and allows for differentiation between airway obstruction and em-physematous destruction [10].
The increasing number of chest CT scans has urged the importance of radiation dose reduction. However, dose reduction leads to higher noise levels, especially when images are reconstructed using conventional fil-tered back projection (FBP). Therefore, several iterative reconstruction (IR) techniques were developed to reduce image noise [11,12]. Recent studies showed that the ra-diation dose of unenhanced chest CT can be reduced to sub-millisievert dose levels when IR is applied [13].
It is known that CT emphysema quantification is af-fected by both radiation dose (i.e. image noise) and
reconstruction technique. At reduced dose, FBP results in an overestimation of the amount of emphysema due to higher noise levels, while the use of IR can result in an underestimation due to reduced noise [14–16].
The primary aim of the current study was to determine the effect of both dose reduction and IR on CT emphy-sema quantification using a within-patients study design. The secondary aim was to investigate whether adapting CT densitometry thresholds is a valid way to correct for over- or underestimation at reduced dose and with IR.
Methods Patients
This prospective study was approved by the local Institu-tional Review Board (NL46146.041.13) and all study partici-pants provided written informed consent. Patients aged ≥50 years scheduled for follow-up of ≥1 known small pulmonary nodules were eligible for inclusion. The in-fluence of dose reduction and IR on pulmonary nodule volume and computer-aided detection of pulmonary nodules was previously investigated in the same study population [17,18].
Image acquisition
Image acquisition was performed on a 256-slice CT system (Brilliance iCT; Philips Healthcare, Best, The Netherlands). An unenhanced chest CT was acquired during inspiration. The routine dose acquisition was performed with a tube voltage of 100 kVp (body weight < 80 kg) or 120 kV (body
weight≥80 kg). The tube current-time product was 60 mAs at routine dose and subsequently decreased to 33, 24 and 15 mAs to achieve 45%, 60% and 75% dose reduction, respectively. All four acquisitions were acquired consecu-tively in a single session. Automatic exposure control was off. Images were reconstructed at a slice thickness of 2 mm with FBP, hybrid IR (HIR; iDose level 4, Philips Healthcare, Best, The Netherlands) and model-based IR (MIR; IMR level 2, Philips Healthcare, Best, The Netherlands). Kernel filter C was used for both FBP and HIR. MIR is a more ad-vanced reconstruction technique with different kernels; therefore, the vendor-recommended kernel filter Body Routine was used for MIR. The volume CT dose index (CTDIvol) and dose-length product (DLP) of each
acquisi-tion was recorded. The effective dose was calculated by multiplying the DLP with a conversion factor of 0.0144 (100 kVp) or 0.0145 (120 kVp) [19].
Emphysema quantification
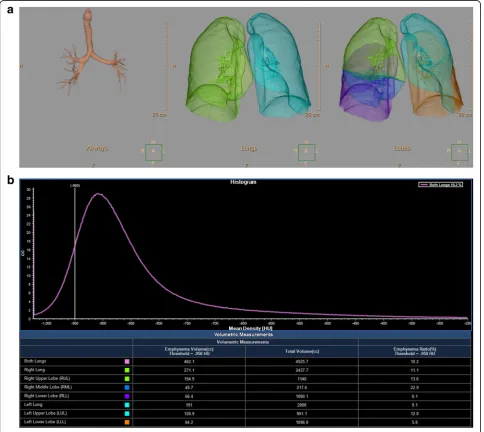
Semi-automatic commercially available software (Intelli-Space version 8, COPD tool, Philips Healthcare, Best, The Netherlands) was used for emphysema quantifica-tion. The noise reduction option in the software was not used. The software segments airways first, followed by the lungs and finally the different lobes. No manual segmentation was needed. Subsequently, a histogram (attenuation curve) is made which displays the number of voxels with a certain density (Fig. 1). Emphysema can be quantified by using either a percentile of the
Table 1Percentage of emphysema using the -950 HU threshold and the perc15method at different dose levels reconstructed with FBP, HIR and MIR
-950 HU (%) ICC (95% CI) Perc15(HU-value) ICC (95%CI)
Routine dose
FBP 5.1 (1.7–8.4) NA -923 (-936–-895) NA
HIR 1.5 (0.1–4.5)a 0.63 (0.00–0.88) -914 (-927–-881)a 0.91 (0.00–0.98)
MIR 0.9 (0.0–3.6)a 0.50 (0.00–0.80) -913 (-926–-879)a 0.88 (0.01–0.97)
45% reduced dose
FBP 8.0 (3.3–12.4)a 0.83 (0.00–0.96) -932 (-944–-898)a 0.93 (0.39–0.98)
HIR 2.5 (0.2–5.1)a 0.79 (0.01–0.94) -916 (-929–-875)a 0.89 (0.28–0.97)
MIR 1.2 (0.0–3.1)a 0.51 (0.00–0.81) -913 (-927–-867)a 0.83 (0.07–0.95)
60% reduced dose
FBP 10.2 (5.5–14.7)a 0.63 (0.00–0.89) -940 (-949–-912)a 0.77 (0.00–0.94)
HIR 2.7 (0.5–6.2)a 0.83 (0.24–0.95) -917 (-931–-881)a 0.87 (0.62–0.95)
MIR 1.3 (0.0–3.2)a 0.49 (0.00–0.79) -911 (-927–-874)a 0.80 (0.28–0.93)
75% reduced dose
FBP 14.3 (9.7–19.6)a 0.42 (0.00–0.79) -948 (-961–-925)a 0.59 (0.00–0.88)
HIR 3.5 (0.7–8.1)a 0.92 (0.76–0.97) -921 (-935–-878)a 0.94 (0.81–0.98)
MIR 0.9 (0.0–4.2)a 0.47 (0.00–0.78) -914 (-927–-869)a 0.84 (0.16–0.95)
Values represent the median (interquartile range). The ICC compares with the reference standard, namely FBP at routine dose
a
Statistically significant difference compared to FBP at routine dose with a Bonferroni correctedpvalue of 0.017
attenuation curve or the percentage of voxels below a certain HU value. On the routine dose acquisition re-constructed with FBP, emphysema was defined as a HU value which describes the lowest 15% of the segmented lungs (perc15). Furthermore, the percentage of voxels
with a HU value of -950 HU or lower (percentage emphysema) was calculated. To determine whether the use of a different percentile or HU threshold is more accurate at reduced dose levels and with IR, additional measurements were performed as follows (1 percentage and 10 HU increments):
– reduced dose FBP: perc8 – perc35 and -960 HU –
-1010 HU
– HIR:perc1–perc25and -880 HU–-960 HU
– MIR: perc1–perc20and -880 HU–-960 HU
Objective image quality
A region of interest was placed in the ascending aorta at the level of the tracheal bifurcation and in the subcuta-neous fat dorsal of the infraspinatus muscle. The noise was defined as the standard deviation of the region of interest and the contrast-to-noise ratio (CNR) was calcu-lated using the following formula:
CNR¼ ffiffiffiffiffiffiffiffiffiffiffiffiffiffiffiffiffiffiffiffiffiffiffiffiffiffiffiffiffiffiffiffiffiffiffiffiffiffiffiffiffiffiffiffiffiffiffiffiffiffiffiffiffiffiffiffiffiffiffiffiMean Aortað Þ−Mean Fatð Þ 1
2 SD Aortað Þ
2þ
SD Fatð Þ2
r
Statistics
Statistical analysis was performed using SPSS version 21 (SPSS Inc., Chicago, IL, USA). The routine dose acquisi-tion reconstructed with FBP was used as the reference standard. The Friedman test was used to compare the reconstructions at each dose level to FBP and post-hoc analyses were performed with the Wilcoxon signed rank test. A p value < 0.05 was considered significant for the Friedman test, while a Bonferroni corrected p value of 0.017 (0.05/3 reconstructions) was used for the Wilcoxon test. The intraclass correlation coefficient (ICC; two-way mixed, absolute agreement, single measures) was used to compare reduced dose and iterative reconstruction to the reference standard. For each dose level and recon-struction technique, the optimal adapted threshold for emphysema quantification was determined. The opti-mal adapted threshold was also compared to the reference standard using Bland–Altman plots. Results are displayed as median (interquartile range) unless specified otherwise.
Results
Twenty-two patients were included. Half of the patients (n= 11) were female. Ten patients (46%) were scanned
with 100 kVp (< 80 kg) and twelve patients (54%) with 120 kVp (≥ 80 kg). The median height of the patients was 169 cm (163–176 cm) and the median weight was 83 kg (74–92 kg) resulting in a body mass index of 28.6 kg/m2 (26.0–31.4 kg/m2). The median CTDIvol was
4.1 mGy at routine dose and 2.2, 1.6 and 1.0 mGy at re-duced dose levels for the 120-kVp acquisitions. For the 100-kVp acquisition, the median CTDIvol was 2.4, 1.3,
1.0 and 0.6 mGy, respectively. The median DLP was 150 (96–169), 84 (53–93), 60 (38–66) and 39 (24– 42) mGy ×cm, respectively, resulting in median effective dose levels of 2.2 (1.4–2.4), 1.2 (0.8–1.3), 0.9 (0.5–1.0) and 0.6 (0.3–0.6) mSv.
Emphysema
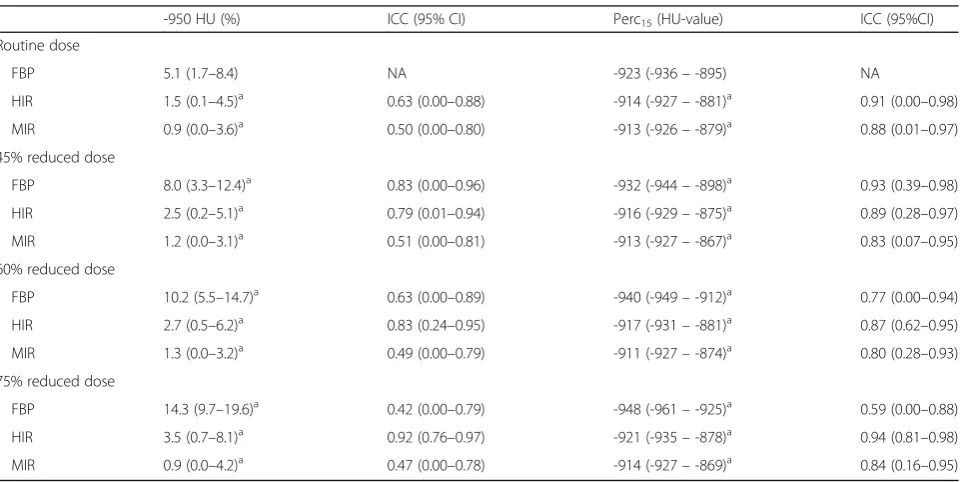
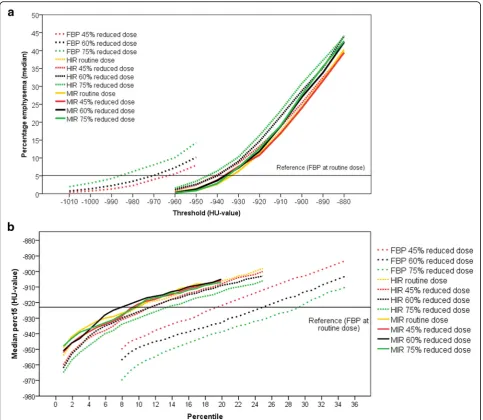
The percentage of emphysema with FBP at routine dose was 5.1% (1.7–8.4%). FBP at reduced dose resulted in a significant overestimation of the percentage of emphy-sema, while HIR and MIR resulted in a significant underestimation at all dose levels compared to FBP at routine dose (Table1, Fig.2). The perc15measurements
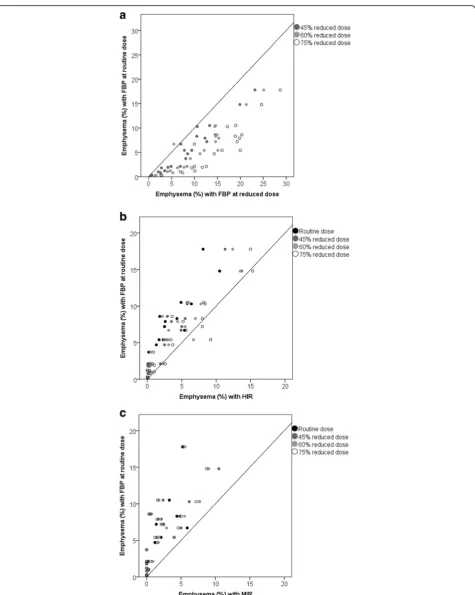
resulted in decreased HU values for FBP at reduced dose, while HIR and MIR resulted in significantly in-creased HU values compared to FBP at routine dose (Table1, Fig.3). For the -950 HU threshold, HIR at 75% reduced dose resulted in the highest ICC of 0.92 (0.76– 0.97), while the ICC decreased to 0.42 (0.00–0.79) with FBP at 75% reduced dose. Overall, the ICC was better with the perc15 method, resulting in a minimum ICC of
0.59 (0.00–0.88) with FBP at 75% reduced dose and a maximum ICC of 0.94 (0.81–0.98) with HIR at 75% re-duced dose.
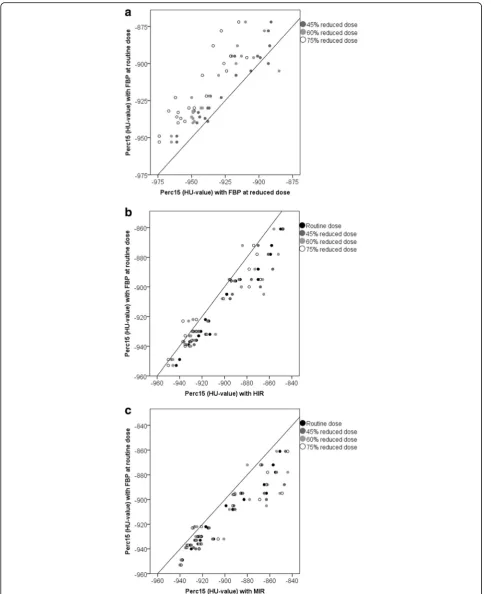
The effect of using different HU thresholds or percen-tiles is shown in Fig.4. Data for each threshold are pro-vided in the supplemental files (Additional file 1: Table S1–S4). With FBP at reduced dose, using a lower thresh-old of -960 HU, -970 HU and -980 HU at 45%, 60% and 75% reduced dose, respectively, resulted in a percentage of emphysema that was not significantly different from the reference standard. For HIR, a threshold of -930 HU (rou-tine dose) or -940 HU (reduced dose) approximated the percentage emphysema with FBP at routine dose, while this was -930 HU for MIR (all dose levels). Bland-Altman plots are provided in Additional file 2: Figure S1 of the supplemental files. The adapted threshold worked well over the whole range of patients for FBP at reduced dose, while with HIR and MIR there was a trend towards under-estimation in patients with a small emphysema percentage and in patients with a higher percentage of emphysema there was an overestimation.
Fig. 3Scatterplotsof the effect of radiation dose and reconstruction on the perc15. They-axisdisplays the perc15with FBP at routine dose
(reference), while thex-axisdisplays the perc15at reduced dose with FBP (a) and with HIR (b) and MIR (c). Values below the diagonal represent a
was required of 8% (routine dose), 10% (45% reduced dose), 11% (60% reduced dose) or 13% (75% reduced dose) with HIR and 8% (all dose levels) with MIR. Bland–Altman plots are provided in Additional file 2: Figure S2 of the supplemental files. The adapted thresh-old worked well over the whole range of patients for all reconstructions.
Image quality
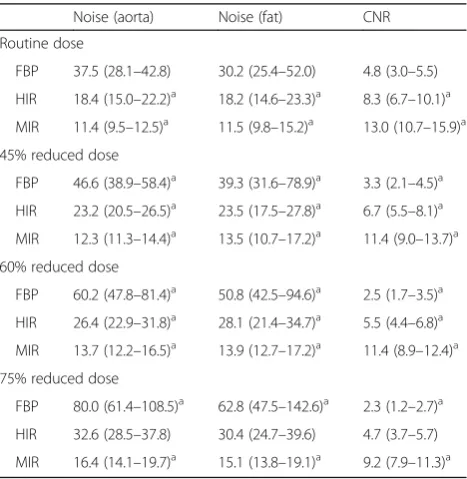
Noise and CNR are presented in Fig. 5 and Table 2. Noise increased with FBP at reduced dose levels, while HIR and MIR resulted in reduced noise. Noise was sig-nificantly lower with HIR at routine dose, 45% reduced dose and 60% reduced dose compared to the reference
standard, while at the lowest dose level noise was comparable to FBP at routine dose. MIR resulted in a significant reduction of noise at all reduced dose levels compared to FBP at routine dose. CNR de-creased with FBP at reduced dose levels. HIR and MIR resulted in comparable or improved CNR at all reduced dose levels.
Discussion
This study shows the effect of different reconstruction techniques at four decreasing radiation dose levels. While FBP resulted in an overestimation of emphysema on CT at reduced dose, both HIR and MIR resulted in an under-estimation of the amount of emphysema compared to
reconstruction of the images with FBP at routine dose. Furthermore, we showed that by using different thresh-olds or percentages in HIR and MIR, it was possible to derive results comparable to FBP at routine dose.
There are two commonly used measures to quantify em-physema on CT based on densitometry, namely the density at the 15th percentile of the attenuation curve and the per-centage of voxels below -950 HU. Previous studies indi-cated that those thresholds show the strongest correlation
with microscopic and macroscopic emphysema findings in studies using FBP [8,9]. The 15th percentile and the -950 HU thresholds are widely used; however, different thresh-olds have been applied in the literature [8,9,20,21]. Several other studies have investigated the effect of dose and image reconstruction on pulmonary emphysema quantification. Schilham et al. [22] compared a clinical routine dose CT ac-quisition with a low dose acac-quisition in 25 patients. A post-processing filter was used to reduce the amount of noise in the low dose images and three different thresholds (-950, -930 and -910 HU) were used to quantify emphy-sema. The application of the filter resulted in a reduction of the effect of noise on the emphysema percentage. A differ-ent study by Mets et al. [23] in 75 patients who underwent a routine dose CT acquisition reconstructed with FBP and HIR reported an underestimation of the amount of emphy-sema with HIR when the cut-off was not adjusted. In a study by Nishio et al. [24], the application of IR at reduced dose improved the agreement in emphysema quantification with routine dose FBP. Three studies comparing a routine dose acquisition with a low-dose acquisition in the same patient all reported an overestimation with low-dose FBP while IR resulted in an underestimation [25–27]. Messerli et al. [27] reduced the radiation dose to chest x-ray equiva-lent dose levels of 0.14 mSv; at this dose level, HIR resulted in a similar emphysema measurement as FBP at routine dose (1.7 mSv). Similar results were found in the study by Nishio et al. [28]. Therefore, by carefully selecting the dose reduction level, emphysema overestimation can be com-pensated for by using IR, since the latter results in reduced emphysema with CT quantification. To our best know-ledge, only the study by Choo et al. [15] investigated the ef-fects of both HIR and MIR. No dose reduction was used and they reported that MIR resulted in a larger underesti-mation than HIR compared to FBP, which is comparable to the results of the current study.
Fig. 5Noise (aandb) and CNR (c) measured at different dose levels with FBP, HIR and MIR. Noise was measured in the aorta (a) and subcutaneous fat (b). Thedotted linerepresents the reference (FBP at routine dose).CNRcontrast-to-noise ratio,FBPfiltered back projection,HIRhybrid iterative reconstruction,MIRmodel-based iterative reconstruction
Table 2Noise and CNR at different dose levels with FBP, HIR and MIR
Noise (aorta) Noise (fat) CNR
Routine dose
FBP 37.5 (28.1–42.8) 30.2 (25.4–52.0) 4.8 (3.0–5.5)
HIR 18.4 (15.0–22.2)a 18.2 (14.6–23.3)a 8.3 (6.7–10.1)a MIR 11.4 (9.5–12.5)a 11.5 (9.8–15.2)a 13.0 (10.7–15.9)a 45% reduced dose
FBP 46.6 (38.9–58.4)a 39.3 (31.6–78.9)a 3.3 (2.1–4.5)a HIR 23.2 (20.5–26.5)a 23.5 (17.5–27.8)a 6.7 (5.5–8.1)a MIR 12.3 (11.3–14.4)a 13.5 (10.7–17.2)a 11.4 (9.0–13.7)a 60% reduced dose
FBP 60.2 (47.8–81.4)a 50.8 (42.5–94.6)a 2.5 (1.7–3.5)a HIR 26.4 (22.9–31.8)a 28.1 (21.4–34.7)a 5.5 (4.4–6.8)a MIR 13.7 (12.2–16.5)a 13.9 (12.7–17.2)a 11.4 (8.9–12.4)a 75% reduced dose
FBP 80.0 (61.4–108.5)a 62.8 (47.5–142.6)a 2.3 (1.2–2.7)a HIR 32.6 (28.5–37.8) 30.4 (24.7–39.6) 4.7 (3.7–5.7)
MIR 16.4 (14.1–19.7)a 15.1 (13.8–19.1)a 9.2 (7.9–11.3)a Values are presented as median (interquartile range)
a
Statistically significant difference compared to FBP at routine dose with a Bonferroni correctedpvalue of 0.017
The effect of reconstruction technique and radiation dose can be explained by the density histogram. IR algo-rithms result in a different density distribution, which subsequently affects emphysema quantification. Due to the noise reduction with IR, the extremes of the attenu-ation distribution are affected [23], leading to a smaller peak in the density histogram. Dose reduction, on the other hand, results in increased image noise, leading to a broadening of the density histogram [29].
In the current study, FBP at routine dose was used as the reference standard. However, ideally a pathological ref-erence standard should be applied or a realistic phantom to determine what is closest to the truth and if thresholds should be adapted. It is important to be aware that differ-ences in emphysema quantification can occur and to keep the radiation dose and reconstruction algorithm constant in longitudinal follow-up studies.
Although this within-patient study systematically assessed the effect of dose and reconstruction on emphysema quan-tification, there are several limitations. First, the patients included in this study had a low amount of emphysema. Second, the sample size was relatively low; however, due to the within-patients study design, the statistical power of the study was increased. Although we showed that adapting the commonly used thresholds can prevent underestima-tion of emphysema with IR, the sample size was too small to give a clear recommendation about the optimal thresh-old. Third, one software package and IR algorithms from only one vendor were studied and results may differ for other packages and other vendors. Fourth, only an inspira-tory chest CT was acquired; therefore, air-trapping could not be studied. Fifth, the effect of slice thickness and reconstruction kernel were not investigated in the current article. Gierada et al. [30] investigated the effect of recon-struction kernel and slice thickness and reported that pa-tients with 10–30% emphysema are most sensitive for the effect of kernel and slice thickness, while lower emphy-sema percentages (such as in the current study) resulted in more stable measurements.
In conclusion, as compared to FBP at routine dose, both HIR and MIR result in an underestimation of CT emphysema at routine dose and reduced dose while FBP results in an overestimation at reduced dose. This can potentially be solved by using adapted thresholds.
Additional files
Additional file 1:Table S1.Effect of different HU thresholds on emphysema quantification. Values represent the median [interquartile range] percentage emphysema at each dose level with FBP, HIR and MIR.FBPfiltered back projection,HIRhybrid iterative reconstruction;MIRmodel-based iterative reconstruction,NAnot applicable.Table S2.Effect of different percentiles on emphysema quantification. Values represent the median [interquartile range] HU value at each dose level with FBP.FBPfiltered back projection;NA
not applicable.Table S3.Effect of different percentiles on emphysema
quantification. Values represent the median [interquartile range] HU value at each dose level with HIR.HIRhybrid iterative reconstruction;
NAnot applicable.Table S4.Effect of different percentiles on emphysema quantification. Values represent the median [interquartile range] HU value at each dose level with MIR.MIRmodel-based iterative reconstruction. (DOCX 35 kb)
Additional file 2:Figure S1.Bland–Altman plots for the differences in percentage emphysema when comparing the optimal adapted threshold at each dose level to FBP at routine dose using a−950 HU threshold. The continuous line represents the mean difference to the reference standard while the dotted lines represent the upper and lower limits of agreement (95% limits of agreement). FBP filtered back projection, HIR hybrid iterative reconstruction; MIR model-based iterative reconstruction.
Figure S2.Bland–Altman plots for the differences in HU value when comparing the optimal adapted threshold at each dose level with FBP at routine dose using the perc15 method. The continuous line represents the mean difference to the reference standard while the dotted lines represent the upper and lower limits of agreement (95% limits of agreement). FBP filtered back projection; HIR hybrid iterative reconstruction; MIR model-based iterative reconstruction. (PDF 578 kb)
Abbreviation
CNR:Contrast-to-noise ratio; COPD: Obstructive pulmonary disease; CT: Computed tomography; CTDIvol: Volume CT dose index; DLP: Dose-length product; FBP: Filtered back projection; HIR: Hybrid IR; ICC: Intraclass correlation coefficient; IR: Iterative reconstruction; MIR: Model-based IR
Availability of data and materials
The datasets generated during and/or analysed during the current study are available from the corresponding author on reasonable request.
Funding
The authors state that this work has not received any funding.
Acknowledgements
The authors would like to thank Ilse van Rein and Sylvia van der Werf for their help with the data collection.
Authors’contributions
Data collection: AH, SL. Data analysis and interpretation: AH, SL, EB. Drafting the article: AH, SL, EB. All authors read and approved the final manuscript.
Ethics approval and consent to participate
Institutional Review Board approval was obtained. Written informed consent was obtained from all subjects (patients) in this study.
Consent for publication
All authors provided consent for publication.
Competing interests
Julien Milles is an employee of Philips Healthcare. All other authors declare that they have no competing interests.
Publisher’s Note
Springer Nature remains neutral 12with regard to jurisdictional claims in published maps and institutional affiliations.
Author details
1Department of Radiology, University Medical Center Utrecht, Utrecht, The
Netherlands.2Department of Radiology, Isala hospital, Zwolle, The Netherlands.3Philips Healthcare, Best, The Netherlands.4Department of
Radiology, Erasmus Medical Center, Rotterdam, The Netherlands.
Received: 5 June 2018 Accepted: 6 August 2018
References
2. Pompe E, Galbán CJ, Ross BD et al (2017) Parametric response mapping on chest computed tomography associates with clinical and functional parameters in chronic obstructive pulmonary disease. Respir Med 123:48–55 3. Mets OM, Schmidt M, Buckens CF et al (2013) Diagnosis of chronic obstructive
pulmonary disease in lung cancer screening computed tomography scans: independent contribution of emphysema, air trapping and bronchial wall thickening. Respir Res 14:59
4. Madani A, Van Muylem A, de Maertelaer V, Zanen J, Gevenois PA (2008) Pulmonary emphysema: size distribution of emphysematous spaces on multidetector CT images--comparison with macroscopic and microscopic morphometry. Radiology 248:1036–1041
5. Madani A, Zanen J, de Maertelaer V, Gevenois PA (2006) Pulmonary emphysema: objective quantification at multi-detector row CT—comparison with macroscopic and microscopic morphometry. Radiology 238:1036–1043 6. Mohamed Hoesein FA, de Jong PA (2016) Landmark papers in respiratory
medicine: automatic quantification of emphysema and airways disease on computed tomography. Breathe (Sheff) 12:79–81
7. Mohamed Hoesein FA, de Hoop B, Zanen P et al (2011) CT-quantified emphysema in male heavy smokers: association with lung function decline. Thorax 66:782–787
8. Ostridge K, Wilkinson TM (2016) Present and future utility of computed tomography scanning in the assessment and management of COPD. Eur Respir J 48:216–228
9. Bankier AA, De Maertelaer V, Keyzer C, Gevenois PA (1999) Pulmonary emphysema: subjective visual grading versus objective quantification with macroscopic morphometry and thin-section CT densitometry. Radiology 211:851–858
10. Pistolesi M (2009) Beyond airflow limitation: another look at COPD. Thorax 64:2–4 11. Willemink MJ, de Jong PA, Leiner T et al (2013) Iterative reconstruction
techniques for computed tomography part 1: technical principles. Eur Radiol 23:1623–1631
12. Willemink MJ, Leiner T, de Jong PA et al (2013) Iterative reconstruction techniques for computed tomography part 2: initial results in dose reduction and image quality. Eur Radiol 23:1632–1642
13. den Harder AM, Willemink MJ, de Ruiter QM et al (2015) Achievable dose reduction using iterative reconstruction for chest computed tomography: a systematic review. Eur J Radiol 84:2307–2713
14. Baumueller S, Winklehner A, Karlo C et al (2012) Low-dose CT of the lung: potential value of iterative reconstructions. Eur Radiol 22:2597–2606 15. Choo JY, Goo JM, Lee CH, Park CM, Park SJ, Shim MS (2014) Quantitative analysis
of emphysema and airway measurements according to iterative reconstruction algorithms: comparison of filtered back projection, adaptive statistical iterative reconstruction and model-based iterative reconstruction. Eur Radiol 24:799–806 16. Neroladaki A, Botsikas D, Boudabbous S, Becker CD, Montet X (2013) Computed
tomography of the chest with model-based iterative reconstruction using a radiation exposure similar to chest X-ray examination: preliminary observations. Eur Radiol 23:360–366
17. den Harder AM, Willemink MJ, van Hamersvelt RW et al (2016) Effect of radiation dose reduction and iterative reconstruction on computer-aided detection of pulmonary nodules: intra-individual comparison. Eur J Radiol 85:346–351 18. den Harder AM, Willemink MJ, van Hamersvelt RW et al (2016) Pulmonary
nodule volumetry at different low computed tomography radiation dose levels with hybrid and model-based iterative reconstruction: a within patient analysis. J Comput Assist Tomogr 40:578–583
19. Deak PD, Smal Y, Kalender WA (2010) Multisection CT protocols: sex- and age-specific conversion factors used to determine effective dose from dose-length product. Radiology 257:158–166
20. Hackx M, Bankier AA, Gevenois PA (2012) Chronic obstructive pulmonary disease: CT quantification of airways disease. Radiology 265:34–48 21. Madani A, De Maertelaer V, Zanen J, Gevenois PA (2007) Pulmonary
emphysema: radiation dose and section thickness at multidetector CT quantification--comparison with macroscopic and microscopic morphometry. Radiology 243:250–257
22. Schilham AM, van Ginneken B, Gietema H, Prokop M (2006) Local noise weighted filtering for emphysema scoring of low-dose CT images. IEEE Trans Med Imaging 25:451–463
23. Mets OM, Willemink MJ, de Kort FP et al (2012) The effect of iterative reconstruction on computed tomography assessment of emphysema, air trapping and airway dimensions. Eur Radiol 22:2103–2109
24. Nishio M, Koyama H, Ohno Y et al (2016) Emphysema quantification using ultralow-dose CT with iterative reconstruction and filtered back projection. AJR Am J Roentgenol 206:1184–1192
25. Wang R, Sui X, Schoepf UJ et al (2015) Ultralow-radiation-dose chest CT: accuracy for lung densitometry and emphysema detection. AJR Am J Roentgenol 204: 743–749
26. Nishio M, Matsumoto S, Ohno Y et al (2012) Emphysema quantification by low-dose CT: potential impact of adaptive iterative dose reduction using 3D processing. AJR Am J Roentgenol 199:595–601
27. Messerli M, Ottilinger T, Warschkow R et al (2017) Emphysema quantification and lung volumetry in chest X-ray equivalent ultralow dose CT - intra-individual comparison to standard dose CT. Eur J Radiol 91:1–9 28. Nishio M, Matsumoto S, Seki S et al (2014) Emphysema quantification on
low-dose CT using percentage of low-attenuation volume and size distribution of low-attenuation lung regions: effects of adaptive iterative dose reduction using 3D processing. Eur J Radiol 83:2268–2276
29. Yuan R, Mayo JR, Hogg JC et al (2007) The effects of radiation dose and CT manufacturer on measurements of lung densitometry. Chest 132:617–623 30. Gierada DS, Bierhals AJ, Choong CK et al (2010) Effects of CT section thickness