DOI: 10.5958/2230-732X.2016.00108.X
©2016 New Delhi Publishers. All rights reserved
AGRICULTURE EXTENSION
Marginal and small farmers’ climate change perception and
adaptation
C.K. Panda
*and S.R. Singh
Department of Extension Education, Bihar Agricultural University, Sabour, Bhagalpur-813 210, India *Corresponding author : [email protected]
Paper No. 511 Received: 14-2-2016 Accepted: 17-9-2016
Abstract
Climate change refers to any change in climate over time, whether due to natural variability or/and as a result of human activity and adaptation to climate change requires that farmers first notice that the climate has changed, and then identify useful adaptations and implement them. The marginal and small farmers were highly vulnerable to climate change. The likely consequences of climate change on the water front in Tripura are decrease in total annual rainfall, change in rainfall pattern resulted in crop failure. The present research was conducted in West Tripura district of Tripura state and sample size was 150. Results suggested that perception of farmers on current climate condition ranged from bad to very bad and there were increase of crop, animal and human diseases; and also number of hot days and sun’s heat had increased too, whereas rainfall days and annual rainfall had decreased. Major identified adjustment factors by farmers were decreased use of irrigation water, change in planting date, find off-farm job and alternative livestock feed supplements. However, off-farmers’ perceived barriers to climate change adjustment were lack of weather information, problem with getting inputs, lack of knowledge about adaptations and lack of information about climate change.
Highlights
• Farmers had clear perception on climate change effects on farming.
• Major adaptation strategies were use of irrigation water, change in planting date, find off-farm job and alternative livestock feed supplements.
Keywords: Farmers perception, climate change, adaptation, information sources
Climate change refers to any change in climate over time, whether due to natural variability or/ and as a result of human activity (IPCC 2007a). In developing countries, climate change will cause yield declines for the most important crops and price increases for the most important agricultural produces viz. rice, wheat, maize, and soybeans (Nelson, et al., 2009), biomass declining with increasing temperature (Rawson et al., 1995). The
climate change impacts on pests may include shifts
in species distributions(Chandra 2012) and the climatic variation as occurrence of drought have significant impact on the production of rainfed crops (Asha latha et al., 2012). The soil system
responds to short-term events such as rainfall and
also undergoes long-term changes such as physical
and chemical weathering due to climate change (Chakrabarti et al., 2012).
Although, most farmers attributed climate change to
supernatural forces (Nyanga et al., 2011), however, adaptation to climate change requires that farmers
first notice that the climate has changed, and then
side and negatively through shifting to other professions (Asha latha et al., 2012).
North East India is subject to climate induced vulnerability currently and in the near future. Climate change will be an additional stress and
will have direct consequences on food-production
systems and indirect impacts on food security. An estimated 3.5 mha is under rainfed rice cultivation in this region, which accounts for about 30% of the total area under cultivation (Judge et al., 2012).
Drought of 2006 in north-east which left the people
in peril, amply indicate the climatic anomalies (Pathak, et al., 2012), precipitation in one subdivision in the Brahmaputra basin shows a decreasing trend and another shows an increasing trend.
One of the three subdivisions in the Meghna basin shows a decreasing trend while another shows an increasing trend (Judge et al., 2012). The likely consequences of climate change on the water front in Tripura are decrease in total annual rainfall,
change in rainfall pattern resulting in crop failure for not getting the rain when required and sudden
bursts of rain over a small period of time which may
cause floods. Droughtnormally occurs in the State of Tripura due to delayed rainfall in the months of
April-May (Tripura State Action Plan on Climate
Change 2011). Climate variability and climate change could impact agriculture, water resources and forest sectors in this region. The Vulnerability
Index of Agriculture, Water and Forest sectors of
study area i.e. West Tripura district were calculated by Ravindranath et al. (2011). From their study on
the basis Vulnerability Index(VI) Ranging from 0 to 5 (i.e. Low to High), the Agriculture sector
current VI was 1-2 and future projection would
remain same; for Water sector, current and future VI was same i.e. 4 – 5, and in forest sector VI was
3 – 4 for Current and Future. Under this backdrop
present research was conducted with the following objectives:
1. To assess the farmers extension exposure. 2. To study the farmers observation on climate
change.
3. To identify the farmers’ climate change adjustment factors.
4. To find out the farmers’ adaptation barriers
under changing climate.
Materials and Methods
Tripura is the third smallest State of India located in the North Eastern Region of the country. West Tripura district was purposively selected and there
were six blocks in West Tripura district. From six
blocks Mohanpur and Lefunga blocks were selected randomly. The Questionnaire was pretested over 15
number non-respondent marginal and small farmers
(i.e. 10% of total respondents) and pertinent changes were made. Marginal and small farmers having farming was main occupation and minimum 15 years of farming experiences were within the sample
frame. From this sample frame 150 farmers were
selected randomly. Although questionnaire were prepared in English language, but during interview it was translated to local language. The study was carried out during March, 2014 to August, 2014. The questionnaire developed by Gbetibouo (2009) with
some modification were employed for the study.
The statistical tools included were mean, percentage, Standard Deviation, Rank and Pearson’s correlation
coefficient. For analysis of data IBM SPSS 21 was
employed.
Results and Discussion
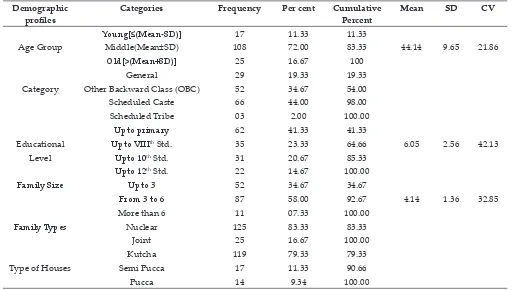
It was noted that the most of the respondents belonged to the middle age group i.e. 72%, and old age group was 16.67%, however, young age group included 11.33% with CV 21.68%. It was also noted that 44.00% respondents were from Scheduled Caste family and OBC category respondents were 34.67%, whereas Scheduled Tribe were only 2% and General Category was only 19.33%. The perusal of the table indicated that 41.33% respondents had the education upto primary level, while 14.67% respondents were in the education level of upto 12th standard. The CV was 42.13%. Most of the
households’ family members ranged between 3 to
6 and in quantification, it was 58.00%.
65.12% respondents had motorbikes and bicycles respectively. Concerning agricultural implements, it was found that 18.60%, 53.49% and 81.40% respondents had power tiller, country plough and sprayers respectively.
Table 2: Distribution of respondents as per their Wealth occupancy
n = 150
Types of Wealth Per cent
Television 62.35
Radio 34.83
Cell phone 90.69
Motorbike 23.26
Bicycle 65.12
Power tiller 18.60
Country Plough 53.49
Sprayer 81.40
Cattle 62.79
Pig 9.30
Hen 67.44
Animal resources recorded were cattle, pig and hen, however, it was noted that 9.30% respondents had pig, it might be due to the fact that pig rearing was predominant among tribal farmers, whereas
only 2% respondents belonged to tribal category (Table 2). The perusal of table 3 revealed that 39.33% farmers had the farming experience in between 20 to 25 years and 32.67% respondents had 25 to 30 years of farming experience.
Table 3: Distribution of respondents according to their farming experiences
n = 150 Farming
experience (Years)
Frequency Percent Cumulative
Percent Mean SD CV
15 to20 21 14.00 14.00
22.91 1.01 4.40 >20 to ≤25 59 39.33 53.33
>25 to ≤30 49 32.67 86.00 >30 21 14.00 100.
There were different sources for receiving information in rural domain and for the present
study twelve sources were selected and five point Likert Scale (i.e. Most often, Often, Sometime, Rarely
and Never) were used for receiving the response. One the basis of the response Weighted Means were calculated. As the Cronbach’s alpha was 0.725(N=12) which higher than 0.70, hence the scale had passed the reliability or internal consistence test (Table 4).
Table 1: Distribution of respondents according to their Demographic profiles
n = 150 Demographic
profiles Categories Frequency Per cent Cumulative Percent Mean SD CV
Age Group
Young[≤(Mean-SD)] 17 11.33 11.33
44.14 9.65 21.86
Middle(Mean±SD) 108 72.00 83.33
Old[>(Mean+SD)] 25 16.67 100
Category
General 29 19.33 19.33
Other Backward Class (OBC) 52 34.67 54.00
Scheduled Caste 66 44.00 98.00
Scheduled Tribe 03 2.00 100.00
Educational Level
Upto primary 62 41.33 41.33
6.05 2.56 42.13
Upto VIIIth Std. 35 23.33 64.66
Upto 10th Std. 31 20.67 85.33
Upto 12th Std. 22 14.67 100.00
Family Size Upto 3 52 34.67 34.67
4.14 1.36 32.85
From 3 to 6 87 58.00 92.67
More than 6 11 07.33 100.00
Family Types Nuclear 125 83.33 83.33
Joint 25 16.67 100.00
Type of Houses
Kutcha 119 79.33 79.33
Semi Pucca 17 11.33 90.66
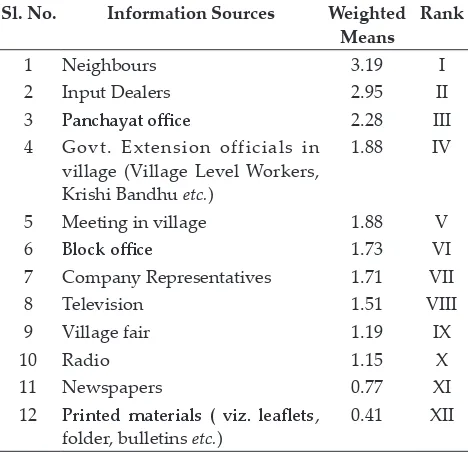
Table 4: Ranking on extend of Information Sources utilization by farmers
n = 150 Sl. No. Information Sources Weighted
Means Rank
1 Neighbours 3.19 I
2 Input Dealers 2.95 II
3 Panchayat office 2.28 III
4 Govt. Extension officials in village (Village Level Workers, Krishi Bandhu etc.)
1.88 IV
5 Meeting in village 1.88 V
6 Block office 1.73 VI
7 Company Representatives 1.71 VII
8 Television 1.51 VIII
9 Village fair 1.19 IX
10 Radio 1.15 X
11 Newspapers 0.77 XI
12 Printed materials ( viz. leaflets,
folder, bulletins etc.) 0.41 XII
It was noted that neighbours were the most important source of information for the respondents and accordingly it was ranked first. Input Dealers, Panchayat Office and Government Extension officials were second, third and fourth important sources of information to the farmers. However, it was surprised to note that Printed materials were least important information source; it might be due to its scarce availability in rural domain. Again, it was more surprised to note that, the radio was also least important information sources along with newspapers too. This might be another important
topic of future research. Although, it was fact that
the two blocks were adjacent to India-Bangladesh
International Boarder where, radio broadcasting might have restriction (Table 4).
It was observed that own observation was the paramount weather related information source to the farmers and weighted mean was highest. Hence, it was ranked first. The second most important weather information sources were Neighbour
and it implied that till now in rural ambience neighbour played proactive communication role for information sharing and percolation. Television
and VLWs were third and fourth important sources for weather related information to the respondents. However, the Newspaper was least important weather information source, it might be due to the price of newspaper was recurring investment and as most of the respondents education up to primary level (Table 5).
Table 5: Ranking on extend of Information Sources
utilization by farmers for getting weather information
n = 150
Information Sources Weighted
mean Rank
Own observation 3.6 I
Neighbours 2.99 II
Television 1.23 III
Village Level Workers (VLWs) 1.18 IV
Radio 0.87 V
Newspaper 0.62 VI
Table 6: Farmers observation on climate change
n = 150
Perception on climate change Level of perception
Increased Decreased Constant Unsure
Wind speed last 15 years 14.63% 12.19% 36.59% 36.59%
Frequency of dry days in monsoon period last 10 years 69.05% 16.67% 2.38% 11.90%
Incidence of crop diseases last 10 years 82.92% 4.88% 4.88% 7.32%
Incidence of animal disease last 10 years 52.38% 28.57% 11.91% 7.14%
Incidence of human diseases last 15 years 80.00% 5.00% 5.00% 10.00%
Increased Decreased Constant
Number of hot days last 15 years 95.35% 4.65% .00
Sun’s heat last 15 years 83.33% 4.76% 11.91%
Number of rainfall days last 15 years 11.64% 79.06% 9.30%
Rainfall last 15 years 13.95% 76.75% 9.30%
Temperature last 15 years 100% .00 .00
Good Bad Very bad Constant
The perusal of table 6 showed that the respondents current perception on climate change is consolidated from bad to very bad and it was 46.51% and 25.58% respectively, whereas 23.26% farmers perceived that the climate was good, although 4.65% farmers considered it was constant. It was also noted that the diseases of crop and human were inclined in trend as perceived by majority of the respondents, however 52.38% respondents deemed that animal disease had increased. It was also noted that frequency of dry days in monsoon period had increased in last 10 years as perceived by 69.05% respondents. It was noted from the above table that 95.35% and 83.33% respondents perceived that number of hot days and sun’s heat had increased respectively, whereas rainfall days and annual rainfall had decreased as reported by 79.06% and 76.75% respondents. It was interesting to note 100%
farmers perceived that temperature had increased last 15 years.
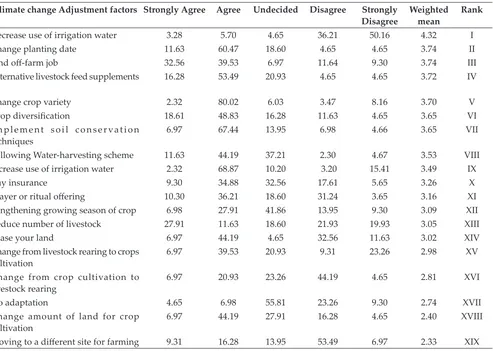
Table 7 represented the farmers’ perception on climate change adjustment practices and factors. It was noted that decrease use of irrigation water was the most appropriate agronomic practice might help in climate change adjustment and it was ranked First. Change of planting date was the second most important practices as perceived
the respondents. Find off-farm job and alternative
livestock feed supplements were third and fourth
ranked perceived adjustment factors to the farmers. Change of crop variety and crop diversification were also the adjustment factors as observed by the farmers and those were ranked fifth and sixth respectively. However, moving to a different site
for farming were least perceived adjustment factors as reported by farmers. Thomas et al. (2007) also
Table 7: Farmers perception on climate change adjustment practices and factors (From agreement to
disagreement)
n = 150 Climate change Adjustment factors Strongly Agree Agree Undecided Disagree Strongly
Disagree Weighted mean Rank
Decrease use of irrigation water 3.28 5.70 4.65 36.21 50.16 4.32 I
Change planting date 11.63 60.47 18.60 4.65 4.65 3.74 II
Find off-farm job 32.56 39.53 6.97 11.64 9.30 3.74 III
Alternative livestock feed supplements 16.28 53.49 20.93 4.65 4.65 3.72 IV
Change crop variety 2.32 80.02 6.03 3.47 8.16 3.70 V
Crop diversification 18.61 48.83 16.28 11.63 4.65 3.65 VI
Implement soil conservation
techniques 6.97 67.44 13.95 6.98 4.66 3.65 VII
Following Water-harvesting scheme 11.63 44.19 37.21 2.30 4.67 3.53 VIII Increase use of irrigation water 2.32 68.87 10.20 3.20 15.41 3.49 IX
Buy insurance 9.30 34.88 32.56 17.61 5.65 3.26 X
Prayer or ritual offering 10.30 36.21 18.60 31.24 3.65 3.16 XI
Lengthening growing season of crop 6.98 27.91 41.86 13.95 9.30 3.09 XII
Reduce number of livestock 27.91 11.63 18.60 21.93 19.93 3.05 XIII
Lease your land 6.97 44.19 4.65 32.56 11.63 3.02 XIV
Change from livestock rearing to crops
cultivation 6.97 39.53 20.93 9.31 23.26 2.98 XV
Change from crop cultivation to
livestock rearing 6.97 20.93 23.26 44.19 4.65 2.81 XVI
No adaptation 4.65 6.98 55.81 23.26 9.30 2.74 XVII
Change amount of land for crop
cultivation 6.97 44.19 27.91 16.28 4.65 2.40 XVIII
noted that adaptation strategies used by farmers were changing farming practices (such as plant drought resistant varieties, have more livestock
and less livestock, build cattle shelter), diversifying
livelihood (get off farm work, start a business) and forming networks (cooperatives, community horticultural projects).
Barriers are defined as factors, conditions or
obstacles that reduce the effectiveness of adaptation
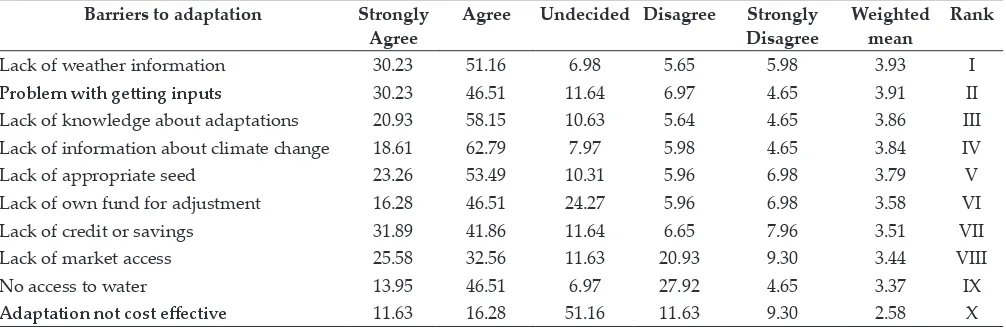
strategies (Moser and Ekstrom 2010). The perusal of table 8 revealed that out of ten perceived barriers to climate change adaptation factors, it was noted that lack of weather information was most felt barriers among climate change adaption factors as reported by farmers and accordingly it was ranked
first and followed by problem with getting inputs,
lack of knowledge about adaptations and lack of information about climate change were ranked
second, third and fourth as calculated on the basis of responses received from the farmers. Whereas least perceived barriers to climate change adaptation was
‘adaptation not cost effective’ statement. However, Antwi-Agyei et al. (2013) noted financial barriers,
institutional barriers and lack of information on climate change characteristics.
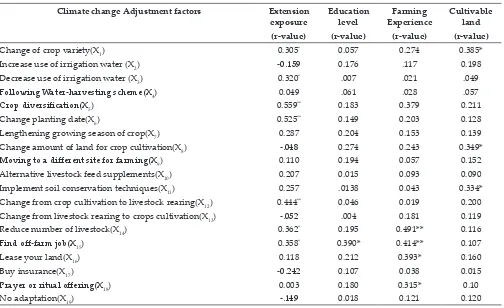
Adaptation strategies to climate change depends on the socioeconomic characteristics of the farmers viz. education, farm size, farming experiences, and
contact with extension service agents (Uddin et al.
2014). Keeping this in consideration correlation was calculated (Table 9). It was noted that the variables Change of crop variety (X1), Decrease use of irrigation water (X3), Crop diversification
(X5), Change planting date (X6), Change from crop cultivation to livestock rearing (X12), Reduce number of livestock (X14) and Find off-farm job (X15)
were positively and significantly correlated with
the variable Extension Exposure of farmers. The result might imply that these adjustment factors were strongly substantiated among farmers due to extension exposure. It was interesting to note that the respondents level of education was positively
and significantly correlated with the X15 variable, the result might be indicative that respondents
with higher education might seek Off-farm job
as adjustment factor. It was further surprised to
note that fatalism i.e. prayer or ritual offering (X18)
as adjustment factors was significantly positively related with the farming experience. Furthermore,
it was also noted that leasing out of land (X16) was another option for adjustment to the experience farmers, it may be indicative that farming not remain remunerative now with escalating price of inputs. The adjustment practices i.e. Change crop variety (X1), Change amount of land for crop cultivation (X8) and Implement soil conservation techniques (X11) were positively and significantly
correlated with the cultivable lands of the farmers (Table 9).
Conclusion
Adaptation to climate change requires that farmers first notice that the climate has changed and
accordingly efforts will be directed in individual
and group level to prepare for or adjust to climate change. Throughout history, human societies have repeatedly demonstrated a strong capacity for
Table 8: Farmer’s perceived barriers to adaptation under changing climate
n = 150 Barriers to adaptation Strongly
Agree Agree Undecided Disagree Strongly Disagree Weighted mean Rank
Lack of weather information 30.23 51.16 6.98 5.65 5.98 3.93 I
Problem with getting inputs 30.23 46.51 11.64 6.97 4.65 3.91 II
Lack of knowledge about adaptations 20.93 58.15 10.63 5.64 4.65 3.86 III Lack of information about climate change 18.61 62.79 7.97 5.98 4.65 3.84 IV
Lack of appropriate seed 23.26 53.49 10.31 5.96 6.98 3.79 V
Lack of own fund for adjustment 16.28 46.51 24.27 5.96 6.98 3.58 VI
Lack of credit or savings 31.89 41.86 11.64 6.65 7.96 3.51 VII
Lack of market access 25.58 32.56 11.63 20.93 9.30 3.44 VIII
No access to water 13.95 46.51 6.97 27.92 4.65 3.37 IX
adapting to different climates and environmental changes-whether by migration to new areas, changing the crops we cultivate, or building different
types of shelter. However, the current rate of global climate change is unusually high compared to past
changes that society has experienced. Fact is that,
climate change is ubiquitous and its multifarious
ramification is also omnipresent. The micro level
study in the West Tripura on farmers Perception and adaptations to climate change might be not be
the reflection of entire gamut of north east India,
however, it would indicate the present trend.
From this empirical research, it can be concluded
that farmers had to rely on own observation and neighbours’ view for weather related prescience, whereas science and technology had reached to the calibre of early weather predication with more precision. It was also noted that disease of man, animal and crops were in inclined trend, and annual rainfall and rainfall days also had unfavourable
changed, these result alarm for pre-emptive action
road map with taking farmers as partner. The major
adjustment practices and factors farmers were following under changing climatic context were decrease use of irrigation water, change planting
date, find off-farm job, alternative livestock feed
supplements, change crop varieties and crop
diversification, however, barriers bristle in their
adjustment were lack of weather information,
problem with getting inputs, lack of knowledge
about adaptations, lack of information about climate change and lack of appropriate seed.
References
Antwi-Agyei, P., Dougill, A.J. and Lindsay, C. 2013. Barriers to climate change adaptation in sub- Saharan Africa: Evidence from northeast Ghana & systematic literature review. Centre for Climate Change Economics and Policy. Working Paper No. 154 & Sustainability Research Institute, Paper No. 52.
Asha Latha, K.V., Gopinath, M. and Bhat, A.R.S. 2012. Impact of Climate Change on Rainfed Agriculture in India: A Case Study of Dharwad. International Journal of Environmental Science and Development3(4): 368-371.
Table 9: Correlation coefficient of perceived climate change adjustment factors with four selected demographic
variables
n = 150 Climate change Adjustment factors Extension
exposure (r-value)
Education level (r-value)
Farming Experience
(r-value)
Cultivable land (r-value)
Change of crop variety(X1) 0.305* 0.057 0.274 0.385*
Increase use of irrigation water (X2) -0.159 0.176 .117 0.198
Decrease use of irrigation water (X3) 0.320* .007 .021 .049
Following Water-harvesting scheme(X4) 0.049 .061 .028 .057
Crop diversification(X5) 0.559** 0.183 0.379 0.211
Change planting date(X6) 0.525** 0.149 0.203 0.128
Lengthening growing season of crop(X7) 0.287 0.204 0.153 0.139
Change amount of land for crop cultivation(X8) -.048 0.274 0.243 0.349* Moving to a different site for farming(X9) 0.110 0.194 0.057 0.152 Alternative livestock feed supplements(X10) 0.207 0.015 0.093 0.090 Implement soil conservation techniques(X11) 0.257 .0138 0.043 0.334* Change from crop cultivation to livestock rearing(X12) 0.444** 0.046 0.019 0.200 Change from livestock rearing to crops cultivation(X13) -.052 .004 0.181 0.119
Reduce number of livestock(X14) 0.362* 0.195 0.491** 0.116
Find off-farm job(X15) 0.358* 0.390* 0.414** 0.107
Lease your land(X16) 0.118 0.212 0.393* 0.160
Buy insurance(X17) -0.242 0.107 0.038 0.015
Prayer or ritual offering(X18) 0.003 0.180 0.315* 0.10
No adaptation(X19) -.149 0.018 0.121 0.120
Chakrabarti, B., Jain, N., Bhatia, A., Gupta, S.K. and Pathak, H. 2012. Impact of Climate Change on Soil Fertility. In Pathak H, Aggarwal PK, Singh SD (ed.) Climate Change Impact, Adaptation and Mitigation in Agriculture: Methodology for Assessment and Application. Division of Environmental Sciences, Indian Agricultural Research Institute, New Delhi.
Chandra, S. 2012. Impact of Climate Change on Insects. In Pathak, H., Aggarwal, P.K., Singh, S.D. (ed.) Climate Change Impact, Adaptation and Mitigation in Agriculture: Methodology for Assessment and Application. Division of Environmental Sciences, Indian Agricultural Research Institute, New Delhi.
Gbetibouo, G.A. 2009. Understanding Farmers' Perceptions and Adaptations to Climate Change and Variability- The Case of the Limpopo Basin, South Africa. IFPRI Discussion Paper 00849.
IPCC. 2007a. Climate Change 2007: Impacts, Adaptation and Vulnerability. Cambridge University press, Cambridge. Judge Timothy, A., Kammeyer-Mueller and John, D. 2012.
Job Attitudes. Annual Review of Psychology63(1): 341–67. Maddison, D. 2006. The perception and adaptation to climate
change in Africa. CEEPA Discussion Paper No. 10. Centre for Environmental Economics and Policy in Africa, University of Pretoria, South Africa.
Moser, S.C. and Ekstrom, J.A. 2010. A framework to diagnose barriers to climate change adaptation. Proceedings of the National Academy of Sciences107(51): 22026-22031.
Nelson, et al. 2009. Climate Change Impact on Agriculture and Costs of Adaptation. Washington, D.C.: International Food Policy Research Institute.
Nyanga, P.H., Johnsen, F.H., Aune, J.B. and Kalinda, T.H. 2011. Smallholder Farmers’ Perceptions of Climate Change and Conservation Agriculture: Evidence from Zambia. Journal of Sustainable Development 4(4): 73-85.
Pathak, H., Bhatia, A. and Jain, N. 2012. Greenhouse Gas Emission from Agriculture. In Pathak H, Aggarwal PK, Singh SD (ed.) Climate Change Impact, Adaptation and Mitigation in Agriculture: Methodology for Assessment and Application. Division of Environmental Sciences, Indian Agricultural Research Institute, New Delhi. Ravindranath et al. 2011. Climate change vulnerability profiles
for North East India. Current Science101(3): 384-394. Rawson, H.M., Gifford, R.M. and Condon, B.N. 1995.
Temperature gradient chambers for research on global environment change. Portable chambers for research on short-stature vegetation. Plant Cell Environment 18(9): 1048-1054.
Thomas,D.S.G., Twyman, C., Osbahr, H.and Hewitson, B. 2007. Adaptationtoclimate change and variability: Farmer responsestointra-seasonal precipitation trends in South Africa. Climatic Change83(3):301-322.