Optimization of TV Multicast Delivery
Emad Abd-Elrahman1, Hossam Afifi2, Hassnaa Moustafa3, Mamadou Tourd Diallo3, Nicolas Marechal3 1
National Telecommunication Institute Cairo, Egypt
2
Institut Mines-Télécom, Télécom SudParis - CNRS Samovar UMR 5157, France
3
Orange Labs, Issy les moulineaux, France
{Emad.abd_elrahman, Hossam.afifi}@it-sudparis.eu
{Hassnaa.moustafa, Mamadoutourad.diallo, Nicolas.marechal}@orange.com
ABSTRACT: This paper focuses on user-centric mobileTV service considering the users’ consumption style, the cost reduction of network resources and the enhancement of End-Users’ Quality of Experience (QoE). We consider a nomadic access scenario where each user is able to access his mobile TV content AnyTime, AnyWhere and from Any Device (ATAWAD), considering the eMBMS (Evolved Multimedia Broadcast Multicast Service) diffusion. In multicast TV delivery, clients join/ leave the multicast TV source of channels according to their requests. However, during Nomadic Access (NA), the multicast tree has to be reconstructed according to the new demands. This paper introduces a solution that adapts the multicast delivery for mobileTV service through optimizing the tree structure of multicast nodes in a dynamic manner according to the different context of the user and the network. The proposed solution optimizes the investment cost (CAPEX) of multicast sources (streaming points) and opens the way to an enhancement of the Quality of Experience (QoE) of End-User.
Keywords: MobileTV, Multicast, Nomadism, Cost Optimization, Quality of Experience, MOS, Service Virtualization
Received: 28 August 2013, Revised 2 October 2013, Accepted 11 October 2013
© 2013 DLINE. All rights reserved
1. Introduction
Figure 1. Overall Mobile Data Traffic (2010-2015) [Cisco Visual Networking Index: Global Mobile Data Traffic]
Figure 2. Video Mobile Data Traffic (2010-2015) [Cisco Visual Networking Index: Global Mobile Data Traffic]
Mobile video content has a much higher bit rate than other types of content and is expected to generate much of the mobile traffic growth through 2015, where 4.2 Exabytes of the 6.3 Exabytes global mobile traffic will be due to video traffic. Figure 2 shows a forecast for the evolution of the mobile video traffic by 2015 [which is expected to generate 66 percent of the world’s mobile data traffic].
1.2 Mobile TV Video Distribution
The most common distribution means of Mobile TV are cellular networks and more recently WiFi networks.Mobile TV 6,000,000
Terabytes per month Terabytes per Month
6,000,000
3,000,000
92% CAGR 2010-2015
2010 2011 2012 2013 2014 2015
0.24 EB 0.6 EB
1.2 EB
3.8 EB
2.2 EB
6.3 EB
Source: Cisco VNI Mobile, 2011
Mobile Video Will Generate 66 Percent of Mobile Data Traffic by 2015
Mobile Web/Data Mobile Gaming Mobile VoIP
Mobile M2M
Mobile Video Mobile P2P 7,000
3,500
0
2010 2011 2012 2013 2014 2015 Petabytes per Month 92% CAGR 2010-2015
1.5% 4.7% 6.1%
66.4% 20.9%
VoIP traffic forcasted to be 0.4% of all mobile data traffic in 2015 Source: Cisco VNI Mobile, 2011
distribution was initially largely focused on cellular networks. Network capacities are upgraded when required to sustain the TV data growth in order to maintain a high network Quality of Service (QoS). Some technologies have emerged for broadcast-ing content over cellular networks, includbroadcast-ing Multimedia Broadcast Multicast Service (MBMS), Integrated Mobile Broadcast (IMB), and Evolved MBMS (e-MBMS) for Long Term Evolution (LTE) networks. These technologies are currently either not mature yet or not widely deployed.
Multimedia Broadcast Multicast Services (MBMS) [4] delivers multimedia content to several users at the same time and are adapted to TV broadcasts (live events, for example) but not suited for video on demand (VoD). Evolved MBMS (e-MBMS) [5] has emerged to support multimedia broadcasting over LTE networks and has a similar concept and high-power require-ments as MBMS. The eMBMS is equivalent to MBMS however for LTE offering higher capacity and allows the resources sharing between the unicast and multicast where a transition takes place between unicast and multicast function of the number of audiences of the same channel within the same cell. Even though MBMS and eMBMS technologies are standard-ized, they aren’t deployed in practice because no terminals support them owing to the absence of business models that can work among broadcasters, MNOs, and terminal vendors.
In this paper, we focus on eMBMS and we propose a solution to enhance this technology through adapting the multicast delivery (as presented in Section 3).
1.3 Mobile TV Standards
Different mobile TV standards have been developed by various countries. Some of these standards include DVB-H, DMB, SDMB and MediaFLO. In this section, we discuss different mobile TV standards [6] taking into account features such as audio/video codecs, transmission schemes, power saving techniques, frequency bands, etc.
1.3.1 Digital Multimedia Broadcasting (DMB)
It is a digital radio transmission technology that is seen as the next generation digital broadcasting service for indoor and outdoor users. DMB was developed by the Electronics and Telecommunications Research Institute of Korea in 2004 based on Digital Audio Broadcasting (DAB) standard. DMB uses the same videoencoding scheme as DVB-H namely, H.264. However, DMB uses a different audio encoding technology, MPEG-4 Bit Sliced Arithmetic Coding (BSAC). It also uses MPEG-2 Transport Stream (TS) as the transport format. While DMB does not have the function of time slicing, it deals with a lower bandwidth of 1.54 MHz for keeping the tuner power low.
1.3.2 Satellite Digital Multimedia Broadcast (S-DMB)
It is a mobile satellite system which provides a communication medium in areas where terrestrial coverage is not available. S-DMB is suitable where terrestrial networks have not been deployed. SS-DMB provides a high data rate broadcast service to any 3rd Generation Partnership Project (3GPP) standardized Class 3 handsets (250mW). The system operates in the International Mobile Telecommunication 2000 (IMT-2000) frequency band allocated to Mobile Satellite Services and is based on a dedi-cated high power geostationary satellite.
1.3.3 T-DMB is a Terrestrial Digital Radio Transmission System
T-DMB is a Terrestrial Digital Radio Transmission System for broadcasting multimedia to mobile units. T-DMB adopts H.264 for video coding and MPEG-4 Part 3 for audio coding and multiplexes them into the MPEG-2 transport stream. In TDMB, Differential Quadrature Phase Shift Keying (DQPSK) modulation is used over OFDM channel access, which alleviates channel effects such as fading and shadowing.
1.3.4 Digital Video Broadcasting- Handheld (DVB-H)
is a European standard designed to use terrestrial TV infrastructure to deliver multimedia service to mobile devices. Since DVB-H only specifies the behavior below the IP layer of a mobile TV system, other service layer standards over DVB-H are required for describing, signaling, delivering, and protecting IP-based mobile TV services (e.g., streaming and file download-ing services). Currently, two similar service-layer standards are available over DVB-H, and they are the Open Mobile Alliance (OMA) Mobile Broadcast Services Enabler Suite (BCAST) standard and the DVB IP DataCasting (DVB-IPDC) standard.
1.3.5 Media Forward Link Only (MediaFLO)
Amplitude Modulation (16-QAM) for the modulation of the carriers. MediaFLO provides multiple types of encoding schemes such as H.264, MPEG-4, and RealVideo. MediaFLO supports a multiple-level error correction system and an efficient coding which provides efficiencies of 2 bps per Hz to allow 12 Mbps with 6 MHz. MediaFLO uses the OFDM to simplify the reception from multiple cells, and the handsets receive the same packet from multiple cells which can improve the reception.
1.3.6 Integrated Service Digital Broadcasting-Terrestrial (ISDB-T)
It is similar to DVB-T and is used in Japan to provide digital service to TV sets and handheld mobile devices. It systematically
integrates various kinds of digital content, each of which may include High Definition Television (HDTV), Standard Definition Television (SDTV), sound, graphics, text and so forth. ISDB consists of various services. In an ISDB-T network, signals for both fixed and mobile reception services can be combined in one transmission via the use of hierarchical layers. Transmission occurs as a continuous flow by minimizing delays in signal acquisition when the user switches from one channel to another.
1.4 ATAWAD TV Service Access
Mobile TV service is based on real time video streaming over IP. Operators propose the service in a ‘managed’ manner and guarantee the delivery and the bandwidth requirements for service quality and customer satisfaction. Delivering the same service under roaming policies for mobile and nomadic users is a new trend to allow mobile TV access Anytime/Anywhere/ Anydevice (ATAWAD).
The structure of classical IPTV networks as explained in [7, 8] consists of an access network and a core network. This structure is slightly modified for users accessing mobile TV under the eMBMS model. In both approaches, multicast proto-cols are the key element in communication through mainly Protocol Independent Multicast - Sparse Mode PIM-SM [9] protocol for multicast routing. PIM-SSM (Source Specific Multicast) [10] can also be used for high optimization. Network operators search for dynamic solutions to cope with clients’ mobility and nomadism with the guarantee of video quality. This is mainly through adapting the multicast topology according to clients’ behaviour and considering the cost reduction. Operators then need to reconstruct multicast trees to match the clients’ needs and networks resources optimization. In this context, we propose in this paper a dynamic reconstruction of the multicast spanning tree topology.
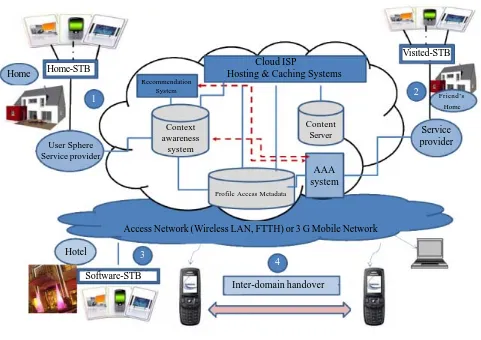
Figure 3 illustrates the global architecture for ATAWAD TV Access including Nomadic Access (NA) for TV Service. This architecture extends the classical IPTV service access in the UP-TO-US project [11] to allow for mobile and nomadic TV access considering the ATAWAD principle. Layer1 in this architecture highlights the local access of TV service based on any device through context aware recommendation system based on the user location in his personal sphere. Layer 2 represents nomadic TV access based on the same principle of layer 1. Layer 3 represents nomadic TV access in hotels based on software Set-Top-Box (STB) to simplify the access and allow service portability. Layer 4 is represents mobile client and handover process for terminal mobility.
We differentiate between the home network and the visited one in TV access as follows:
Home Network (HN): Refers to the user local home network where he resides with his Set Top Box (STB). This STB is installed
by an operator in a physical location (cable, fiber) inside the home.
Visited Network (VN)/Nomadic Network (NN): Refer to any access network different from the user home network. It could be
with the same operator, outside the user local home (mobile or nomadic) or through any other operator (roaming).
Since multicast is the base for modern live TV, operators search for dynamic solutions to cope with the clients mobility and nomadism. This behaviour is confronted with the guarantee of video quality implying changes in the multicast topology. Network operators then need to multicast the required TV channels in a customized manner by adapting their multicast trees to the client behaviour and also to minimize the access cost. To do this, there are two ways:
• Clients build Virtual Private Networks (VPN) with their home networks to obtain their videos. This solution is not scalable when the number of clients increases and with the existence of multi-domains (many hops). Also, it is not efficient in video applications for delay and performance issues.
• Operators should reconstruct multicast trees to match the clients’ needs. This solution has more benefits in terms of network scalability and resources optimization. It matches our objective where we propose a solution to reconstruct the multicast spanning tree topology.
Figure 3. ATAWAD TV access
Visited-STB
Home-STB Home
Friend’s Home
Content Server
AAA system Profile Access Metadata
Inter-domain handover Software-STB
Hotel
Context awareness
system
Service provider User Sphere
Service provider
Access Network (Wireless LAN, FTTH) or 3 G Mobile Network 1
3
2
4 Cloud ISP
Hosting & Caching Systems Recommendation
System
i) CAPEX cost: Capital Expenditure is the essential and fixed investments in main infrastructure,
ii) OPEX cost: Operational Expenditure is the running cost for long term operation, and
iii) Revenue: operator benefits from adaptation of the diffusion mode.
2. Adaptation of Mobile TV Content Delivery
Content Adaptation is an important step in mobile TV delivery and can be done by the operator, the service provider or the client itself. However it is little bit complex in this later case and requires more capabilities for the current generation of end devices. So, network operators and services providers are mainly responsible for content adaptation according to the whole context information in the system.
2.1 Context-awareness along the delivery chain: Context types in Mobile TV
It is noticed that traditional content adaptation, recommendation and personalization systems consider only network cover-age (for example, EDGE, UMTS, HSDPA…), subscription and the used device (for example, 3GPP device, iPhone, Windows media…) criteria while the general context information is missed (terminal capacity, network status, user’s location…etc). To offer a coherent and efficient content adaptation, there is a need to consider additional context information in Mobile TV systems.
i) User context: Includes information about the user which could be static (user profile, his preferences…) and dynamic (user
location, available networks in his proximity…).
ii) Network context: Represents the characteristics of the access link being used for accessing/delivering audiovisuals
content (jitter, packet loss, delay, available bandwidth.
iii) Device context: User can access the multimedia content through various devices which may have different capacity
(device’s screens size, CPU, supported format (codec, protocols), supported network technologies…).
iv) Content context: Information about the content itself (type of content, used codec, content format, language…).
On the basis of this information Context-awareness along the delivery chain is promising in enhancing the Mobile TV system through appropriate and accurate service adaptation, recommendation and personalization to increase customer satisfaction and loyalty.
2.2 Enriching Quality of Experience
Quality of experience (QoE), or quality of user experience, measures how users will directly perceive a quality parameter (playback time, rebuffering rate, page load and view duration…). QoE measurement helps also the Content Providers to known consumer satisfaction from the service and then reduces the churn, promotes new services and improves the ARPU (Average Revenue Per User).
To measure how user perceives the quality, QoE is measured through three main means:
i) Objective means based on network parameters (e.g. packet loss, jitter, delay, available bandwidth, congestion notification from routers…), it is based on network related parameters that need to be gathered to predict the users’ satisfaction.
ii) Subjective means based on the quality assessment by the users giving the exact user perception of the service. This method for QoE measurement is the most fundamental methodology for evaluating QoE, techniques are based on surveys, interviews and statistical sampling of users and customers to analyze their perceptions and needs with respect to the service and network quality. Several subjective assessment methods suitable for video application have been recommended by ITU-T [12] and IITU-TU-R [13]. ITU-The most famous metric used in subjective measurement is the MOS (Mean Opinion Score), where subjects are required to give a rating between 1 to 5 (1 means bad and 5 excellent).
3. Multicast TV Delivery Optimization
Actually, there are two famous Multicast service models used in live TV delivery:
• SSM: Source-Specific Multicast. In this model, the terminal subscribes to a multicast group to receive data sent to the group by a specific source (only one source for the tree) which means specific source to specific group (S,G) [10]. Therefore, with SSM the network is able to build a separate distribution tree for each multicast source.
• GSM: Group-Shared Multicast. In this model, each node in the multicast group could send/receive videos to/from any member in the tree (many sources of traffic in the trees). This type traditionally called Any Source Multicast (ASM) as explained in [14].
The delivery optimization is based on a multicast tree with optimal costs and optimal QoE. We show hereafter a method to derive such a tree.
3.1 Overview on Spanning Tree Algorithms
Engineering the content delivery in a large operator network is crucial. That is why we can find a specific business for cache provisioning (AKAMAI for example) specialized in such optimizations.Adding the mobility aspect explained before intro-duces new difficulties in the network engineering. We need to move the content close to their mobile consumers.Otherwise, the network suffers from large congestion and the user is unsatisfied from the end to end QoE.
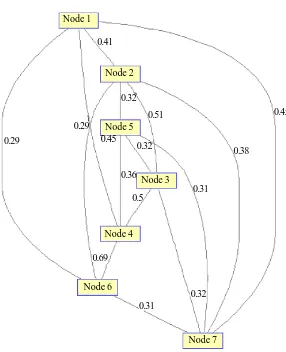
introduction ofthe virtual node concept to the spanning tree. This virtual node is added as shown in Figure 4 as follows:
• We represent the physical topology of the network including links and nodes. The nodes represent servers and streaming head points (Figure 4 (a)).
• We add a link between the virtual node to the physical nodes if we can relocate the service in the physical nodes.The link value represents the parameters previously explained (i.e. costs and quality) (Figure 4 (c)).
• The result is a new graph with an additional virtual node (node 7) and some new links.
• The spanning tree algorithm is applied to that topology.
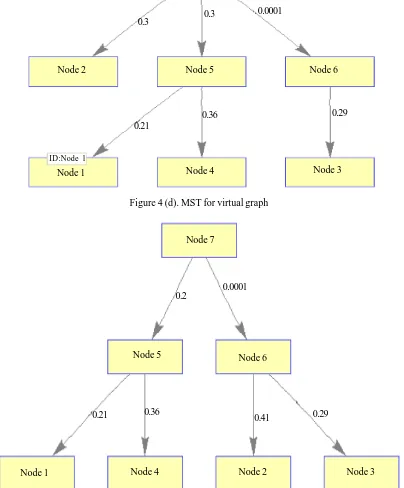
• The result is a new multicast architecture, optimized with new costs. All we have to do is remove the virtual node and obtain the relocation of servers in the network (we remove node 7 from Figures 4 (d) and 4 (e)).
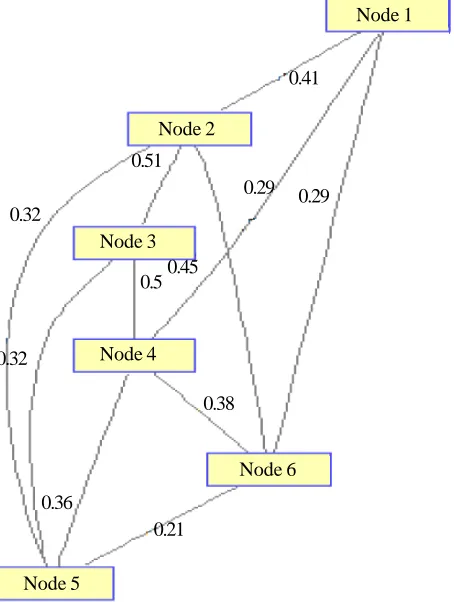
As shown in Figure 4 (a), the network is represented by a simple topology of 6-nodes with interconnection links. After running the Minimum Spanning Tree (MST) algorithm to define the shortest paths between nodes on the assumption of node 6 as a network root, we have the output minimum spanning tree structure as shown in Figure 4 (b). The weights on the arcs represent the metric values or link costs between nodes.
In Figure 4 (c), we insert node-7 as a virtual node to act as a root position between nodes-1, 2, 3, 5 and 6 with same assumption of nodes weights. After that, we run the same MST over the new virtual topology and have the output shown in Figure 4 (d). The VN creates new sub trees; one with the old root node-6 and another with new root node-2 and last one with node-5. In Figure 4 (e), we have different sub trees (only two) as we change the virtual link weights/costs. The final step is to remove node 7 (Virtual Node) to obtain the divided trees. Those output trees will be analyzed in terms of cost reduction as shown in Section 3.3.
Figure 4 (a). The original graph of main topology
3.2 Mapping QoS on links to end-to-end QoE
In this section, we open the way for enhancing Quality of Experience (QoE) by adapting the spanning tree technique described earlier and choosing the appropriate tree.
Node 3
Node 5
Node 6 Node 4
Node 2
Node 1
0.32
0.36 0.32
0.29 0.51
0.41
0.38 0.5
0.29
Figure 4 (b). The MST output graph
Figure 4 (c). Main virtual graph
It is important to mention that delivery selection alone may not be sufficient to enhance user satisfaction. It only helps mobile users to select the best tree. Recall from the last section that we can improve the diffusion tree by bringing content closer to
Node 1 Node 2 Node 4
Node 3 Node 5
Node 6
0.29
0.21 0.42
0.3
0.36
Node 1
Node 2
Node 4
Node 3 Node 5
Node 6
Node 7 0.41
0.29
0.38
0.31 0.32
0.5
0.69 0.36
0.31
0.51 0.45
0.32 0.29
Figure 4. Main and virtual topology by inserting VN (node-7) and different MST outputs according to changing the weights of links between VN and proposed ones
consumers. After this process, we arrive to a set of possibilities where users can retrieve contents. To enhance users’ satisfaction, we focus on tree selection and look at the Quality of Service (QoS) offered by each tree in order to achieve good user perception for the consumed content.
Node 7
Node 5
Node 4
Node 6 Node 2
Node 1 Node 3
ID:Node 1
0.3 0.3
0.36 0.21
0.0001
0.29
Figure 4 (e). Another MST virtual graph
0.21 0.36 0.41 0.29
0.0001 0.2
Node 7
Node 5 Node 6
Node 2 Node 3
Node 4 Node 1
Figure 5. Mapping QoS to end-to-end QoE
As shown in Figure 5, to gather the content, the terminal has two choices: route (1, 2, 5) or (1, 3, 4, 6). The method computes the QoS for route in the tree and selects which one has the maximum score and the corresponding route in the tree will be the chosen distribution path that will guarantee better QoE. Consequently, we succeed in reducing the transmission cost through the enhanced MST and the selection of the streaming source that maximizes the QoE.
The QoS value for each link can be calculated as the the sum of the network parameters multiplied by a weight for each attribute (bandwidth, delay, jitter, packet loss). For example, a VoIP application may favor the bandwidth and the delay while for the video streaming the bandwidth and jitter has more importance. This is reflected by assigning higher weight for different parameters based on type of application.
We consider the different attributes between each two nodes and then compute the corresponding QoS based on what we previously explained. The end-to-end QoS is characterized by the minimum (QoS (link)).
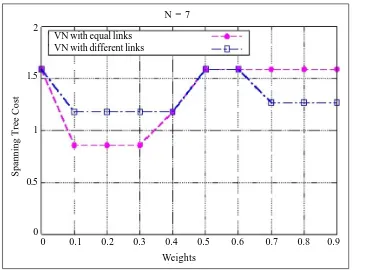
Figure 6 (a). MST calculations for 7 nodes VN with equal links
VN with different links 3
5 2
6
4 1
SOURCE
CORE NETWORK
QoE
Streamer End User
N = 7
Spanning Tree Cost
Weights 2
1.5
1
0.5
0
Figure 6 (b). MST calculations for 16 nodes
3.3 Evaluation and Results
We evaluate the proposed algorithm based on the virtual links cost (i.e. weight) between VN and the other potential nodes (nodes to act as new streaming points). Then, we study the evolution of the new tree with respect to the weights as:
• The VN has equal weights to the proposed nodes [from 0 to 1 step size 0.1]
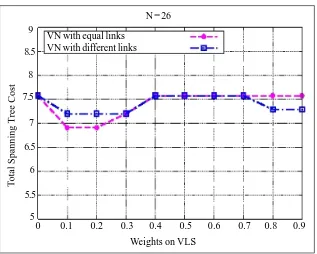
• The VN has different weights to the proposed nodes [from 0 to 1 step size 0.1] Figure 6 (c). MST calculations for 26 nodes 9
8
7
6
5
N = 16
T
otal Spanning
T
ree Cost
Weights on VLS 5
4
3
2
1
0 0.1 0.2 0.3 0.4 0.5 0.6 0.7 0.8 0.9 0
VN with equal links VN with different links
N = 26
T
otal Spanning
T
ree Cost
Weights on VLS
0 0.1 0.2 0.3 0.4 0.5 0.6 0.7 0.8 0.9 8.5
7.5
6.5
5.5
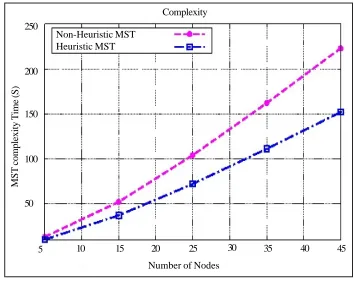
Figure 6 (d). Heuristic Versus non-Heuristic method
Figure 6. Simulation results based on topology structure and MST algorithm complexity
The equal base assumes that the costs are equal for all the new roots. The total virtual resource is equally divided between the new roots. For non-equal base, we assume different costs on new roots has different base of resources which means different cost.
We change the weights/costs on virtual links and prove that all the results give always an MST with total costs less than the original one.
Actually, the proposed costs or weights on virtual links depend on the network state (number of mobile clients, bandwidth, global QoE). This state is dynamic so the costs vary and the process is not detrimenstic but, could be considered as stochastic.
Moreover, the prediction of network state and nodes capacity changes according to users joining/leaving the delivery process. Hence, we will suppose different topology scenarios and assign different costs/weights on virtual links between 0 and 0.9 on equal and non-equal bases. In the following three figures, we simulate three scenarios with different number of nodes.
We run the MST taking into consideration the VN as a new root for the virtual topology and check the second level under the virtual root that actually represents the real roots for the generated trees. We then remove the virtual root. We recalculate the MST costs for the new trees and compare them with the original MST costs.
We plot in Figure 6, the total spaning tree cost gain compared to the original tree. We can see that all generated trees give MST costs less than or equal the original one as shown in Figure 6.A, B and C for 6, 16 and 25 nodes respectivly. As it is known from MST complexity, time consumed by MST algorithm to build the final trees may be long. We improved the algorithm conver-gence time as shown in Figure 6.D with a non-heuristic method [15].
5. Conclusion
The great advancement in personal devices including smartphones and personal devices have completely revolutionized the Complexity
MST complexity Time (S)
Number of Nodes 250
200
150
100
50
5 10 15 20 25 30 35 40 45
way we live and entertain ourselves. Mobile TV has been attracting a lot of attention recently because of the tremendous revenue potential for all the players involved in its generation, distribution, management, and use. Despite the increasing demand of such a service from mobile users, the speed of adoption has been slow since many technical challenges still need to be solved. Among these challenges are the deployment cost for network operators and the QoE guarantee for users. In this paper, we present a market analysis for mobile TV, describe several related standards and technologies, then present a new solution for optimizing the live TV multicast diffusion for mobile users over eMBMS technology. The proposed solutionextends the Minimum Spanning Tree (MST) algorithm through considering cost reduction and QoE guarantees.The proposed solu-tion is evaluated through simulasolu-tion and the obtained results show the achieved gain. As a future work, we tend to consider more QoE metrics and implement the solution in a real platform.
References
[1] Digital Omnivores: How tablets, Smartphones and Connected Devices are Changing U.S Digital Media Consumption Habits, ComScore White Paper, October. (2011).
[2] Zeadally, S., Moustafa, H., Siddiqui, F. (2011). Internet Protocol Television (IPTV): Architecture, Trends, and Challenges, IEEE Systems Journal, 5 (4) 518–527.
[3] White Paper. (2012). Cisco Visual Networking Index: Global Mobile Data Traffic Forecast, 2010-2015, Feb.
[4] 3GPP TS 23.246: Multimedia Broadcast/Multicast Service (MBMS). (2007). 3G Partnership Project specifications, June.
[5] 3GPP TS 26.346: Multimedia Broadcast/Multicast Service. (2012). 3G Partnership Project specifications, September.
[6] Zeadally, S., Moustafa, H., Bihannic, N. (2012). Mobile TV in Media Networks: Architectures, Applications and Standards, CRC Press, May.
[7] Technical White Paper. (2008). High Quality and Resilient IPTV Multicast Architecture, Nokia Siemens Networks.
[8] Internet Engineering Task Force. (2007). Requirements for Multicast in Layer 3 Provider-Provisioned Virtual, http:// www.ietf.org/rfc/rfc4834.txt.
[9] Internet Engineering Task Force. (2006). Protocol Independent Multicast (PIM) Sparse Mode, http://www.ietf.org/rfc/ rfc4601.txt.
[10] Internet Engineering Task Force. (2003). An Overview of Source-Specific Multicast (SSM), http://www.ietf.org/rfc/rfc3569.txt.
[11] UP-TO-US project: https://up-to-us.rd.francetelecom.com/
[12] http://www.videoclarity.com/PDF/T-REC-P.910-199909-I!!PDF-E%5B1%5D.pdf
[13] http://www.dii.unisi.it/~menegaz/DoctoralSchool2004/papers/ITU-R_BT.500-11.pdf
[14] Internet Engineering Task Force. (1989). Host Extensions for IP Multicasting, http://www.ietf.org/rfc/rfc1112.txt.
![Figure 1. Overall Mobile Data Traffic (2010-2015) [Cisco Visual Networking Index: Global Mobile Data Traffic]](https://thumb-us.123doks.com/thumbv2/123dok_us/522615.2052008/2.612.137.479.68.312/figure-overall-mobile-traffic-visual-networking-global-traffic.webp)