O R I G I N A L A R T I C L E
Open Access
The effects of repeated lineups and delay
on eyewitness identification
Wenbo Lin
*, Michael J. Strube and Henry L. Roediger III
Abstract
A significant problem in eyewitness identification occurs when witnesses view a suspect in one venue such as a mugshot and then later in a lineup where the suspect is the only previously viewed person. Prior research has documented that the witness may select the suspect from the lineup due either to misplaced familiarity from seeing the mugshot or to their prior commitment from identifying the suspect from the mugshot. Two experiments attempted to minimize these biases by using repeated identical lineups, such that both targets and fillers were repeated, to determine if such a procedure could be useful. Across two experiments, we also varied the delay between seeing the event and the first lineup, as well as the delay between lineups. Despite the use of identical lineups, we continued to observe the effects of commitment and misplaced familiarity, so our procedure did not remove these problems. In addition, we also found that both repeated lineups and increasing delays can influence people’s tendency to choose and their willingness to maintain their decisions, regardless of accuracy. Most importantly, however, despite the negative effects of repeated lineups and the relatively long delays used in our experiments, we obtained strong relations between confidence and accuracy when using confidence-accuracy characteristic plots. High confidence responses were associated with high accuracy.
Keywords:Eyewitness identification, Confidence, Decision behaviors
Significance
Eyewitness misidentification in the criminal justice sys-tem is a major problem. One contributing factor is the use of repeated identification procedures, whereby
wit-nesses’ memories are tested at two separate occasions
(e.g., a photo lineup followed by a live lineup) with the suspect as the only person to appear both times. Experi-mental studies have shown that these procedures intro-duce a bias so that the suspect, even if innocent, is more likely to be selected in the second identification. The suspect may seem familiar not from having committed the crime, but merely from having been seen previously. Another problem is that witnesses tend to stay commit-ted to their initial identification decision even if it is wrong (the commitment effect).
We developed a procedure to potentially overcome these problems by using identical lineups on two occa-sions. Because both the suspect and the fillers were the same in the two cases, differences in familiarity should
be nullified (although not differences in commitment). However, our procedure still showed effects of misplaced familiarity and commitment. The positive news from the study is that on both identifications and across various
delays, witnesses’ high confidence identifications were
highly accurate. Thus, the confidence-accuracy relation seemed resistant to both repetition and to retention interval. These results add to our growing
understand-ing of eyewitnesses’ lineup identification behaviors, as
well as further documenting that, on both a first and second test that are not biased, high confidence indi-cates high accuracy.
Introduction
Erroneous eyewitness identification played a role in over 70% of DNA exoneration cases. One contributor to these misidentification cases involved repeated identifi-cation procedures. Witnesses may initially see a mugshot (or a show-up) followed by a lineup, or they may see consecutive lineups (e.g. a photo lineup followed by a
live lineup) –and typically the suspect is the only
com-mon face between the two. Goldstein (2019) reported
© The Author(s). 2019Open AccessThis article is distributed under the terms of the Creative Commons Attribution 4.0 International License (http://creativecommons.org/licenses/by/4.0/), which permits unrestricted use, distribution, and reproduction in any medium, provided you give appropriate credit to the original author(s) and the source, provide a link to the Creative Commons license, and indicate if changes were made.
* Correspondence:[email protected]
about a case in New York City in which a witness
identi-fied a man, St. Clair Steward, following the city’s
stand-ard mugshot procedure. After the crime, detectives had entered broad criteria into a data base: black men
be-tween 5′8″and 6′1″tall who had been arrested in one
of three precincts in New York. The witness leafed
through the mugshots until he came to Mr. Steward’s,
the 31st mugshot, and the witness identified him as the perpetrator. The detectives later placed Mr. Steward in a lineup with other men, and the witness again picked Mr. Steward. He was held in jail for two months, until DNA evidence cleared him, and the case was dropped without fanfare. Of course, without DNA evidence, Mr. Steward may have been tried and convicted. This case is hardly unique. David Lee Wiggins was convicted for the rape of a 14-year-old girl in Fort Worth, Texas. The victim iden-tified him from a photo lineup and live lineups in which Wiggins was the only repeated member in the lineups. He was later exonerated due to DNA evidence. In addition, the famous case of Ronald Cotton (wrongly convicted) and Jennifer Thompson (the victim and wit-ness) also involved repeated lineups in which Cotton was the only repeated person. The perpetrator, Bobby Poole (as later determined by DNA evidence), was in neither lineup, but Thompson identified Cotton in both lineups, although on the first occasion it took her 5 min to do so after narrowing it down to two men.
The common denominator of these cases is that the suspect was the only repeated member in these repeated lineup procedures (single-target-repeated lineups), and studies have shown that such procedures inadvertently bias witnesses toward choosing the suspect. Prior re-search has focused primarily on repeated identification procedures involving a single repeated member (a guilty or innocent suspect) across multiple identifications (e.g., Godfrey & Clark, 2010; Steblay & Dysart, 2016; Steblay,
Tix, & Benson, 2013); all studies showed a bias toward
choosing the repeated person on the second occasion. We review the relevant research below, before suggest-ing a procedure that might mitigate these problems.
A second issue to be considered in our research is that of delay between witnessing an event and being exam-ined on it, as well as the delay between the first and sec-ond opportunity to identify the suspect. Of course, longer delays are expected to lead to lower performance and more errors in eyewitness identification. We review the evidence about delay, too, before introducing our ex-periments that examine both the initial delay between witnessing a crime and a first identification (ID), as well as the subsequent delay between the first and second ID. The third issue of concern in the present research is measuring the influence of repeated identifications on the confidence-accuracy (CA) relationship as measured
by confidence-accuracy characteristic (CAC) plots.
Despite problems with repeated identifications, will high confidence responses still indicate high accuracy, as found in virtually all studies in eyewitness memory when assessed by CAC plots on a single unbiased test (Wixted,
Mickes, Clark, Gronlund, & Roediger, 2015; Wixted &
Wells,2017)?
Problems with repeated identification procedures
Repeated identification procedures are relatively routine
(Behrman & Davey,2001; Steblay,2011). On the surface,
these procedures may appear beneficial to criminal in-vestigations (e.g., allowing for a confirmation of an eye-witness identification), but laboratory research has consistently shown the negative effects of repeated iden-tifications: mugshots followed by lineup (Brigham &
Cairns, 1988; Deffenbacher, Bornstein, & Penrod, 2006;
Memon, Hope, Bartlett, & Bull, 2002), prior show-up
(seeing a person) followed by a lineup (Godfrey & Clark,
2010; Valentine, Davis, Memon, & Roberts, 2012) and
consecutive lineups (Hinz & Pezdek, 2001; Pezdek &
Blandon-Gitlin,2005; Steblay & Dysart,2016; Steblay et
al., 2013). In a show-up usually one person is viewed
whereas with mugshots, witnesses often see several or more (31 in the case mentioned above). Unlike in mug-shots or show-ups, the suspect in a lineup is presented alongside fillers, which offers some protection against identification errors in that the witness may pick a per-son known to be innocent or no one at all. Nonetheless,
Steblay et al. (2013) still showed that identification
er-rors from the initial lineup were often carried over to the subsequent lineup when the suspect was the only person in both lineups. Similarly, Hinz and Pezdek
(2001) found that exposure to an innocent suspect in
one target-absent lineup increased the false alarm rate to that innocent person if the same person appeared in a subsequent target-absent lineup. This presumably oc-curred because only one face was familiar in the second lineup, and this familiarity was misattributed to having seen the person commit the crime rather than from the person appearing in the previous lineup. Thus, the
mechanism at work – misattribution of familiarity –
may be the same when two successive lineups are viewed with only one person in common, as in the stud-ies when witnesses see a show-up or mugshot and then are given a lineup. In both cases, an innocent person may be selected due to misattribution of familiarity, as occurs in other studies, too (see Jacoby, Kelley, &
Dywan,1989).
Hinz and Pezdek (2001) observed that exposure to an
when the guilty suspect was presented with all new fillers (.76). Together, these studies demonstrated the negative effects of repeated lineups, but their findings reflected procedures where witnesses may have been biased towards choosing the single-repeated target. Our experiments attempt to mitigate this problem by using the same lineup on two occasions, for reasons dis-cussed below.
We have thus far emphasized misattributions of famil-iarity as a root cause of the problem with repeated IDs with only one person repeated, but at least three differ-ent problems potdiffer-entially exist. Besides misplaced famil-iarity, two other possible problems are misinterpretation
of the police’s intention and witnesses’commitment to a
prior identification decision. For example, when a par-ticular face is repeated across lineups, witnesses may
un-intentionally misinterpret the police’s intention and
believe that the police have identified that particular lineup member as the perpetrator. In addition, witnesses may select an innocent suspect in both the initial and subsequent identification to remain consistent with their initial decision (a commitment effect). The commitment effect has been observed in the misinformation literature (e.g., Schreiber & Sergent,1998); however, it also applies to the eyewitness identification literature. For example,
Valentine et al. (2012) reported that most choosers
(88%) in a show-up also selected the same suspect in the subsequent lineup, regardless of whether the initial iden-tification was accurate. This commitment effect has also been observed in other studies (Dysart, Lindsay,
Ham-mond, & Dupuis, 2001; Godfrey & Clark, 2010; Haw,
Dickinson, & Meissner, 2007). Eyewitnesses may
per-ceive inconsistent decisions across identifications as an indication of unreliability; therefore, they might feel compelled to stick with their initial decision.
Given these findings, one target for research is whether changes in dual identification procedures could mitigate or eliminate these effects. If both the suspect and fillers are repeated in two lineups, all members would be famil-iar. Thus, problems due to misplaced familiarity or to mis-understanding what the police (or experimenter) are seeking should, theoretically, be eliminated. Although re-peating identical lineups would not necessarily remove the commitment effect, it should yield a better measure of the commitment effect because it would be potentially uncon-taminated by the other two issues.
One possible positive use of repeated identical lineups is that performance (identifying the suspect) may im-prove. Improvement in recall or recognition between two tests is called hypermnesia, and it has been reported in free recall tasks quite regularly (e.g., Erdelyi & Becker,
1974; Roediger & Payne, 1982). Recognition
hyper-mnesia has been reported by Bergstein and Erdelyi
(2008), although Payne and Roediger (1987) did not find
it with word-list stimuli. If witnesses receive an add-itional identification opportunity (a subsequent unbiased lineup), would they show hypermnesia? The use of iden-tical lineups may eliminate problems with single-repeated-target lineups and permit greater accuracy on a second test than a first test.
The effects of delay on repeated lineups
The retention interval (or delay) between witnessing an event and being examined on it is a critical variable in all memory research, and eyewitness identification is no exception. However, in repeated identification proce-dures, there are two relevant delays: the delay between the crime and the initial lineup (the initial delay) and the delay between two repeated identifications (we will refer to this as the subsequent delay).
Numerous researchers have examined how the initial delay affects eyewitness identification, but the effects vary across studies. A longer delay has been shown to decrease the number of correct identifications in some
studies (Cutler, Penrod, O’Rourke, & Martens, 1986;
Sauer, Brewer, Zweck, & Weber, 2010); however, Egan
and colleagues (1977) manipulated retention interval
across 2, 21 and 56 days and observed no decrease in correct identifications, but they did observe an increase in false identifications (hence overall accuracy declined).
Valentine, Pickering, and Darling (2003) observed a 65%
suspect identification rate on an immediate test, but they did not find a reliable decrease in suspect identification rate when the test occurred after 1 or 6 months, al-though performance was lower (the suspect ID rate fluc-tuated between 34 and 46%). These null results may have been due to low statistical power. Whereas the ef-fects of delay on identification are not perfectly consist-ent across studies, they generally suggest poorer identification performance with an increase in delay, confirming over a century of memory research using
other procedures (e.g., Nairne, 2008). Importantly,
though, studies that have examined the confidence-accuracy relationship with varying delays show that it holds up well across delays as assessed by CAC plots. That is, even though witnesses identify fewer suspects after long delays, if they are highly confident in their
identifications, they are generally highly accurate
(Palmer, Brewer, Weber, & Nagesh, 2013; Sauer et al.,
2010; Wixted, Read, & Lindsay, 2016). However, these
studies examined the effects of the retention interval be-tween witnessing a crime and the first identification; no research has examined the effects of the subsequent
delay between two lineup identifications on the
confidence-accuracy relationship.
how eyewitnesses make their second identification deci-sions and their tendency to switch choices. For example,
Godfrey and Clark (2010) found that when the delay
be-tween a first and second identification was short (30 min), witnesses generally made consistent decisions (e.g. selecting the same person in both identifications). However, when the delay was one week, they found that witnesses made a combination of consistent decisions and switched decisions (from not picking a suspect the first time to picking one on the second occasion, the no-to-suspect shift). The long delay increased the proportion of no-to-suspect shifts. Steblay et al. (2013) used a 2-week delay between two (non-identical) lineups and they also found a mixture of consistent decisions and no-to-suspect shifts. Although the length of subsequent delay appears to influence witness identification behaviors, no researchers have yet examined CAC plots to see how the confidence-accuracy relationship changes with repeated tests.
Repeated identification and the confidence-accuracy relationship
In addition to reducing suggestibility in repeated lineups and examining the effects of delay, another critical issue is whether the CA relation remains strong across re-peated IDs. Eyewitness confidence has been widely used and endorsed as an indicator of accuracy by the U.S.
Su-preme Court, police, and jurors (Brewer & Burke,2002;
Deffenbacher & Loftus, 1982; Potter & Brewer, 1999). The CA relationship in eyewitness identification has been studied extensively (Bothwell, Deffenbacher, &
Brigham, 1987; Juslin, Olsson, & Winman,1996; Sporer,
Penrod, Cutler, & Read,1995). Through the use of CAC
plots, the current state of the evidence indicates that high confidence in an initial lineup indicates high
accur-acy (Wixted et al.,2015). As noted above, several studies
have shown that retention interval does not undermine
the CA relationship (Palmer et al., 2013; Sauer et al.,
2010; Wixted et al.,2016). However, these studies used
single tests, and our research will ask if the relation is maintained on the second lineup when repeated lineups are used.
Steblay and Dysart (2016) recommended against the
use of repeated identifications involving the same sus-pect, but it is unclear from their recommendations whether repeated identifications significantly impair the CA relationship measured using the CAC plots (Wixted
& Wells, 2017). There are at least two ways that
repeated identifications can affect the CA relation. For instance, witnesses who initially had low confidence in their identification decision may become more confident in a subsequent identification (confidence inflation). Prior research has shown that confidence inflation can occur if witnesses had previously received confirmatory
feedback (Bradfield & Mcquiston, 2004; Wells &
Bradfield, 1998; Wells, Olson, & Charman, 2003);
how-ever, it is uncertain whether repeating testing alone (e.g., repeated identification procedures) causes confidence
in-flation. Godfrey and Clark (2010, Experiment 2) found
that people who consistently chose the suspect were more confident in the subsequent lineup than in the
ini-tial show-up, but Steblay et al. (2013) did not find a
con-fidence inflation effect when people consistently chose the suspect in both an initial and a subsequent lineup with only the suspect in common. Alternatively, wit-nesses may maintain the same level of confidence across
lineups (Steblay et al.,2013), perhaps remembering their
level of confidence from the first occasion (a confidence carryover effect). Furthermore, the level of confidence expressed at an earlier identification may not only carry-over to a subsequent identification, but it may also pre-dict the commitment effect (e.g., high confidence individuals are more likely to commit to their initial de-cisions than low confidence individuals). In short, confi-dence inflation could produce poorer conficonfi-dence and accuracy calibration (e.g., if identification errors are made with higher confidence in Lineup 2 than Lineup 1), but a confidence carryover effect could maintain the CA relationship if it exists in the first lineup. Because no research has examined the effects of repeated lineups (in our experiments, identical lineups) on the CA rela-tionship using CAC plots, our experiments are the first to address this issue.
The present study
The follow questions summarize the objectives of the present study: 1) What are the effects of repeated identi-cal lineups and delay on the tendency to choose from a lineup and on identification accuracy? 2) Given an un-biased subsequent lineup (an identical lineup), are wit-nesses still committed to their initial decision? 3) Does confidence inflate with repeated lineups? Or does it pro-duce a confidence carryover effect? 4) More importantly, does the confidence-accuracy relationship remain intact despite the effects of repeated lineups and varying delays between them? Because prior studies have shown that both repeated lineups and delay can harm identification accuracy, the primary issue addressed in the current is ex-periments is whether the combination of these variables significantly impairs the confidence-accuracy relationship.
occasions, as in our experiments). We also varied the de-lays between the event and the first lineup (initial delay), as well as between the two lineups (subsequent delay), to determine effects on identification performance and the CA relationship (measured by CAC plots). Manipu-lating both the initial interval and the subsequent inter-val permits us, in certain conditions, to examine the effect of repeated testing without a confound of delay (i.e., the second test can be given in one condition at the same retention interval as the initial test in a different condition). In short, repeated lineups and delay tend to co-occur in the real world, and prior research has often only manipulated one of these two variables but not both.
We predicted a greater tendency to choose from the second lineup than the first lineup, both because all faces were repeated (enhancing their general familiarity). That is, we expected to observe nonchooser-to-chooser shifts based on familiarity of the faces, but familiarity would not accrue only to the suspect in target-present lineups, as it has in previous research. On the other hand, we should observe a greater tendency to choose after a short-initial delay than a long-initial delay be-cause people may feel less confident in their ability to make an identification after a long delay due to forget-ting. Identification accuracy (the number of guilty sus-pect IDs) should decrease with an increase in retention interval, and we expect more identification errors in the subsequent lineup than the initial lineup due to misattri-butions of familiarity accruing to all lineup members. There is no evidence from prior repeated lineups studies about whether the CA relationship will remain intact in a repeated lineup; however, based on prior literature, confidence inflation and confidence carryover effects will probably exist and could potentially harm the CA rela-tionship. The present study also compared confidence
judgments and response time in making judgments as indicators of accuracy and found confidence judgments were more predictive of accuracy than response times
(see the Additional file1for the response time data).
In short, we expected our experiments to confirm some findings from the prior literature and to address several issues for the first time regarding repeated lineups with the same fillers on both occasions. We also have a larger sample size and hence greater numbers of observations and more power than in prior repeated lineup studies.
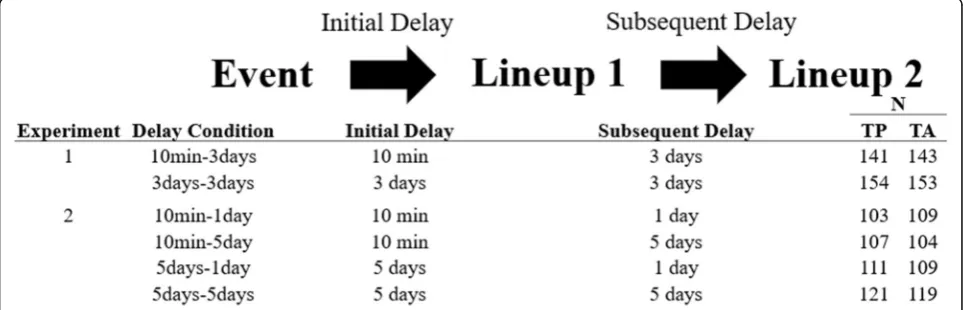
We will discuss Experiments 1 and 2 jointly because the same stimuli were used, and their overall designs were similar. The main difference between Experiments 1 and 2 was the length of delay between Lineup 1 and Lineup 2 (i.e., the subsequent delay). In Experiment 1, the subsequent delay was always three days. In Experi-ment 2, the subsequent delay was either one day (a short subsequent delay) or five days (a longer subse-quent delay).
Method Participants
For Experiment 1, 787 participants were recruited via Amazon Mechanical Turk (MTurk), but only 591 partic-ipants completed all the sessions. The remaining 196 participants consisted of those who had technical diffi-culties, completed the follow-up session later than the deadline, or dropped out of the study; their data were not included in the analyses. The number of participants in between-subject conditions ranged from 141 to 154
(see Fig.1). For Experiment 2, 1158 participants were
re-cruited via MTurk. Only 883 of them completed all the follow-up sessions. The remaining 275 participants whose data were dropped consisted of those who had technical difficulties, completed the follow-up session
later than the deadline, or dropped out of the study. The number of participants in between-subject conditions ranged from 103 to 121. All participants were compen-sated with payment ($2.50).
Design of Experiments 1 and 2
The design of Experiments 1 and 2 were generally
simi-lar, as shown in Fig. 1. The procedure always consisted
of the event (i.e., the crime video), lineup 1 and lineup 2. In Experiment 1, the initial delay (the delay between the event and lineup 1) was either 10 min or 3 days and the subsequent delay (the delay between lineups) was always 3 days. In Experiment 2, the initial delay was either 10 min or 5 days and the subsequent delay was either 1 day or 5 days. Experiment 1 sought to replicate the effects of initial retention interval on accuracy of choices and on the CA relation. The purpose of the various intervals be-tween lineups (1, 3 or 5 days across the experiments) was to see whether the length of the subsequent delay affected the likelihood of repeated decisions and switched decisions, as well as the CA relationship. Be-cause the subsequent delay was held constant in Experi-ment 1, we did not expect to find ID differences based on the initial delay conditions (unless ID on initial delay interacts with ID in the subsequent delay). In Experi-ment 2, we predicted the likelihood of switched deci-sions to increase as a function of the subsequent delay, but the critical issue is whether the CA relation would also be undermined. We used 1-day and 5-day delays in Experiment 2 to increase the disparity in identification accuracy and (probably) the number of repeated consist-ent decisions. In sum, there were two delay conditions in Experiment 1 and four delay conditions in
Experi-ment 2 (see Fig.1). Roughly half of the participants
re-ceived a present lineup and half rere-ceived a
target-absent lineup in both experiments (see Fig. 1 for the
exact numbers).
In addition to the eyewitness task, participants in both experiments also completed two distractors tasks (a free recall task and a lexical decision task, described below) after seeing the crime video. Together, the two tasks took approximately 10 min. The purposes were to pro-vide a distractor task and, if needed, to propro-vide co-variates for later analyses. However, we did not use them for this latter purpose. In Experiment 1, participants in the 10 min initial delay condition (i.e. the 10 min-3 days condition) saw lineup 1 after the filler tasks. Those in
the 3 days–3 days condition did not see lineup 1 until
three days later. Similarly, in Experiment 2, participants in the 10 min-1 day and the 10 min-5 days condition saw lineup 1 after the filler tasks. Those in the 5 days-1 day
and the 5 days–5 days condition did not see lineup 1
until five days later.
All sessions took place online. Email reminders were sent for each subsequent session along with a link to the online experiment and participant login information. Once they received the email, participants in Experiment 1 were given 36 h to complete the follow-up session and those in Experiment 2 were given 48 h to complete the follow-up session. The longer time window in Experiment 2 was used to minimize the number of late responses.
Materials
The present study used the video and lineup materials
from Mickes, Flowe, and Wixted (2012). The video
showed a white male (the perpetrator) walking into an unoccupied office and stealing a laptop from the office desk. Viewers had a clear view of the perpetrator as he left the office with the laptop. The video lasted for 23 s and the perpetrator’s face was in view for roughly 4–5 s.
Participants received either a present or target-absent lineup consisting of six people. The only differ-ence between the two lineups was that the target in the target-present lineup was replaced by a filler in the target-absent lineup. The same lineup was used twice, but the position of the photos was randomized on both
occasions. The lineup photos from Mickes et al. (2012)
were digitally modified so that all the lineup members wore a black shirt. This step was taken to prevent partic-ipants from using the color of clothing as a cue. We also adjusted for the spacing between the top of the lineup
member’s head and the top edge of the photo.
Further-more, because these photos were taken with different cameras, we made digital adjustments to equate the photo quality. This was to ensure that none of the pho-tos stood out. These changes doubtless made identifica-tion in our lineups more difficult than in Mickes et al. (2012). The photos appear in the Additional file1.
The eyewitness task materials for Experiment 2 were the same as those used in Experiment 1 except an-other filler in the target-absent lineup was randomly selected to replace one filler in the target-present lineup. In other words, Experiments 1 and 2 had four overlapping fillers in the target-present lineup condi-tion. This was to see whether using another target-replacement filler would produce different frequencies in the overall filler selections.
The categorized words for the free recall task were drawn from the norms of Van Overschelde, Rawson, and
Dunlosky (2004). Fifteen words from the fruit and the
vegetable categories were used for the list (Van
Besner (2008). None of the words from the free recall task overlapped with those in the lexical decision task.
Procedure
After general instructions about the experiment, partici-pants saw a video of the target committing a crime. They were simply instructed to pay attention to the video. Im-mediately after the video, participants were asked to complete the two distractor tasks: studying and recalling words (about 5 min) and the lexical decision task (an-other 5 min). In the free recall task, they saw a total of 30 words in a random order for two seconds each, with a 500 ms interstimulus interval. After the last word, par-ticipants were asked to recall as many words as possible, in any order, for four minutes. Then the screen automat-ically advanced to the lexical decision task in which participants were given instructions to decide whether each upcoming letter string represented a word or non-word. There were 16 practice trials followed by 80 ex-perimental trials. Each trial consisted of the following sequence of events: 1) a fixation point (+) presented at the center of the screen for 400 ms, 2) a blank screen for 200 ms. 3) appearance of the stimulus at the fixation point until the participant made a response. Participants
were instructed to press the “M” key for words and the
“Z”key for nonwords. If they made a correct response, a
blank screen was presented for 1600 ms before the fix-ation point appeared again. For incorrect responses, the
word “Incorrect” was shown slightly below the fixation
point for 1600 ms. These tasks took at least ten minutes to complete, but the exact duration depended on the participant’s pace during the lexical decision task.
In Experiment 1, after the lexical decision task, partici-pants saw lineup 1 in the 10 min-3 days delay condition or were asked to wait for a follow-up email in the next
few days (the 3 days–3 days delay condition). Prior to
seeing the lineup, participants were given instructions and were told that the suspect may or may not be present in the lineup. They made their identification de-cision by clicking on the face of the target, and then they
clicked the “next” button to submit their choice. If
par-ticipants judged that the target was not in the lineup,
they could reject the lineup via the“not present”button.
They were presented with either a target-present or target-absent lineup, and the same lineup was given in lineup 2 (e.g., participants saw the same target-present lineup or target absent lineup for both sessions). The position of the lineup members was randomized in both lineups. Response timing for responding started when participants saw the lineup and ended when they clicked
the “Next”button after selecting one of the faces or the
“not present”button. Participants were not given any
in-structions about how fast they should make a decision. After making their identification decision, they were
asked to make a confidence judgment using a 0 to 100 scale (0 = Not confident at all; 100 = Very confident). Participants rated their confidence by moving a slider from 0, where the cursor started, to a point on the scale between that value and 100. As they moved the slider, the corresponding numerical value was displayed above the slider. Both lineups used the same procedure, and no feedback was provided about whether participants made the correct choice. At the start of their follow-up session for Lineup 2, they were asked to identify the suspect from the video and were again told that the suspect may or may not be in the lineup. After making their identification, they were asked to provide a confidence judgment using the same scale. At the end of Lineup 2, participants were thanked for their participation and debriefed.
The general lineup identification process was similar for Experiment 2, but unlike in Experiment 1, choosers in Experiment 2 did not have to click on a lineup
mem-ber’s photo and the “Next” button to submit their
re-sponse. That is, Experiment 1 participants were free to change their decisions before they submitted their final response. In Experiment 2, they were informed that only their first response would be recorded. This was to equate the response time between choosers and non-choosers, because nonchoosers in both experiments only
had to click on the“Not Present”button to submit their
response. The confidence judgment section of the experiment was identical in both experiments.
Results and discussion
The results that answer our basic questions are rather numerous and complex. We have divided them into sections that address the issues we intended to address, and we discuss the implications of the results after they are presented.
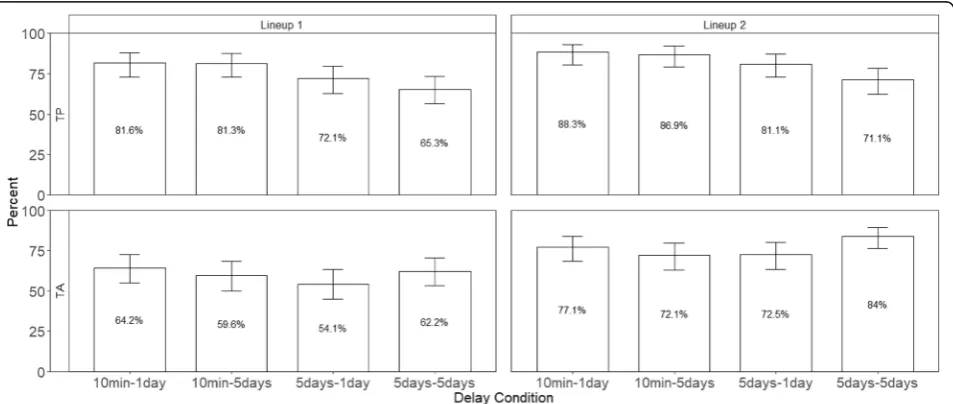
Repeated identical lineups increased the tendency to choose
Using an identical lineup procedure that made all faces somewhat familiar on the second ID resulted in an in-creased tendency to choose during the second lineup, just as occurs in other situations. The choosing rate (the percentage of times participants identified a face,
whether right or wrong) is shown in Fig.2for the
condi-tions of Experiment 1; the corresponding data for all
conditions of Experiment 2 is in Fig. 3. The choosing
rate for target-present lineups is presented in the top panels, whereas the choosing rate for target-absent lineups is in the bottom panels.
To evaluate our hypotheses, we used the lm4 package
in R (Bates, Mächler, Bolker, & Walker, 2015; R Core
Team,2017) to conduct a 2 (repeated lineups) × 2 (delay
conditions in Experiment 2, two conditions had an initial delay of 10 min and the other two conditions had an ini-tial delay of 5 days. Therefore, we compared the two 10-min conditions with the two 5-days conditions using a 2 (repeated lineups) × 2 (delay conditions) × 2 (lineup type) generalized mixed model. We also conducted
additional delay conditions comparisons for Lineups 1
and 2 separately for Experiment 2 (see Additional file1).
The dependent variable was the status of choosing (choosers were coded as 1 and nonchoosers were coded as 0). Each model used the binomial link function. Par-ticipants were specified as a random effect for both Fig. 2The percentage of choosers across lineups and delay conditions in Experiment 1. The top panels show the target-present lineups and the bottom panels show the target-absent lineups. Error bars represent 95% confidence intervals
models. Because we were interested in specific compari-sons, we constructed a no-intercept model that pro-duced the condition estimates as fixed effect estimates and then we performed specific comparisons (via z-tests) among the condition estimates that corresponded to the effects of interest. These multiple comparisons were conducted using the multcomp package (Hothorn,
Bretz, Westfall, & Heiberger,2012). There is no
consen-sus on the most appropriate method for calculating de-grees of freedom in mixed models. Accordingly, many R packages (including multcomp) report estimates divided by their standard errors as z values. For the sample sizes in our studies, this is a reasonable approximation.
Ad-justedp-values (Holm’s method) were reported for these
multiple comparisons. Unless otherwise indicated,
alpha = 0.05.
As predicted, there was a main effect of repeated
lineups in both Experiment 1, z=−4.16, p< .001, and
Experiment 2, z=−5.33, p< .001, showing that
regard-less of delay, the tendency to choose in Lineup 2 was greater than Lineup 1 (70.7% vs. 59.0% and 79.0% vs 67.4% in Experiments 1 and 2, respectively). In order to observe an increased tendency to choose in the subse-quent lineup, most choosers must remain choosers and some nonchoosers must make a positive identification in the second lineup, suggesting that (as discussed below) the commitment and misplaced familiarity effects are likely playing a role.
Although the main effect of delay did not reach signifi-cance in Experiment 1, it was significant in Experiment
2, z= 3.03, p< .01. Participants were generally less
in-clined to choose after a long-initial delay (5-day delay) than a short-initial delay (10-min delay). This outcome indicates that participants were less confident in their ability to make a positive identification when the initial test was delayed. This interpretation is reflected our Welsch t-test of the higher average Lineup 1 confidence ratings of choosers in the short versus long initial delay
in Experiment 1 (61.0% vs 47.3%), t (346.46) = 5.18,
p< .001, and Experiment 2 (61.4% vs. 40.3%),t(585.74)
= 9.94, p< .001. Moreover, because there was a main
effect of repeated lineups but no interaction between re-peated lineups and delay, rere-peated lineups seem to make participants more inclined to choose regardless of delay. Therefore, even though longer retention intervals made people less inclined to choose and lowered their confi-dence in their positive identifications, repeated lineups still make witnesses more inclined to choose from a sub-sequent lineup even with a relatively long delay.
The presence of the guilty suspect in the TP lineup did contribute to the higher TP choosing rate relative to TA choosing rate, although the effect seemed surprisingly small. The main effect of lineup type reached
signifi-cance in both Experiment 1, z=−2.78, p< .05, and
Experiment 2, z=−4.77, p< .001. However, there was
also a significant interaction between delay and lineup
type in Experiment 2,z=−3.37, p< .01. Follow-up tests
showed that choosing rate was greater in TP lineup than
TA lineup at the 10-min delay (84.5% vs. 68.3%), z=−
5.39, p< .001, but their choosing rates were no different
at a long 5-day delay (72.2% vs. 68.4%). After 5 days, par-ticipants were just as likely to choose from a TP as a TA lineup, which seems surprising because retention inter-vals longer than 5 days are common outside the labora-tory. All other effects were not significant, ps > .05. The lack of an interaction between repeated lineups and lineup type indicated that the choosing rate for the sec-ond lineup increased at about the same level in both TP and TA lineups.
Together, these findings showed that both the effects of retention interval and repeated lineups influence a
witness’s tendency to choose from a lineup. Participants
were less inclined to choose after a long-initial delay than after a short-initial delay and even when they did choose, they were less confident. However, this effect was qualified by the presence of the guilty suspect in the TP lineup. Participants were more inclined to choose from a TP lineup than a TA lineup after a short-initial delay, but they were equally likely to choose from either lineup type after a long-initial delay (Experiment 2). Critically, regardless of delay or the lineup type, repeated lineups increased the tendency to choose. Just as in ex-periments in which only the suspect is repeated between two lineups, repeating all the faces in two lineups leads to an increase in choosing. We turn next to accuracy.
Repeated identical lineups did not increase accuracy of identifying the suspect
Although participants were more likely to choose some-one from a second lineup than a first lineup, they were no more accurate in picking the suspect. Accuracy is represented by the guilty suspect ID rate, which is the number of guilty suspect IDs divided by the total num-ber of target-present lineups. Because the correct deci-sion for a target-present lineup is a guilty suspect identification, all other possible responses in a
target-present lineup (e.g., filler identification and “Not
Present”) are incorrect. The top panels of Figs. 4 and 5
As predicted, the guilty suspect ID rate decreased as a
function of delay in Experiment 1,z= 3.97,p< .001, and
Experiment 2, z= 6.85, p< .001, but guilty suspect ID
rate did not increase (or decrease) with repeated lineups,
ps > .05 in either experiment. In other words, repeated
identical lineups had no effect on overall accuracy. No
hypmermnesia – improved recognition with repeated
testing as obtained by Bergstein and Erdelyi (2008) in a
different paradigm -- occurred. All other effects were not significant, ps > .05. In addition, and similar to the effects of delay on choosing rate, the average confidence when picking guilty suspects was greater on a first Fig. 4The top panels show the percentage of suspect IDs and the bottom panels show the percentage of false IDs in Experiment 1. Error bars represent 95% confidence intervals
lineup after a short delay than after a long delay. (Ex-periment 1: 71.5% vs. 54.6%; Ex(Ex-periment 2: 72.5% vs. 48.4%). Therefore, the effects of delay were reflected in choosing rate, guilty suspect ID rate and the correspond-ing level of confidence when selectcorrespond-ing guilty suspects.
Most choosers repeated their initial decision in the second lineup identification
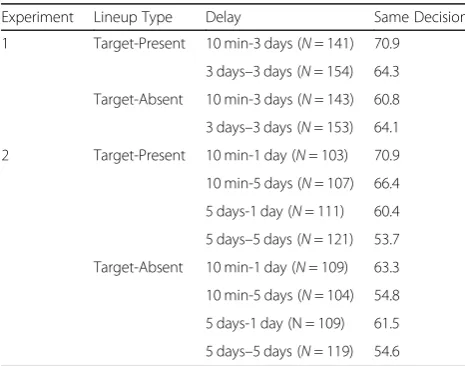
Although every lineup member was repeated in the sec-ond lineup, most identification decisions were carried over from the initial identification to the subsequent identification. The percentage of same and different de-cisions across Lineups 1 and 2 for Experiments 1 and 2
are shown in Table1. The“same decision”category
con-sists of identification decisions that were the same across Lineup 1 and Lineup 2 (e.g., selecting the suspect twice, a filler twice or rejecting the lineup twice). The“different
decision”category consists of participants making
differ-ent IDs across the lineups (e.g., selecting the suspect and then choosing a filler, among other possibilities).
Collapsing across all delay conditions, our chi-square goodness of fit test indicated a greater proportion of re-peated decisions (consistent decisions) than inconsistent decisions in Experiment 1 (65.0% were consistent
deci-sions), χ2[df= 1] = 53.01, p< .001, and Experiment 2
(60.5% were consistent decisions), χ2[df= 1] = 38.76,
p< .001. Further analysis revealed that this pattern was
driven primarily by choosers rather than those who rejected the lineup (nonchoosers). A 2 (choosers vs. non-choosers) × 2 (consistent vs. inconsistent) chi-squared
test confirmed this in both Experiment 1, χ2[df= 1] =
11.98, p< .001, and Experiment 2, χ2[df= 1] = 35.66,
p< .001. Therefore, choosers were more likely to repeat
their decisions compared to nonchoosers. This finding is consistent with choosing rate results reported in the pre-vious section, because most choosers repeated their
decisions and some nonchoosers became choosers in the subsequent lineup identification. Thus, we observed an increase in choosing rate in the subsequent lineup.
In an additional analysis, we examined whether TP and TA choosers repeated their decisions in the subse-quent lineup to a similar extent. Predictably, our one-proportion z-test showed that most TP choosers remained consistent in Experiment 1 (74.7% were con-sistent choosers), χ2[df= 1] = 45.5, p< .001, and
Experi-ment 2 (67.6% were consistent choosers), χ2[df= 1] =
40.8, p< .001. A similar pattern occurred with choosers
in TA lineups (i.e., incorrect identifications) in both
Ex-periment 1 (66.3% were consistent choosers), χ2[df=
1] = 17.23, p< .001, and Experiment 2 (67.2% were
con-sistent choosers), χ2[df= 1] = 31.2, p< .001. Thus, those who erroneously picked someone in a TA lineup on a first occasion carried over the error to the second lineup nearly two-thirds of the time, confirming a commitment effect. Although identical lineups might be expected to eliminate the bias observed in situations in which a sin-gle target is repeated, we still observed a commitment effect for choosers even when all faces were familiar in the second lineups.
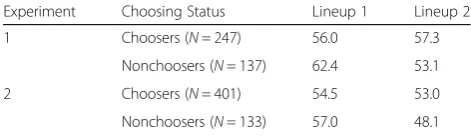
Repeated lineups did not lead to confidence inflation, but there was a carryover effect
Repeated lineups could affect the CA relationship in two ways: confidence inflation and confidence carryover ef-fect. We examined whether Lineup 2 identification deci-sions were made with more confidence than Lineup 1 decisions, especially for repeated decisions (consistent decisions). If Lineup 2 confidence is greater than Lineup 1 confidence, then there is a confidence inflation effect. If Lineups 1 and 2 are similar in confidence, then this outcome may indicate a confidence carryover effect.
Overall confidence in lineups 1 and 2
Aggregating all responses, Lineup 1 identification re-sponses were generally made with more confidence than
Lineup 2 responses in Experiment 1, t (590) = 4.78,
p< .001, and Experiment 2,t(882) = 4.49,p< .001. There-fore, witnesses were overall more confident in Lineup 1 than Lineup 2. Next, we examined confidence ratings for consistent choosers and consistent nonchoosers (i.e., wit-nesses who made the same decisions in Lineups 1 and 2).
Consistent choosers and no-to-suspect choosers
No inflation in confidence ratings occurred for choosers who repeated their initial decisions in the second lineup
(see Table2). Consistent choosers were equally confident
across lineups in Experiment 1 (56.0% to 57.3%) and
Ex-periment 2 (54.5% to 53.0%), with Bayes factors (BF01) of
8.09 and 4, respectively, indicating moderate support for the null hypothesis. However, they were more confident Table 1Experiments 1 and 2: Percentages of Same and
Different Decisions across Lineup 1 and 2
Experiment Lineup Type Delay Same Decision
1 Target-Present 10 min-3 days (N= 141) 70.9
3 days–3 days (N= 154) 64.3
Target-Absent 10 min-3 days (N= 143) 60.8
3 days–3 days (N= 153) 64.1
2 Target-Present 10 min-1 day (N= 103) 70.9
10 min-5 days (N= 107) 66.4
5 days-1 day (N= 111) 60.4
5 days–5 days (N= 121) 53.7
Target-Absent 10 min-1 day (N= 109) 63.3
10 min-5 days (N= 104) 54.8
5 days-1 day (N = 109) 61.5
than choosers who initially rejected but chose someone at the second lineup (no-to-suspect shift). In Experiment 1, our independent t-test indicated that witnesses who made no-to-suspect shifts in Lineup 2 were less confident than consistent choosers in Lineup 1(44.4% vs.
56.0%), t (350) = 3.84, p< .001, and at Lineup 2 (44.4%
vs. 57.3%), t(350) = 4.14, p< .001. In Experiment 2, our
independent t-test revealed that witnesses who made no-to-suspect shifts in Lineup 2 were again less confident than consistent choosers at Lineup 1 (43.0%
vs. 54.5%), t (554) = 4.41, p< .001. Due to unequal
vari-ance in Lineup 2, we conducted a Welsch t-test and ob-tained the same pattern of results for our comparison of no-to-suspect shifts and consistent choosers at Lineup 2
(43.0% vs. 53.0%), t (309) = 4.02, p< .001. Therefore,
although there was no overall confidence inflation for consistent choosers, they were more confident than those who initially rejected but chose someone only in the second lineup.
Consistent correct and incorrect IDs
While consistent choosers were equally confident in both lineups, the level of confidence expressed did differ across response types (e.g., guilty suspect IDs vs incor-rect IDs). For example, collapsing across delay condi-tions for Lineup 1, average confidence from consistent guilty suspect IDs in TP lineups was greater than con-sistent incorrect chooser IDs in TA lineups (68.0% vs. 47.6% and 66.6% vs. 51.5% in Experiments 1 and 2, re-spectively). The same pattern held for Lineup 2 (66.0% vs. 51.5% and 65.8% vs. 50.4%). Thus, consistent correct choosers (those who made guilty suspect IDs) were gen-erally more confident than those who made consistent incorrect IDs in TA lineups.
Consistent nonchoosers
On the other hand, our paired t-test indicated that non-choosers who repeated their decisions in the second lineup actually became significantly less confident in
both Experiment 1 (62.4% to 53.1%), t (136) = 4.33,
p< .001, and Experiment 2 (57.0% to 48.1%), t (132) =
4.62, p< .001. Therefore, without post-ID feedback on
the first lineup, a second identical lineup did not cause confidence inflation for consistent choosers, but it made consistent nonchoosers less confident about their
decisions. One possible interpretation is that the famil-iarity of all members of the lineup on the second occa-sion made it more difficult for participants to reject the lineup and thus, even when they did so, they expressed less confidence in their decision.
Correlation between lineups 1 and 2
Although there was no confidence inflation, Lineup 1 confidence was positively correlated with Lineup 2 confi-dence. In Experiment 1, we obtained a high correlation
for both consistent choosers, r(245) = .77, p< .001, and
for consistent nonchoosers,r(135) = .63,p< .001. In Ex-periment 2, we similarly found a high correlation for
consistent choosers, r(399) = .82, p< .001, and for
con-sistent nonchoosers, r (131) = .69, p< .001. Together
with the average confidence results, consistent choosers and nonchoosers did not show an overall confidence in-flation effect; however, their initial confidence tended to be correlated their subsequent identification confidence, suggesting the presence of a confidence carryover effect.
Initial confidence predicted the commitment effect
Because most participants repeated their initial decisions and their initial confidence was correlated with their
subsequent identification confidence, we examined
whether the level of confidence expressed at Lineup 1 was predictive of repeated decisions at Lineup 2. Said differently, were witnesses who were highly confident in their first decision (correct or incorrect) more likely to provide the same decision on the second lineup than those who were less confident in their initial decisions? To evaluate this hypothesis, we categorized participants by whether they made a consistent or inconsistent deci-sion across the two lineups. Then using the level of confi-dence participants expressed during Lineup 1, we calculated the proportion of these participants who re-peated their decisions in Lineup 2. Specifically, we were in-terested in the proportion of consistent and inconsistent
decisions at a high confidence cutoff (90% or above). Table3
shows the proportion of consistent responses above and below a confidence rating of 90% in both experiments.
Aggregated across Experiments 1 and 2, our 2 (above vs. below 90% confidence) × 2 (consistent vs. inconsist-ent responses) chi-square test showed that the propor-tion of consistent responses above 90% confidence was greater than the proportion of consistent responses
below the cutoff (76.3% vs. 60.6%, respectively), χ2[df=
1] = 14.9, p< .001. In addition. we decomposed overall
results into data for choosers (middle columns of Table
2) and nonchoosers (right columns of Table 2). The
greater consistency of among participants who rated their confidence at 90% or more held for both sets of participants, but our 2 (chooser vs. nonchooser) × 2 (consistent vs. inconsistent responses) chi-square test Table 2Experiments 1 and 2: The Average Confidence Ratings
for Consistent Choosers and Nonchoosers
Experiment Choosing Status Lineup 1 Lineup 2
1 Choosers (N= 247) 56.0 57.3
Nonchoosers (N= 137) 62.4 53.1
2 Choosers (N= 401) 54.5 53.0
indicated that the effect was greater for choosers (88.6%) than for nonchoosers (64.2%),χ2[df= 1] = 13.2,p< .001.
In short, participants expressing high confidence were more likely to make the same choice a second time than were those expressing lower confidence on the first lineup. Thus, confidence is not only associated with identification accuracy, but initial confidence can be a predictor of the commitment effect (whether witnesses would repeat their initial decision in a subsequent lineup). Putting this outcome together with our previous findings, consistent witnesses generally maintained similar levels of confidence across repeated lineups, but their initial confidence predicted the likelihood that they would provide the same decision (right or wrong) on a subsequent identification. We also con-sidered the effects of subsequent delay on consistent
decisions; while the results were in the predicted dir-ection with less consistent decisions after long delays, most of the analyses did not reach significance (see Additional file1).
A strong confidence-accuracy relationship was obtained in all conditions
The critical question for the criminal justice system is how repeated lineups and delays affect the confidence-accuracy relationship. Briefly, our results show a strong CA relationship even with repeated (identical) lineups and even with long delays. Repeated lineups did not harm the confidence-accuracy relationship in our experi-ments, but the procedure did not improve it either.
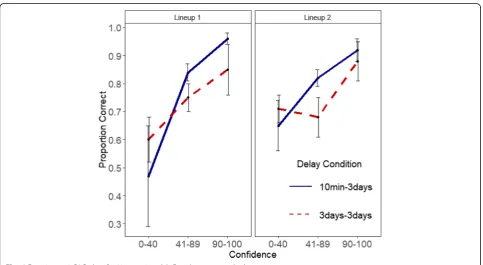
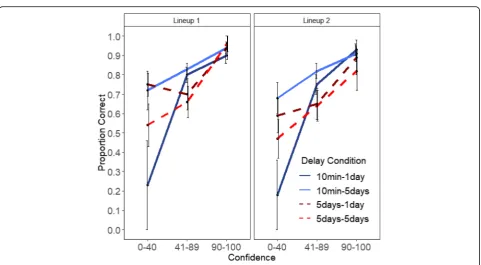
Figures 6and 7show the confidence-accuracy
charac-teristic (CAC) plots for Lineups 1 and 2 in Experiments Table 3Experiments 1 and 2: The Percentages of Consistent Responses Above and Below a Confidence Rating of 90%
Experiment Delay Overall Chooser Only Nonchooser Only
Above Below Above Below Above Below
1 10 min-3 days 79.0 63.8 88.2 70.3 71.4 54.1
3 days–3 days 73.0 63.0 81.8 68.8 69.2 52.6
Overall 76 63.3 85.7 69.5 70.2 53.3
2 10 min-1 day 80.0 64.8 87.0 73.3 57.1 43.1
10 min-5 days 81.5 57.6 88.9 64.1 66.7 41.5
5 days-1 day 63.0 60.8 100 65.7 45.5 51.4
5 days–5 days 75.0 53.1 100 58.8 57.1 42.5
Overall 76.5 58.8 90.2 65.3 55.9 44.9
1 and 2, respectively. Following the procedure from
Mickes (2015) and Wixted et al. (2015) for constructing
CAC plots, accuracy was calculated for each confidence bin as the number of correct suspect IDs / (correct sus-pects IDs + false IDs). Because there was no designated innocent suspect in the target-absent lineups, the sum of false IDs for a particular confidence bin (e.g., all the false
identifications made with a confidence rating of 0–40%)
was divided by 6, the lineup size (Mickes, 2015). The
Additional file1contains the distribution of suspect and
false IDs across three confidence bins (Low: 0–40%,
Medium: 41–89%, and High: 90–100%). The standard
error bars in the figures were computed using a jack-knife procedure.
We observed a positive relationship between
confi-dence and accuracy in both experiments (Figs. 6 and 7)
even in the repeated lineup conditions and even with long delays. In Experiment 1, accuracy in the highest confidence bin for the first lineup (after 10 min) was .96 and it was .92 on the second lineup given 3 days later. When the first lineup was given after 3 days, accuracy was .86 and it was .88 on the repeated lineup 3 days later
(see Fig. 6). Comparable Lineup 1 accuracy levels in
Ex-periment 2 for the 10 min-1 day, 10 min-5 days, 5 days-1
day, and the 5 days–5 days were .90, .94, .95, and .96,
re-spectively. The corresponding Lineup 2 accuracy levels
were .93, .91, .90, and .83 (see Fig.7). Because the error
bars overlapped for the 90–100% confidence bin, there
was no difference in accuracy in the various delay condi-tions and across the two lineups.
Consistent with prior literature (Palmer et al., 2013;
Sauer et al., 2010; Wixted et al., 2016), high confidence
continued to be associated with high accuracy even after a long initial delay and/or after a long subsequent delay. In addition, our study shows that this strongly positive relationship also holds true for repeated lineups. This finding, however, is not surprising considering the re-sults in the previous sections. Most participants repeated their initial decision in the subsequent identification. Those who made a high confidence response for the first lineup were generally more likely to do so again for the second lineup. Yet despite making the same decision, they did not increase their confidence (i.e., they showed a carryover of confidence rather than its inflation). Thus, there were no significant differences in accuracy between
Lineup 1 and Lineup 2 at the 90–100% confidence bin.
We do not discuss confidence effects in the other bins, because only initial high confidence decisions are critical in eyewitness situations.
General discussion
Prior research with repeated lineups (or show-ups or mugshots prior to lineups) has shown that the procedure biases selection toward the suspect, the only face re-peated on the two occasions. We tried to overcome this problem by using identical lineups so that all faces were repeated, albeit in a different random order. Despite this change in procedure, our results were similar to those of prior studies that used a single repeated target (Hinz &
Pezdek,2001; Pezdek & Blandon-Gitlin,2005; Steblay et
al.,2013). When the entire lineup was repeated, and re-gardless of whether the suspect was in the lineup, wit-nesses were generally more willing to choose from a second lineup than from the initial lineup. In addition, this increase in choosing did not improve accuracy of responding. No recognition hypermnesia was obtained,
as found previously (Bergstein & Erdelyi,2008; although
see Payne & Roediger, 1987). Thus, our revised
proced-ure that eliminated the most basic flaw in all previous
repeated identification procedures – only one repeated
face–still did not overcome the main problems already
identified in repeated lineups – familiarity and
commit-ment effects. Besides replicating prior findings with our new procedure, we also confirmed that witnesses were less able to identify the guilty suspect after a long delay than a short delay; however, they were also less willing to make a positive identification, demonstrating their awareness of their declining retention. This interpretation is further supported by the lower confidence ratings for positive identifications after a long delay than a short delay. In addition to these findings that largely replicate past work, our results extend our understanding of repeated lineup procedures in four basic ways. We discuss these in turn and relate each finding to the prior literature.
First, we showed that, regardless of the retention inter-val and whether or not the lineup includes the suspect,
re-peated lineups exert similar effects on witnesses’
willingness to make a positive identification. When a lineup was repeated, witnesses were willing to make a positive identification despite their initial reluctance, as we observed in witnesses switching from no choice on a first lineup to choosing a suspect on the second lineup. This outcome replicated across our various initial- and subsequent-delay conditions and it is likely due to general increased familiarity of faces on the second occasion. This tendency to select a face based on familiarity counteracts the trend noted above that, on a first test, witnesses are re-luctant to select a face the longer the retention interval and even when they do so, they are less confident in their
choice. However, according to Godfrey and Clark (2010),
repeated identification procedures may also heighten
wit-nesses’expectations that the suspect would be present in
the lineup. Witnesses in the present study may increase choosing on the second lineup because of a shift in their decision criterion or due to misplaced familiarity, but their decision to choose was not simply due to a single-repeated target because we used identical lineups.
Second, we found that witnesses generally remain committed to their initial decision when they pick a sus-pect from on a repeated lineup, even when they were not biased towards choosing a single repeated target. Like studies that used a single repeated target (Memon
et al., 2002; Steblay et al., 2013), we also observed the
commitment and misplaced familiarity effects with
identical lineups. Because all six faces were repeated in our identical lineup procedure, our results reflected the commitment and misplaced familiarity effects that could
not be due to misinterpretation of the police’s
(experi-menter’s) intention or misplaced familiarity from a
single-repeated target. Therefore, we can conclude that the misplaced familiarity and commitment effects are in-herent in repeated lineup procedures even without the problem of single-face repetition. These results suggest that source monitoring (Johnson, Hashtroudi, & Lindsay,
1993) is an issue in both repeated lineups with a
single-repeated target and identical lineups. When witnesses are shown a second lineup, they may misattribute their memory of faces from the first lineup for their memory of the original event. As a result, some witnesses may re-main committed to their initial decision and others may choose to make a positive identification only in the sec-ond lineup. Such source monitoring errors seem
ubiqui-tous in eyewitness research, both in eyewitness
identification and from misinformation provided after
witnessing a crime (Lindsay & Johnson, 1989). Our
re-sults can also be interpreted by Godfrey and Clark
(2010)‘s decision criterion explanation. Witnesses who
made a no-to-suspect shift at Lineup 2 were less confident than consistent choosers at Lineups 1 and 2. If we consider the average confidence expressed for posi-tive identifications as not only a measure of witness cer-tainty but also as an indicator of the willingness to make a positive identification based that level of certainty (i.e. decision criterion), then a lower average confidence in one group relative to another can suggest differences in decision criterion (the acceptable level of certainty to make a positive identification). It is possible that both problems in source monitoring and changing decision criteria can influence the decision process involved in re-peated identifications.
Third, we showed that the initial confidence rating is a good predictor of the commitment effect. Consistent with Koriat (2012)‘s idea that confidence is a predictor of re-peated judgments, we also showed that high confidence identification decisions (regardless of accuracy) are more likely to be repeated in a subsequent identification than low confidence decisions. In addition to causing the same decision, the initial level of confidence is often carried over to confidence in selecting a suspect in the subsequent
lineup. Similar to Steblay et al. (2013), the consistent
choosers in the present study were also equally confident across in both lineups. However, consistent nonchoosers did become less confident, which might suggest that prior familiarity can make it hard for witnesses to confidently reject a later lineup, as in other studies of misplaced
famil-iarity (e.g., Jacoby et al., 1989). Nevertheless, both
Fourth, and perhaps most importantly, our experi-ments showed that a strong confidence-accuracy rela-tionship remains true for repeated lineups, even ones occurring after 6-day and 10-day retention intervals since viewing the crime. Prior repeated lineup studies that reported the commitment and misplaced familiarity effects (Steblay & Dysart, 2016; Steblay et al.,2013) did not examine the influence of these effects on the confidence-accuracy relation. Our experiments lead us to conclude that the confidence-accuracy relationship remains strong despite these biasing effects. In addition, the strong relation held for all initial- and subsequent-delay conditions. Because high confidence decisions are often carried over to a subsequent lineup and the level of confidence is also often maintained (rather than in-flated), repeated lineups did not significantly impair the confidence-accuracy relationship. Thus, confidence is not only predictive of accuracy across various retention inter-val (Palmer et al.,2013; Sauer et al.,2010), but it remains a good indicator of accuracy even for repeated lineups.
One surprise in our data is that no confidence infla-tion occurred on the second lineup of our repeated lineups. One great problem in the criminal justice sys-tem has been the growth in confidence over time, such that a low confidence initial judgment becomes a high confidence judgment in the courtroom. This problem is one of the root causes of people being convicted by
mis-taken eyewitness identification. In Convicting the
Inno-cent, Brandon Garrett (2011) wrote about people
convicted of crimes and then later exonerated by DNA
evidence, “I expected to read that these eyewitnesses
were certain at trial that they had identified the right person. They were. I did not expect, however, to read testimony by witnesses at trial indicating that they had
earlier had trouble identifying the defendants … Yet in
57% of these trial transcripts (92 of 161 cases), the
wit-nesses reported that they had not been certain at the
time of their earlier identifications”(p. 49). He identified several causes of confidence inflation over time, such as confirmatory feedback from the police and the fact that people are often repeatedly tested. Yet in our experi-ments, repeated testing did not lead to confidence infla-tion. Our experiments are the first to use identical repeated lineups, but our results are similar to Steblay et
al. (2013)’s repeated lineups with a single-repeated
tar-get. Steblay and colleagues also did not observe a confi-dence inflation effect. On the other hand, Godfrey and
Clark (20102), Experiment found that people who
con-sistently chose the suspect were more confident in the subsequent lineup than in the initial show-up. Therefore, confidence inflation may be possible in some circum-stances, but further research is required to determine the cause. In addition, research participants and actual
witnesses might approach repeated identifications
differently. Compared to research participants, actual witnesses may repeatedly reenact the crime mentally over time, imagining the scene vividly and if they re-member it with the wrong perpetrator as the assailant in the crime, their confidence in their judgment is likely to grow. Future research should examine the ef-fects of repeated testing on and imagination inflation on actual witnesses.
In summary, despite our attempts to remove the biases associated with a single-repeated target, our identical lineup procedures still showed the negative effects previ-ously reported in other repeated lineup studies. The good news is that these effects did not significantly undermine the confidence-accuracy relationship, at least in our studies with identical lineups. Therefore, when re-peated lineups are not avoidable, confidence can still be a useful indicator of accuracy. Of course, this outcome needs to be replicated in the other kinds of single-target repeated lineups now being used.
Limitations
We acknowledge there are some limitations with the present study. For example, we only used one set of lineup materials. Different eyewitness identification ma-terials can vary in the level of difficulty, which can
po-tentially produce different results in performance
measures (e.g., choosing rate and guilty suspect ID rate). Our lineup, due to the changes we made in shirt color, was quite difficult. On the positive side, we show that even with a difficult lineup, the confidence-accuracy relation is strong: High confidence still indicates high accuracy. Thus, in this sense, the difficulty of our single lineup makes the strong CA relationship more convincing.
Another issue is that our experiments did not ran-domly select lineup members from a pool of faces (a filler pool), which limits the generalization of our results across different arrays of fillers. However, some of our findings, such as the commitment effect, were found in studies that had used materials different from ours. Nevertheless, we of course recommend that the effects reported in the present study be replicated using other sets of eyewitness materials.
Implications
Repeated lineup procedures
Steblay and Dysart (2016) had recommended against the