O R I G I N A L R E S E A R C H
Open Access
Contrast-noise-ratio (CNR) analysis and
optimisation of breast-specific gamma
imaging (BSGI) acquisition protocols
Dennis Dickerscheid
1,2*, Jules Lavalaye
2, Leo Romijn
1,2and Jan Habraken
1,2Abstract
Background: Breast cancer is one of the most prevalent forms of cancer in women. Breast-specific gamma imaging (BSGI) is a diagnostic imaging method that uses sestamibi-labelled 99Tc and a dedicated gamma camera to localize malignant lesions in breast tissue. The aim of this study is to investigate if the current acquisition protocol for BSGI at our hospital is optimized for the detection of lesions in our patients.
Methods: We analyzed patient data and performed a phantom study with a Dilon 6800 gamma camera. The patient data were collected from a group of 13 patients (740 MBq 99mTc-sestamibi , four views per patient were dynamically acquired with a frame duration of 30 s per frame and a total acquisition time of 8 min per view). Reduced-time static images were created, and contrast-to-noise ratios of identified hotspots were determined for different acquisition times. For the phantom study, we used a contrast detail phantom to investigate the contrast and resolution properties, within the range of relevant clinical acquisition parameters. The phantom was filled with a concentration of 80 MBq in 500 ml of water, and we dynamically acquired frames for a total acquisition time of 60 min using a general purpose (GP) collimator. To compare the GP collimator with the high-resolution collimator, a second acquisition was made for both collimators with a total acquisition time of 16 min.
Results: The initial analysis of BSGI scans of the 13 patients showed that a dose reduction by a factor of 3 would not have reduced the number of observable hotspots in each of the acquired views. However, a subsequent systematic analysis of our protocol with a contrast-detail phantom showed that dose reduction results in a lower observability of hotspots, whereas increased doses resulted in a higher observability.
Conclusion: We believe that the results of our phantom study are relevant for clinical practice and that further dose reduction cannot be recommended for the BSGI exams at our hospital and that an increase of the administered activity should be considered.
Keywords: Breast cancer, Scintimammography, 99mTc-sestamibi, Breast-specific gamma imaging, Contrast-detail phantom, CNR analysis
Background
Breast cancer is one of the most prevalent forms of can-cer in women. In the Netherlands, every year 13,000 new cases are reported, and it is a condition that affects one in every nine women. Patients with breast cancer have a good prognosis if the disease is detected early.
*Correspondence: [email protected]
1Department of Medical Physics, St. Antonius Hospital, Nieuwegein, 3435 CM, The Netherlands
2Department of Nuclear Medicine, St. Antonius Hospital, Nieuwegein, 3435 CM, The Netherlands
Mammography is the standard modality of choice for screening and diagnosing breast cancer. Unfortunately, the mammogram is not conclusive in all cases, especially in women with dense breast tissue; mammograms can be difficult to interpret and can lead to ambiguous findings. As a result, these patients are referred for a magnetic reso-nance imaging (MRI) scan. Breast MRI has a high sensitiv-ity for detecting malignancy in the breast, but specificsensitiv-ity is sub-optimal, potentially leading to unnecessary invasive procedures [1]. Breast-specific gamma imaging (BSGI) is an improved breast scintigraphy technique that uses a
Dickerscheidet al. EJNMMI Research2013,3:21 Page 2 of 9 http://www.ejnmmires.com/content/3/1/21
sensitive single-head small-field-of-view gamma camera [2-4]. Patient dose minimisation is an important aspect of the optimisation of any nuclear medicine protocol. The importance of dose optimisation depends, among oth-ers, on the patient population. For population screening, a much lower patient dose is acceptable than that for a patient group with a high risk of malignancy because in the screening setting, the number of subjects is higher and the chance of an individual positive finding is much lower. The average mean glandular radiation dose for a two-view digital mammography is 3.7 mGy [5] , from which we estimate the patient dose (using ICRP 103 using a weighting factor of 0.12) for a four-view mamography exam to be 0.88 mSv. For a typical BSGI examination, the patient dose varies between 5.9 and 9.4 mSv for an admin-istered activity of 740 to 1, 184 MBq of 99mTc-sestamibi. Recent work by Hruska et al. showed that significant dose reductions could be achieved when a dual-head breast-specific gamma camera is used [6,7]. At our hospital, we have a single-head breast-specific gamma camera (Dilon 6800, Dilon Technologies Inc., Newport News, VA, USA) for which we want to explore the possibilities of reduc-ing acquisition times or, equivalently, further reducreduc-ing patient dose. Specifically, this study concentrates on dose optimisation of the BSGI protocol at our hospital, and we introduce a contrast-to-noise ratio (CNR) analysis methodology and a phantom-based approach to deter-mine if imaging longer (or equivalently giving a higher dose) could lead to the observation of more hotspots. We also applied the CNR analysis to data from a small group of patients.
Methods
Patient data acquisition
The acquisition protocol at our hospital consists of a sin-gle dose of 740 MBq of 99mTc-sestamibi (5.9 mSv) that is administered intravenously to the patient. On average, the acquisition of images started 22 min p.i. Subsequently, craniocaudal (CC) and mediolateral oblique (MLO) views are acquired for each breast. The four views (RCC, RMLO, LCC, LMLO) are acquired with a general-purpose col-limator for 8 min per view using a matrix size of 80 × 80 pixels and a pixel size of 3.2 mm × 3.2 mm. Our acquisition protocol has been adapted from the scinti-mammography protocol of the Dutch Society of Nuclear Medicine (NVNG) and is in line with the guidelines of the SNM [8] and the EANM [9]. For this study, we analyzed data from 13 patients (all patients were female, age range 43 to 66 years; mean 50.9 years) who were all referred to our department because of known or suspected malig-nant disease. The patient exams were performed using a dynamic acquisition mode, with a frame duration of 30 s per frame and a total acquisition time of 8 min. From the acquired data, we determined the background count rates,
hotspot contrasts and hotspot sizes for different acquisi-tion times. From the acquired views, a total of 49 views were included in the study (one patient had previously undergone a breast resection, and for another patient, the acquisition time from one of the views was reduced to 5 min due to patient discomfort). We derived time-reduced static images, from the dynamic data, for acquisition times of 2, 2.67, 4 and 8 min. The 8-min static views were used for routine diagnostic purposes. We used the reports from the nuclear medicine physicians as the reference from which we identified all the clinically relevant hotspots for which we determined the CNR.
Based on the retrospective nature of this study, IRB was waived by the Medical Ethics Review Committee of St. Antonius Hospital.
Contrast-detail phantom and acquisition
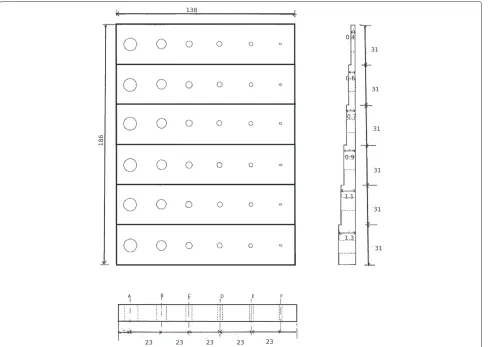
To simulate the hotspots that we see on the scinti-mammography images in clinical practice, we used a contrast-detail (CD) phantom which shows ‘hot’ areas or lesions of varying sizes and contrasts in known locations in a background that has no cold spots. The contrast-detail phantom that we used was built at the depart-ment of biomedical engineering at our hospital, based on the design previously published by Mor´e et al. [10]. In Figure 1, we show a transverse view of the design of the phantom.
Figure 1Contrast-detail phantom.Schematic of the contrast detail phantom design. The dimensions of the phantom are 186 mm×138 mm. Within each row, the separation between the centres of the holes is 23 mm. The separation between the centres of the holes in adjacent rows is 31 mm. The depths of the holes in each row are 1.3, 1.1, 0.9, 0.7, 0.6 and 0.4 cm, respectively.
The contrast of the holes in each row of the phantom depends, in first approximation, on the thickness of the PPMA and is given by the following equation [10]:
C=eμa(h−l)
1−eμWh 1−eμWl
−1, (1)
where μa ( 0.17 cm−1 for 140 keV) is the linear atten-uation coefficient of accrylic, μw ( 0.15 cm−1 for 140 keV) is the linear attenuation coefficient of water,his the height of the column for each hole, andlis the height of the background columns. The contrast, as described by Equation 1, is independent of the diameter of the holes and of the acquisition time. In other words, the back-ground counts are controlled by the acquisition time, but the contrast will remain the same in principle. In Table 1, the theoretical contrasts of the phantom are given includ-ing the attenuation of the PMMA and excludinclud-ing the partial volume effect.
For the measurements, we filled the phantom with
a concentration of 80 MBq of 99mTc in 500 ml of
water. The phantom was subsequently imaged with a general-purpose (GP) collimator and a high-resolution (HR) collimator. These collimators have different res-olution and sensitivity properties, with a sensitivity of 180 and 90 counts/MBq for the GP and the HR col-limator, respectively. The ratio of these sensitivities numerically equals 2.0, which means that to receive the same number of counts, one needs to image twice as long with the HR collimator compared to the GP collimator.
Dickerscheidet al. EJNMMI Research2013,3:21 Page 4 of 9 http://www.ejnmmires.com/content/3/1/21
Figure 2Structure of composite normalized image.Example of a composite normalized image. The numbers on the right show the expected contrast of the holes in each row based on Equation 1 and are also summarized in Table 1.
examples of the normalized phantom image for four dif-ferent backgrounds for the GP and the HR collimator, respectively.
The orientation of the images is such that in the verti-cal direction, the contrast increases as we move down the rows. In the horizontal direction, the holes of the phantom become smaller from right to left, and due to the partial volume effect, the observed size of the holes levels off and, instead, the contrast becomes smaller.
Analysis
The observability of a hotspot in a noisy background depends not only on the contrast of the hotspot, but also on the observed size of the hotspot and on its back-ground. We therefore have performed a CNR analysis of
Table 1 Theoretical contrasts of the phantom
Row l Contrast
1 1.1 1.49
2 1.3 1.06
3 1.5 0.75
4 1.65 0.57
5 1.8 0.42
6 2.0 0.25
Overview of contrasts based on Equation 1 for each row.
both the patient data and the phantom data. The CNR is a dimensionless parameter and defined here as [11] follows:
CNR= C
COV,
where the contrast C is defined with respect to a back-ground region and given byC=(Nl−Nbg)/Nbg, whereNl
can be either the maximum or average number of counts per pixel measured in the ROI that was drawn around the hotspot. Because most of the hole diameters are com-parable to or smaller than the pixel size of the camera, we have used the maximum ROI value for our analysis.
Nbg is the average number of counts of the background. The background ROIs for each row were chosen to be as large as possible without overlapping with the holes in each row. The coefficient of variation (COV) is given by COV = σbg/Nbg, whereσbg is the standard deviation of the background ROI.
The detectability of a hotspot by an observer is cor-related with the CNR value of the hotspot. The Rose criterion states that if the CNR of a hotspot becomes smaller than 3 to 5, it becomes very difficult to observe the hotspot[11]. By reducing the acquisition time, we deter-mined the number of hotspots that have a CNR smaller than the Rose criterion. It is important to note that the CNR analysis of the patient data was performed on the CC and MLO views separately, which means that only con-clusions about the detectability of a lesion on a separate view can be made. For the phantom, we have defined the observability as the percentage of the holes in the phan-tom that have a CNR greater than a given threshold value (based on the Rose criterion). For example, if the observ-ability of the phantom is 50% with a threshold of 3, this means that 50% of the 36 holes of the phantom have a CNRmaxthat is greater than 3. By determining the observ-ability as a function of acquisition time, we can character-ize the way in which the detectability of lesions increases with increasing acquisition time for a given camera. We repeated this procedure for a range of threshold values to determine the dependency on the threshold value. As an additional practical application of our method, we com-pared the observability of the GP and the HR collimator, taking into account the difference in sensitivity of the two collimators.
Results
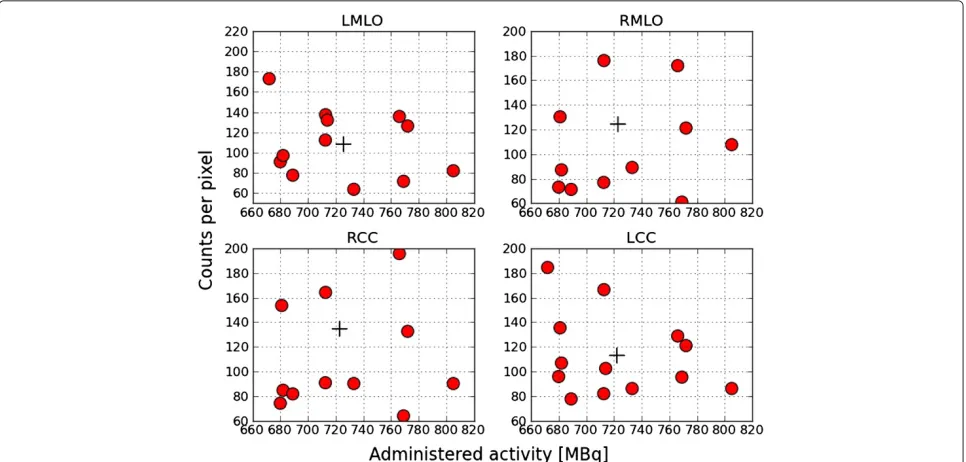
Patient data
Figure 3Examples of acquired GP and HR images.Example of normalized phantom images for data acquired with both GP and HR collimators.
to 195) after an acquisition time of 8 min with an average administered activity of 723 MBq.
From the set of 49 views, the nuclear physician identi-fied 52 hotspots to be possibly clinically relevant. Next, we determined the observed size and contrast of the hotspots
with respect to the background of the image. The results are shown in Figure 5.
From Figure 5, we notice that the smallest observed hotspots sizes are around 9 mm, and the lowest observed contrasts are around 0.1. The CNR values of the identified
Dickerscheidet al. EJNMMI Research2013,3:21 Page 6 of 9 http://www.ejnmmires.com/content/3/1/21
Figure 5Observed lesion sizes and contrasts.Overview of observed lesion sizes versus observed contrast.
hotspots are summarized in Table 2 for the various acqui-sition times. We see that all indentified hotspots have a CNRmax > 2.5 after the acquisition time of 8 min. For this reason, we use CNRmax = 2.5 as our clinical refer-ence value throughout this study. From Table 2, we see that when we reduce the acquisition time by a factor of 4, three of the identified hotspots have a CNRmax < 2.5, and visual inspection confirmed that these hotspots were no longer observed. In Figure 6, we show the correspond-ing patient data for these three hotspots. We have marked the background ROIs (dotted lines) and the three hotspots (solid lines).
The hotspots which had both maximum and mean CNR<2.5 were not detectable when reviewed.
In summary, we see that for our patient group, the iden-tified hotspots all have a CNRmax > 2.5. Reducing the scanning time or, equivalently, patient dose by a factor of 3 does not lead to hotspots with CNRmax<2.5.
Phantom data
To compare the phantom data acquired with the GP colli-mator and patient datasets, we determined for the phan-tom data for each acquisition time the average number of background counts. The average background counts in
Figure 6Example of CNR measurement in patient data.Three patients with hotspots for which CNRmax≤2.5 when the acquisition
time is reduced to 2 min. The dotted line corresponds to the background ROI used, and the solid line marks the hotspot of interest. The numbers shown correspond to the CNRmaxwithin the ROI.
the phantom were then converted to an equivalent patient acquisition time by using the fact that after an 8-min acquisition, the average patient has 120 counts/pixel in the background. To compare the HR and GP collimator, we additionally took into account the difference in sensitivity
Table 2 Analysis of CNR data of patient data
Scantime (min) CNRmax≤2.5 CNRmax>2.5 CNRmax>3 CNRmax>4 CNRmax>5
2 3 49 46 38 33
2.66 0 52 46 38 33
4 0 52 44 38 34
8 0 52 49 39 35
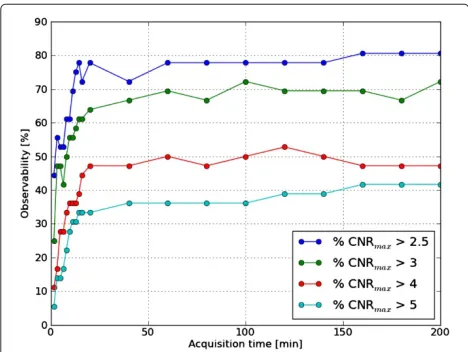
between the two collimators. In Figure 7, we show the observability of the GP collimator.
It can be seen from the figure that, independent of the threshold value, the observability increases until the acquisition time reaches 16 min and then levels off. The current protocol uses an acquisition time of 8 min, which lies right in the middle of the range where the observabil-ity increases in the phantom. This suggests that increasing the acquisition time of the protocol could result in a higher observability for patient acquisitions as well. As an additional practical application, we compared the observ-ability of the GP and HR collimators.
As shown in Figure 8, the observability of the HR and GP collimators is similar for each threshold value. To the extent that CNR can be used as a measure of image quality, this means that images acquired with the HR collimator have the same image quality as those acquired with the GP collimator at the same acquisition time.
Discussion
In this study, we presented a CNR analysis of the BSGI acquisition protocol at our hospital. We performed the CNR analysis both on patient data and on data acquired with a contrast-detail phantom. Using a dynamic acqui-sition protocol, it was possible to create time-reduced images for any acquisition time shorter than the acquisi-tion time of our current protocol. The results from the patient data analysis showed that the acquisition time could have been reduced by a factor 3 without reducing the number of observable hotspots on the separate views. Additional visual observation of the identified hotspots at the reduced acquisition times confirmed our finding. In contrast, the phantom study showed that increasing
Figure 7Observability of the phantom.The observability (see text for definition) of the phantom for a GP collimator versus acquisition time in minutes. The different lines correspond to different threshold values.
Figure 8Comparision of the GP and HR collimator.Comparison of the observability of the phantom for the GP collimator (solid line) and the HR collimator (dashed line). The different colors correspond to different threshold values.
the dose or acquisition time resulted in an increased detectability of small lesions with low contrast. We believe that the explanation for the discrepancy between our find-ings in the patient and phantom data is the small number of patients included. If we include more patients we will eventually find tumours that can only be detected with confidence by an observer after the full acquisition time. The fact that we see many patients with relatively large tumours with a high CNR is related to the referral pro-cedure for BSGI exams at our hospital. In most cases, patients who are referred for a BSGI examination at our hospital already underwent mammography, ultrasound and MRI exams, and there is often a strong suspicion for malignant disease; however, additional information about the size or focality of the disease are required. Further-more, based on our phantom data, we cannot exclude the possibility that smaller lesions with low contrast were in fact present in the patients that we used for our data analysis and would have been detected using a longer acquisition time or higher dose but remained undetected with our current protocol.
Dickerscheidet al. EJNMMI Research2013,3:21 Page 8 of 9 http://www.ejnmmires.com/content/3/1/21
depends on many factors such as the depth, size and uptake of the physical lesion. A physically small lesion deep inside the breast can result in the same observed hotspot as a more superficial and larger lesion with a lower uptake of radioactive tracer.
Due to the partial volume effect, the observed sizes of the smallest lesions are significantly larger than the true sizes of the lesions. The smallest observed size of hotspots from both the analysis of our patient data and from the phantom study was around 10 mm. For the phantom, we know that the true diameter sizes of the hotspots varied from 1 to 10 mm. For the patient data, we could not cor-relate the physical size of the lesions with the observed hotspot sizes because we did not have the final pathology reports available. It should be noted that in the litera-ture, tumours as small as 1 mm have been reported to be detected with BSGI [3]. The smallest hole that we were able to observe in this phantom study was 2 mm.
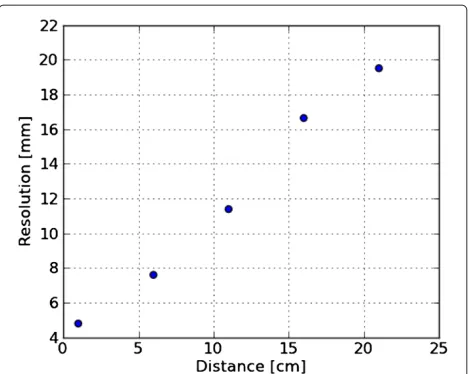
As mentioned, the contrast-detail phantom we used does not simulate lesions at different depths in the breast, and although this would give additional and possibly valu-able information, we believe this is less important for this study, where we were able to show that hotspots with lower contrasts become visible if we image longer. We have also demonstrated that some holes will remain undetectable by an observer, even after extremely long acquisition times. It would therefore be interesting to repeat the phantom measurements and analysis on differ-ent BSGI systems. To get an idea of the depth dependence of the system resolution, we measured for our camera (see Figure 9) how the system resolution changes as the dis-tance to the detector increases. For the clinically relevant range of compressed breast sizes, the resolution decreases from 4.8 mm full width at half maximum (FWHM) at the detector to 7.6 mm at a distance of 6.5 cm. When we com-pared the resolution of our BSGI system with the standard gamma cameras at our institute, we found that the resolu-tion of the BSGI system deteriorates faster with increasing distance, but for clinically relevant distances of up to 8 cm, these differences remained relatively small. Besides the loss in resolution, deeper lesions will have a decreased CNR due to scatter and attenuation.
Although the phantom is not an anatomical (3D) model of a breast, it is a good simulator for (planar) scinti-mammography images. The phantom we used is easy to manufacture and easy to operate. Analysing the phan-tom data required some reformatting of the data. From the phantom study, we see that the optimal acquisition time is around 16 min. In practice, long acquisition times are undesirable. Arguably, acquisitions lasting 8 to 10 min per view are reasonable. Longer acquisition times will also likely introduce additional artefacts due to patient movement. As a result, too long acquisition times are clearly impractical, and somehow an upper limit to the
Figure 9Resolution versus distance.The FWHM resolution as a function of the distance to the detector.
acquisition time per view will have to be introduced. This means that a higher sensitivity cannot be achieved by longer acquisition times, and the only practical solution to increase the chances of detecting more lesions for our system is to increase the patient dose. Alternatively, a dual-headed system has a greater sensitivity and should lead to improved detectabillity as well. The CNR analysis can be used on the patient data as well as on the phan-tom data with the benefits of reproducibility, consistency and objectivity. As mentioned above, the Rose criterion makes a connection between the CNR value of a lesion and the probability of observing the lesion. The Rose cri-terion, however, does not refer to a single threshold value but to a range of values that separates lesions that can be observed with near certainty from lesions that are almost certainly unobservable. In this study, we showed that for each threshold value in the range of 2.5 to 5, the observ-ability of the phantom levels off at the same acquisition time.
single- and dual-headed cameras, it would be interest-ing to compare the two modalities directly usinterest-ing the CD phantom and the CNR analysis presented here.
Conclusion
In summary, we found that although a dose reduction by a factor 3 in an initial study of 13 patients would not have lead to a reduced number of observable hotspots in each of the separate views acquired, our phantom study showed that a further dose reduction of BSGI scans of 8 min/view with 740 MBq might result in a reduced sensitivity for lesion detection, whereas increasing the acquisition time and/or activity might result in a higher sensitivity for lesion detection. At our hospital, BSGI is used for a patient group that has a high incidence of malignant disease, and the main clinical question is to characterize the extent and focality of the disease because this has important consequences for the course of treatment. An increase of the administered activity might therefore be justified, although a detailed radiation risk analysis should be per-formed to determine how much the activity might be increased to achieve an optimal detection possibility of small lesions in our patient group.
Competing interests
The authors declare that they have no competing interests.
Authors’ contributions
DD, JH and LR designed the study. JL supervised the clinical part of the paper. All authors edited the manuscript. All authors read and approved the final manuscript.
Acknowledgements
We would like to thank R. Schoffelen and M. Blommenstein for their help in developing the phantom and G. J. Colenbrander and the technologists at the Rijnstate hospital Leiderdorp for their assistance during the measurements with the HR collimator.
Received: 30 November 2012 Accepted: 24 February 2013 Published: 25 March 2013
References
1. Bluemke D, Gatsonis C, Chen M, DeAngelis G, DeBruhl N, Harms S, Heywang-K ¨obrunner SH, Hylton N, Kuhl CK, Lehman C, Pisano ED, Causer P, Schnitt SJ, Smazal SF, Stelling CB, Weatherall PT, Schnall MD:
Magnetic resonance imaging of the breast prior to biopsy.JAMA 2004,292(22):2735–2742. +[http://dx.doi.org/10.1001/jama.292.22.2735] 2. Jones EA, Phan TD, Blanchard DA, Miley A:Breast-specificγ-imaging:
molecular imaging of the breast using99mTc-sestamibi and a small-field-of-viewγ-camera.J Nucl Med Technol2009,37:201–205. 3. Brem RF, Rapelyea JA, Zisman G, Montashemi K, Raub J, Teal CB,
Majewski S, Welch BL:Occult breast cancer: scintimammography with high-resolution breast-specific gamma camera in women at high risk for breast cancer.Radiology2005,237:274–280.
4. Schillaci O, Buscombe JR:Breast scintigraphy today: indications and limitations.Eur J Nucl Med Mol Imaging2004,31:S35–S45.
5. Hendrick RE:Radiation doses and cancer risks from breast imaging studies.Radiology2010,257:246–253.
6. Hruska CB, Weinmann AL, O’Connor MK:Proof of concept for low-dose molecular breast imaging with a dual-head CZT gamma camera. Part I. Evaluation in phantoms.Med Phys2012,39:3466.
7. Hruska CB, Weinmann AL, Skjerseth CMT, Wagenaar EM, Conners AL, Tortorelli CL, Maxwell RW, Rhodes DJ, O’Connor MK:Proof of concept for
low-dose molecular breast imaging with a dual-head CZT gamma camera. Part II. Evaluation in patients.Med Phys2012,39:3476. 8. Goldsmith SJ, Parsons W, Guiberteau MJ, Stern LH, Lanzkowsky L,
Weigert J, Heston TF, Jones E, Buscombe J, Stabin MG:SNM practice guideline for breast scintigraphy with breast-specific g-cameras 1.0. J Nucl Med Technol2010,38:219–224.
9. EANM:Breast scintigraphy with breast specific gamma cameras 1.0.
2010. [http://www.eanm.org/publications/guidelines/]
10. Mor´e MJ, Goodale PJ, Majewski S, Williams MB:Evaluation of gamma cameras for use in dedicated breast imaging.IEEE Trans Nucl Sci2006,
53:2675–2679.
11. Cherry SR, Phelps ME, Sorenson JA:Physics in Nuclear Medicine. Philadelphia: Saunders; 2003.
doi:10.1186/2191-219X-3-21
Cite this article as:Dickerscheidet al.:Contrast-noise-ratio (CNR) analy-sis and optimisation of breast-specific gamma imaging (BSGI) acquisition
protocols.EJNMMI Research20133:21.
Submit your manuscript to a
journal and benefi t from:
7 Convenient online submission
7 Rigorous peer review
7 Immediate publication on acceptance
7 Open access: articles freely available online
7 High visibility within the fi eld
7 Retaining the copyright to your article