357
Int. J. Data Envelopment Analysis (ISSN 2345-458X)
Vol.2, No.2, Year 2014 Article ID IJDEA-00221, 11 pages
Research Article
Efficient Selection of Design Parameters in
Multi-Objective Economic-Statistical Model of Attribute C
Control Chart
S. Jafarian-Namin
a, A. Amiri
b*, E. Najafi
c(a) Department of Industrial Engineering, South Tehran Branch, Islamic Azad University,
Tehran, Iran
(b) Industrial Engineering Department, Shahed University, Tehran, Iran
(c) Industrial Engineering Department, Islamic Azad University, Science and Research Branch,
Tehran, Iran.
Received 23 February 2014, Revised 10 June 2014, Accepted 29 June 2014
Abstract
Control chart is the most well-known chart to monitor the number of nonconformities per inspection
unit where each sample consists of constant size. Generally, the design of a control chart requires
determination of sample size, sampling interval, and control limits width. Optimally selecting these
parameters depends on several process parameters, which have been considered from statistical and/or
economic aspects in the literature. This study presents a multi-objective economic-statistical design
(MOESD) of the C control chart. An algorithm using data envelopment analysis (DEA) is employed to
solve this model. A numerical example is used to illustrate the algorithm procedure.
Keywords: C Control Chart, Multi-Objective Economic-Statistical Design, DEA.
*Corresponding author: [email protected]
1. Introduction
Statistical Process Control (SPC) is an industry-standard methodology for measuring, controlling and
improving the quality and productivity of manufacturing and service enterprises. Control chart is one
of the seven basic tools of SPC. A control chart is a graphical exhibition of plotted quality data obtained
from a process in time order that can be used to maintain the process in the in-control status and improve
it through reduction in the variability of the process through analyzing the process changes over time.
Broadly, there are two classes of control charts: the variable and the attribute. Attribute control charts
are used to monitor discrete and/or categorical data (for a comprehensive review see [1]). Among them,
the classic Shewhart’s C control chart is applied to monitor the number of nonconformities per
inspection unit, distributed according to a Poisson distribution [2]. Despite the wider application in real
practice for the relative simplicity in dealing with attributes than variables, the C control charts have
been largely neglected unfortunately. Thus, in this study, the design of attribute C control charts is
considered through corresponding parameters.
Generally, the design of a control chart requires the specification of three parameters, namely, sample
size (n), sampling interval (h), and control limits width (k). Many researchers have considered optimally
selecting these parameters. Traditionally, control charts are designed without taking into account
economic aspects that experience substandard performances. Since the quality of a product and the cost
of process control are affected by design parameters, it is of great importance to search for the best
possible parameters. This in turn motivates many researchers to consider optimally selecting of the
design parameters.
The first economic model to monitor the mean of a normal process under a single assignable cause was
developed by Duncan [3]. This pure economic design was criticized for poor statistical properties. Thus,
Saniga [4] introduced an economic-statistical model in which minimized the Duncan’s cost model
subject to statistical constraints. Since the importance of statistical properties is of the same as economic
aspects, this approach seems ineffective and simultaneous optimization of both properties is required.
As a multiple criteria decision-making, Chen and Liao [5] applied an approach to design X control chart
in which the efficient solutions were selected using DEA. Recently, this approach has been considered
for the design of the np control chart [6].
DEA is a powerful optimization approach to evaluate the relative efficiency of decision making units
(DMUs) with multiple inputs and outputs. Charnes et al. [7] developed DEA via generalization of the
Farrell’s single input, single output efficiency measurement. In recent years, a large number of
applications of DEA have been done by defining DMUs in various forms as needed. Two main reasons
that make DEA more attractive are 1) the general and supple definition of a DMU, and 2) fairly few
the CCR model. In this mathematical programming model, the performance of a specific DMU is
assessed with respect to the performance of the remaining DMUs.
By defining proper DMUs, in this paper, we present multi-objective economic-statistical design of the
C control chart. The rest of the paper is organized as follows: In section 2, the C control chart is
introduced. The multi-objective model is proposed in Section 3. In the next section, a brief description
of the data envelopment analysis approach is given. In section 5, an algorithm using the DEA, proposed
by Chen and Liao [5], is employed with some modifications to solve the proposed model. Section 6
includes a numerical example to illustrate the solution procedure and to perform some Comparisons.
Finally, conclusions complete the paper.
2. The C Control Chart
It is often important to construct control charts for the number of defects, where each inspected unit
of the same size may have several countable nonconformities. In such cases, the classic Shewhart
C-chart is applied to monitor the number of nonconformities per inspection unit, distributed according to
a Poisson distribution as follows:
0,1,...!
x
x c e x P
x c
, (1)
where c0 is the Poisson distribution parameter which represents its mean and variance in a
preliminary inspection unit of constant size.
Commonly, a control chart has a central line (CL) to define the central tendency, and an upper control
limit (UCL) and lower control limit (LCL) to exhibit the scope of expected variation of the plotted data.
Hence, if the known value of c (obtained using historical information) is considered as the central line,
the k-sigma upper and lower control limits are statistically computed for a C control chart as given in
the following equations [2]:
UCL
c k c
,
(2)LCL
c k c
.
(3)In this way, the production process is permanently sampled in specific time intervals, inspected and the
results are interpreted to see whether the outcomes are from one consistent and homogeneous process
or not. Under the attitude of quality improvement, the assignable cause or causes of variation in the
process must be discovered and eliminated so as to reach a stable and predictable process (i.e., ‘in-control’ state). In this study, a single assignable cause is assumed to occur.
If designing of a C control chart based on n inspection units (not necessarily integer) is of interest, new
inspection unit is obtained with n multiplied by primary inspection unit. Therefore, the control limits
subgroups):
UCL
nc
k nc
,
(4)LCL
nc
k nc
.
(5)In some cases, when the calculations yield zero or a negative value for LCL, researchers often set it to
zero. However, this violates the definition of a lower control limit and Use of run rules. Because of the
importance of points plotting below the LCL, indicating a possible reduction in the number of defects,
we define a constraint to consider situations in which it is positive.
3. The Proposed Model
The proposed C-MOESD model is based on Duncan’s economic model [3] by some adjustments to
adapt with the C control chart and consider economic and statistical properties simultaneously. To
simplify the mathematical manipulation and analysis, the following assumptions are considered to be
hold:
1. The quality characteristic follows a Poisson distribution,
2. The process is either in-control or out-of-control state only and is initially in the ‘in-control’ state;
that is, cc0,
3. When a random assignable cause of magnitude δ occurs, leads the process mean to shift from c0
to c1c0 c0 ,
4. The occurrence of an assignable cause possesses an exponential distribution with mean time 1/λ,
5. The process is allowed to continue during the search and repair.
A. Economic Cost Function
Duncan’s [3] definition of the expected hourly cost is based on a single quality control cycle of
monitoring the production process.
This cycle length consists of four components: 1) the period in which the process is in-control, 2) the
time to signal during the out-of-control period, 3) the time to sample, inspect and interpret, and 4) the
time to discover and repair the assignable cause.
Accordingly, an expected cycle length and an expected cost of the cycle can be formulated in economic
model construction. As a ratio between the expected cost during a cycle and the expected cycle time
length, the expected hourly cost in [3] is adapted to the C control chart:
B MB TA W
h vn f EL
1
) (
, (6)
f is the fixed cost of sampling an inspection unit, v is the variable cost of sampling an inspection unit, W is the average cost to detect an assignable cause, T is the cost of verifying a false alarm,
M is the hourly loss due to poor quality of units, A is the average number of false alarms per cycle:
) 1 /(
h
e
A , (7)
is probability of false alarm ([UCL] and <LCL> denote the integer round down and round up
functions of control limits):
! ) ( 1 ] [ 0 0
UCL LCL x c x x e c , (8)
B is the average time of the process being in out-of-control state:
D gn P
h
B / , (9)
P is detection power:
! ) ( 1 ] [ 1 1
UCL LCL x c x x e cP , (10)
is average time of occurrence of an assignable cause between samples:
1 (1 h)e h
/( e h) , (11)
g is time to sample and interpret the results, D is time required to find the assignable cause.
B. Multi-Objective Design of the C Control Chart
The goal of multi-objective decision making is to find a solution giving the best compromise between
multiple objectives. In addition to statistical perspective, designing a control chart has several economic
consequences as presented before. Thus, taking into account both properties, the C-MOESD model is
0 . . ) ( ) ( ) ( 1 1 0 0 1 0 LCL ATS ATS ATS ATS E E t s S ATS Min S ATS Max S E Min U L U L L L
, (12)
where, EL is the expected hourly cost, S=(n, h, k) is a possible set of design parameters, ATS0=h/α is the
average time to signal when a false alarm occurs, and ATS1=h/P is the average time to signal when an
assignable cause occurs. In addition, ELU, ATS0L and ATS1U are the desired bounds determined by DM,
and LCL is the lower control limit.
The design of a control chart requires the specification of three decision variables, i.e. n, h and k. One
of the most powerful methods to solve (12) is DEA method. Although DEA is applied for various
control charts, it has not been used for design of C control chart yet. In this study, DEA method is used
to search the optimal solution(s) in the model.
4. Data Envelopment Analysis
DEA is a powerful non-parametric approach to evaluate the relative efficiency of a group of decision
making units (DMUs) with multiple inputs and outputs. The first DEA approach is known as the CCR
model via generalization of the Farrell’s single input, single output efficiency measurement [7]. This
linear programming formulation can be either input-oriented or output-oriented. Assuming n DMUs,
each with m inputs and s outputs, the efficiency of a specific DMU can be obtained by solving the
input-oriented CCR model:
m i v s r u n j D X v D Y u X v t s Y u D E Max i r m i ij i s r rj r m i i i s r r r ,..., 1 , 0 ,..., 1 , 0 ,..., 1 , 0 ) ( ) ( 1 . . ) ( 1 1 1 0 1 0 0
, (13)where ur is the weight of output r, vi is the weight of input i, Yrj is the value of output r for jth DMU,
and Xij is the value of input i for jth DMU. The performance of each DMU measured is relative to the
remaining DMUs. A DMU is relatively inefficient if E0*<1 and relatively efficient, strictly or weakly,
if E0*=1. In designing control charts, DMUs refer to feasible combinations of design parameters.
their minimizing nature, and ATS0 is probed as output. The model should be formulated for each DMU
to find the set of weights, as decision variables, that maximize the relative efficiency of considered
DMU. As a result, at least one of the DMUs will be efficient.
5. Solution Procedure
We intend to achieve a well-balanced trade-off between the economic and the statistical features.
For this reason, Chen and Liao’s [5] algorithm is employed by some adjustments for optimizing our
proposed model. In fact, the modifications are as follows: 1) optimizing the model for the C control
chart, 2) changing some of the objective functions and constraints by introducing h into them, 3) setting
upper bound for expected hourly cost, 4) considering situations not to violate the definition of a LCL
based on the nature of Poisson distribution. The solution algorithm for optimizing the proposed model
is explained as follows:
Step 0. Determining the possible combinations of design parameters. Set various combinations of
design parameters by putting bounds on them according to DM’s needs. Due to the discrete optimization
nature of the DEA method used in this algorithm, and to avoid additional computations related to
dominated solutions, the analyzer can limit the solution space in advance. Then, the values of objective
functions must be computed for each DMU.
Step 1. Determination of feasible combinations. By using the constraints in (12), gather the feasible
combinations with the same sample size n into a set Qn.
Step 2. Partial solution selection. Determine the non-dominated solution points for each set of Qn.
Step 3. Global Pareto solution selection. Merge all determined solutions from step 2 into a set W and
then select efficient design(s) among the scores calculated for all designs by CCR model (Although
there are some DEA softwares, in this study, all calculations have been facilitated under a program
coded in the MATLAB (version R2013b) environment).
6. A Numerical Example
In order to illustrate the results of the C-MOESD model, the number of nonconformities in a unit of
size n is supposed to follow a Poisson distribution with mean c0=4. Moreover, when an assignable cause
with the rate of λ=0.01 occurs, it provides a shift of size δ=2 in the process mean (and so c1=8). The
Table 1
Input values of parameters
Cost factors Time factors
M T W f V g D
20 25 12.5 1 0.1 0.05 2
Firstly, the solution space is limited according to the bounds on design parameters: 1≤n≤30 increases by 0.5, 0.1≤h≤4 increases by 0.1, and 0.5≤k≤4 increases by 0.5. Therefore, the number of possible
combinations will be 59×40×8=18880. For all of the possible combinations, the values of objective
functions are computed. Then, the feasible combinations are specified by applying the following
constraints: EL7, ATS0 100, ATS14, and LCL>0. Next, the NDS points for each set of Qn are
selected. Finally, the relative efficiency score of each NDS is calculated.
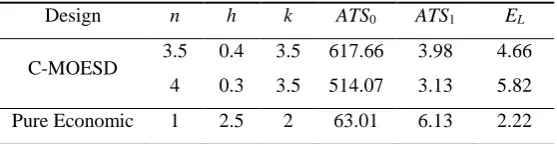
As shown in Table 2, two combinations of design parameters have received efficiency score 1 and thus
are offered to the DM for final selection. In consequence, Table 3 shows the determined efficient units
in addition to comparison with the pure economic design in which only the expected hourly cost in (12)
is minimized (see Duncan’s [3] model). Selected two efficient units by the proposed model have
improved ATS0 about 880.3% and 715.9%, and ATS1 about 35.1% and 48.9%, respectively. However,
EL is increased about 109.9% and 162.2%, respectively. Despite the increase in cost, statistical
performance is improved substantially using C-MOESD model. Moreover, in our designs, all the
objectives are in the desired limits, while, the statistical objectives of pure economic design are not
satisfactory.
In terms of efficiency values, our designs show significant difference against the pure economic design.
This can totally confirm the improved performance of the Multi-Objective Economic-Statistical design
and reveal the insufficiency of the pure economic design in such space.
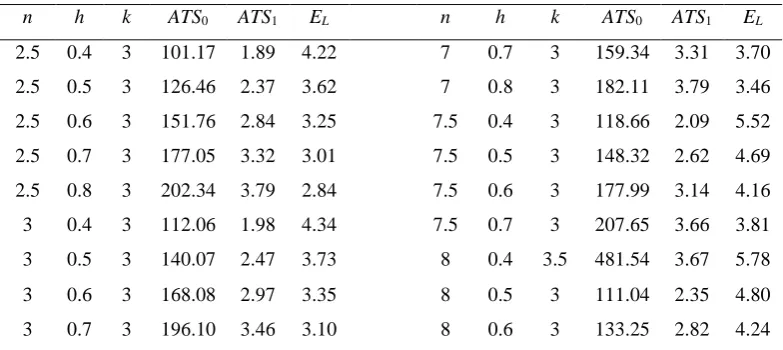
Table 2.
Non-dominated solution points in the set W
n h k ATS0 ATS1 EL n h k ATS0 ATS1 EL
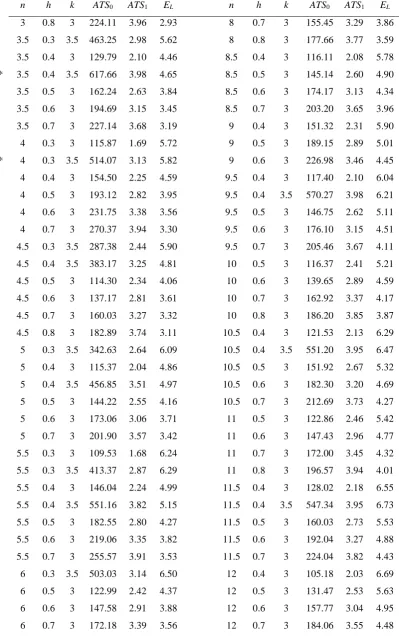
Table 2. (continued)
n h k ATS0 ATS1 EL n h k ATS0 ATS1 EL
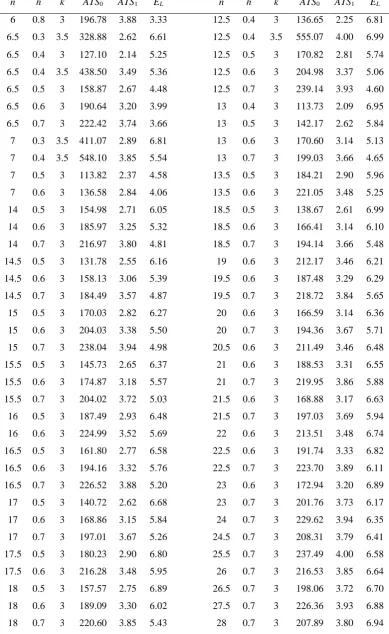
Table 1. (continued)
n h k ATS0 ATS1 EL n h k ATS0 ATS1 EL
Table 3.
Efficient design parameters for C-MOESD model in comparison with pure economic model
Design n h k ATS0 ATS1 EL
C-MOESD 3.5 0.4 3.5 617.66 3.98 4.66 4 0.3 3.5 514.07 3.13 5.82 Pure Economic 1 2.5 2 63.01 6.13 2.22
7. Conclusion and Future Researches
In this study, we proposed a multi-objective economic-statistical model for the C control chart. The
DEA approach was applied to specify efficient design parameters. Through a numerical example, the
algorithm procedure was investigated in addition to comparison with pure economic design. According
to the results, Multi-Objective Economic-Statistical design showed statistically improved performance
compared to the pure economic design for the C control chart.
Using the other multi-objective decision making methods, and using the proposed model in occurrence
of multiple assignable causes can be considered as future researches. In addition, models including
assignable causes with random shifts and for variable sample sizes in addressing various control charts
worth to be investigated.
References
[1] Woodall, W. H. (1997). Control charts based on attribute data: bibliography and review. Journal of
Quality Technology, 29(2), 172-183.
[2] Montgomery, D. C. (2008). Introduction to Statistical Quality Control (6th ed). New York: Wiley.
[3] Duncan, A. J. (1956). The economic design of x charts used to maintain current control of a process.
Journal of the American Statistical Association, 51(247), 228-242.
[4] Saniga, E. M. (1989). Economic statistical control chart designs with an application toXand R
charts. Technometrics, 31(3), 313-320.
[5] Chen, Y. K., Liao, H. C. (2004). Multi-criteria design of an x̄ control chart. Computers & Industrial
Engineering, 46(4), 877-891.
[6] Bashiri, M., Amiri, A., Asgari, A., Doroudyan, M. H. (2013). Multi-objective efficient design of np
control chart using data envelopment analysis. International Journal of Engineering, 26(6), 621-630.
[7] Charnes, A., Cooper, W. W., Rhodes, E. (1978). Measuring the efficiency of decision making units.