Iranian Journal of Economic Studies, 7(2) 2018, 239-254
Iranian Journal of Economic Studies
Journal homepage: ijes.shirazu.ac.ir
The Place of Health Insurance in Reducing Catastrophic Health Expenditure
Sattar Mehrabana, Narges Hajimoladarvishb, Hossein Raghfarb
a. Independent Researcher, Iran.
b. Faculty of Social Science, Economics, Alzahra University, Tehran, Iran.
Article History Abstract
Received date: 03 October 2018 Revised date: 26 December 2018 Accepted date: 2 February 2019 Available online: 13 February 2019
This paper was aimed to investigate the mixed empirical results on the effect of health insurance in reducing the risk of catastrophic health expenditure (CHE). We investigated a wide range of factors affecting the risk of CHE among patients admitted to hospitals in Tehran. We categorized hospitals into five groups from private hospitals to charity ones. The data used herein was extracted from the second round of Urban Health Equity Assessment and Response Tool. Determinants of CHE were identified using logistic regression. We found that the significant effect of insurance on aggregate data was solely determined by its effect on reducing the risk of CHE in social security organization hospitals. Insured people by this organization allocate a higher proportion of their salaries to the health insurance and are admitted to the organizational hospitals free of charge. This finding shows the bias inherited in the aggregation and provides support for full pre-payments mechanisms. Our findings suggest that CHE is related to the chosen hospitals by individuals, which, in turn, needs to be based on individuals’ health insurance and socio-economic conditions.
JEL Classification: I11
G22 N25
Keywords: CHE
Health Insurance Type of Hospitals
1. Introduction
Catastrophic health expenditure (CHE) occurs when out-of-pocket spending for healthcare exceeds a certain proportion of a household's income (Li et al., 2012). High level of CHE is associated with the lack of financial protection against health costs (Roberts et al., 2003). Theoretically, health insurance is designed to protect households facing uncertainty over health costs. Thus, we expect to see a significant relationship between exposure to CHE and health insurances.
Empirical evidence on the effect of health insurance on reducing the risk of CHE is rather mixed. While some findings are consistent with the theory implication (Basar et al., 2012; Mehrara & Fazaeli, 2010), some studies have not found any significant effect prompted by insurance (Ekman 2007; Fazaeli et al., 2015; and Sinha et al., 2016).
nargesdarwish@gmail.com
More importantly, studies which have focused on the determinants of CHE among patients admitted to hospitals in Iran have found the supplementary insurance as a protective factor and reported no significant effect for basic insurance (Ghiasvand et al., 2010; Hatam et al., 2015). We sought to investigate the reason for this empirical result. Since the aforementioned studies were focused on the rate of CHE in hospitalized patients, we also had to investigate the effect exerted by the type of hospitals. Differences across hospitals (i.e. operational costs) can contribute to the incidence of CHE. Furthermore, to the best of our knowledge, all previous studies done in Iran were based on rather limited sample sizes and we are not aware of a study that examined CHE in Tehran across different types of hospitals. Thus, we aimed to provide evidence that would improve our understanding of the impact of health insurance on reducing CHE among hospitalized patients.
Hospitals are categorized to private hospitals, social security organization hospitals (SSO), hospitals affiliated to the Iranian Ministry of Health and Medical Education (MH), hospitals affiliated to government agencies (GA), and charity hospitals (CH). Among these hospitals, private hospitals have the highest tariffs. For example, according to the calculation of Akbarisari et al. (2012), the cost of surgeries in private hospitals was approximately 6.48 times higher than that in the public hospitals.
We used logit regressions to identify factors affecting the risk of CHE. Considered factors included family member's health situation, demographics, and socio-economic indicators. We investigated these factors in each hospital group and re-examined the robustness of our findings. The significance of health insurance and increased frequency of hospitalization varied among different hospitals. More specifically, the insurance effect was only significant in the SSO hospitals.
Patients admitted to the SSO hospitals included 38% of our sample. Hence, the significant effect of insurance shows an aggregation bias. Thus, when examining health (policy) outcomes among patients admitted to hospitals, taking account of the heterogeneity across hospitals is an important factor.
The rate of exposure to CHE was 20.3% in our sample of 7884 households. Across different hospitals, the rate of CHE among patients admitted to private hospitals was the highest (24.4%). This is rather worrisome as we are witnessing a rising trend of privatization in the health sector.
The rest of this paper is organized as follows. Section 2 summarizes the main features of the health system in Iran. Section 3 describes the data source and the method used to calculate CHE and its determinants. Section 4 reports the results and presents our conclusions.
2. Health System in Iran
2.1 Health Insurance Providers
There are generally two types of health insurances in Iran; basic and supplementary insurances. Mehrdad (2009) categorizes the basic health insurance providers as Social Security Organization (SSO), Medical Service Insurance Organization (MSIO), Military Personnel Insurance Organization (MPIO), and Imam Khomeini Relief Committee that provides health insurance for the uninsured poor. The SSO is the largest health insurer in Iran and includes all people employed in the formal sector except government’s officials. The MSIO mainly provides health insurance for government employees and the MOIO provides health insurance for military personnel. From May 2014, the Iranian government implemented a universal health insurance targeting uninsured people (around 6-10 million people). Universal health insurance is provided by the MSIO. However, since our data is collected in November 2011, we do not have this type of health insurance.
The second type of health insurance is the supplementary insurance for which people are required to have one of the aforementioned basic health insurances. The supplementary insurances are provided by semi-public or private insurance companies. These policies mainly cover co-payments for inpatient services and surgeries. According to Mehrdad (2009), almost 5% of the middle-class population bought supplementary insurances. However, many companies provide supplementary health insurances and this is becoming more popular. For example, from 2013, retirees and employees of the SSO have been automatically registered for the supplementary insurance. Future data will show the effect of this opt-out mechanism on the incidence of catastrophic health expenditure.
2.2 Differences across Hospitals
In 2011, there were 141 hospitals in Tehran. Among these, 43 hospitals belonged to universities that are considered as public hospitals and we refer to them as MH hospitals since they belong to the Ministry of Health and Medical Education. The majority of hospitals are private hospitals, amounting to 54. Therefore, private hospitals had the highest accessibility in our sample. The remaining 44 hospitals were categorized as others, which included the SSO, the GA, and the CH hospitals. While hospitals affiliated to the Ministry of Health and Medical Education are the main provider of medical services across Iran, the private sector is the main provider in Tehran.
There are considerable fee differences across hospitals, which, in turn, depend on tariffs determined by the government. These tariffs are categorized to public and private ones. The later includes non-governmental public tariffs as well. Among the five hospital groups considered in this study, private hospitals applied private tariffs, the MH and the GA hospitals applied public tariffs, and the SSO and the CH hospitals applied a mix of public and private tariffs. Table 1 reports public and private tariffs. It must be noted that the university (public) hospitals are mostly educational hospitals in Tehran. Student’s involvements in these hospitals may lead to longer treatment procedures and higher out-of-pocket payments.
While these tariffs are the same across all public and private hospitals, hoteling tariffs depend on the used wards of hospitals and their ratings. In general, hoteling tariffs in private hospitals are 2.6 to 5 times higher than the public ones. Among public hospitals, hoteling tariff in best quality hospitals is about 2 to 3 times higher than that of the worst quality hospitals.
The public tariffs are calculated based on a bed in a 6-bed room. If a patient is admitted to a room with four beds, she should pay the price difference. Moreover, prescribed foreign medicines that have domestic substitutes are not covered by basic insurances. Thus, in some cases, patients are induced to go to less crowded rooms and use medicines that are not covered by their policy. In general, basic health insurances cover 90% (70%) of the public tariffs for inpatient (outpatient) services irrespective of the type of hospitals. However, most SSO policyholders are admitted to SSO hospitals free of charge.
Table 1. Tariffs across hospitals
Type of tariffs in Rials Public Private Ratio
Internal 6750 32000 4.74
Anesthesia 34500 160000 4.64
Surgery 60000 360000 6.00
Dental care 1950 4800 2.46
Physiotherapy 2300 4200 1.83
Physician visit costs
General practitioners and dentists 37000 80000 2.16
Specialized physicians and dentists 44500 130000 2.92
Subspecialist physicians and general psychiatrists 54500 160000 2.94
Subspecialist psychiatrists 65000 180000 2.77
Source: Therapeutic deputy of Ministry of Health and Medical Education (2011).
2.3 The SSO
workers. From the 30% the government pays contribution, employees 20%, 7% pay employers pay, and 3%. Employees’ contribution is automatically deducted from their salaries. Employers have to pay the share of employees and their own contributions on a monthly basis. There are economic sanctions and incentives that oblige employers to pay their contributions. Therefore, it is only the government contribution that is usually not received by the organization. The government debt to the SSO is 920000 billion Rials as of 12th of July 2017. The figure is almost 1.5x of the SSO's expenditure in the last year. In general, a third of contributions are allocated for health insurance. Accordingly and without considering the government share, the SSO receives 9% of insured people’s salaries for health insurance.
The SSO has compulsory, voluntary, and self-employed insurances. Compulsory insurance covers anyone who works in the formal sector and receives a salary. When people become unemployed, they can continue their insurance voluntarily through a contract that is in accordance with the regulations approved by the High Council of Social Security. In order to be eligible for voluntary insurance, applicants are required to be less than 55 years old and have a record of contribution payments for at least 30 days. Applications may be accepted for those who are more than 55 years old in the case of having a record of contribution payment, which compensates the excess years of 55. Moreover, applications with the record of at least 10 years of contribution payment may be accepted without any age limitation. From 12th April 2008, all self-employed people can have a contract for self-employed insurance. The self-employed contributions are calculated based on self-declaration. The self-insured people can enjoy the benefits of the SSO commitments including retirement, death, disability, and health insurances.
The organization has 70 hospitals across Iran. SSO hospitals apply both kinds of public and private tariffs. Public tariffs are charged for the holders of the SSO insurance. More specifically, while the compulsory and voluntary insured people pay no cost at the SSO hospitals, the self-employed insured people pay 10% of tariffs for inpatient services. Holders of other types of insurances are charged based on private tariffs and have to pay at least 10% of higher tariffs.
The SSO is the biggest producer of pharmaceuticals in Iran. Since the organization owns domestic pharmaceutical companies, it promotes the use of domestic medicines. Due to this point, all physicians are advised to prescribe domestic products when possible. As all physicians and nurses are employed by the organization, it seems the SSO has been successful for implementing its policies.
2.4 The MSIO and others
government share of contribution varies from 34% to 100%, these health providers are highly dependent on government.
Iran economy is highly dependent on oil. Historically, whenever oil revenues decline, governments cut health and education budgets. In 2011, despite high oil prices, the government could not finance the subsidies of the health sector. This was because of nuclear sanctions, which substantially decreased Iran's oil exports. When the government does not pay its contribution, hospitals cannot fulfill their contracts with pharmaceutical and health equipment companies. When hospitals run out of equipment and pharmaceuticals, they reduce the insurance coverage to make the ends meet. This cycle leads to more out-of-pocket payments as hospitals outsource many services. For example, Mahboobi-Ardakan et al. (2016) showed that while 10% increase in government expenditure in the health sector was associated with 7.6% increase in the use of health services in the short-run, 10% increase in households' expenditure was associated with 1.6% increase in the use of health services. Moreover, the contribution of private sector was about 65% of national health accounts in 2011 and 86.15% of the private sector contribution was paid by households. According to the constitution and development plans, private sector share should not exceed 30%.
3. Data and Method
The data used herein was extracted from the second round of Urban Health Equity Assessment and Response Tool (Urban 2). The Urban HEART-2 project was conducted in November HEART-2011, within the main framework of WHO Centre for Health Development (Kobe Centre). Details of how the project was conducted can be found in Asadi-Lari et al. (2013). Socio-demographic characteristics, such as age, gender, education level, occupation, household size, home ownership, health insurance status, and economic status, were gathered using general information of household's expenditure sheets. Information about whether households had used hospitals, type of services (outpatient or inpatient), type of hospitals, and number of hospitalization of households' members were gathered from the hospital service sheets.
3.1 Household Assessments
A catastrophic payment is defined based on households' capacity to pay (CTP). Estimation of CTP requires data on total households expenditure and subsistence expenditure (SE). The SE is defined as households' food expenditure. CTP is defined as the total expenditure of the household minus the SE. Following
Out-of-pocket payments refer to health expenditure at the point of service. Such payments typically include physician consultation fees, medication purchases, and hospital bills. Thus, the burden of health expenditure is defined as the share of out-of-pocket payments from household's CTP. Following Xu et al.
(2003), a household is considered to be facing a CHE when the total out-of-pocket
health payments equate or exceed 40% of the household's CTP.
3.2 Regression Analysis
Determinants of CHE were identified using logistic regressions. In order to identify factors affecting the incidence of CHE, family member's health situation, demographics, and socio-economic factors were examined. Table 2 lists the variables used in this study in the form of reference and comparison groups.
Table 2. Description of variables
Variables Reference Group Comparison Groups Education level of
household’s Head Illiterate
Primary to senior high school (Diploma) – University or above
(University) Household expenditure
categorization Quintile 1 (Q1) Second to fifth quintiles( Q2-Q5) Household health insurance Without health insurance With basic health insurance, with supplementary health insurance
Job status of household’s
Head Unemployed
Retired (including people without a fixed job but some fixed income),
Employed Gender of household’s head Male Female Number of hospitalizations No hospitalization 1, 2, 3 and more
Household's size 1 2 and more
Households with an elderly 0 1
Households with a member of
chronic disease 0 1
Type of used hospitals Private hospitals SSO, MH, GA, CH
Home ownership Tenant Owner
Car ownership Without a car With a car
4. Results
4.1 Descriptive Results
Out of 33404 surveyed households in Tehran, 8538 households had referred to hospitals. Among these, 5806 households had received inpatient services in the five hospitals considered herein. The share of different hospital groups was as follows: Private hospitals: 30%, SSO hospitals: 35%, MH hospitals: 19%, GA hospitals: 15%, and CH hospitals: 1%.
quintile to the fifth cost quintile, the percentage of people admitted to private hospitals increased from 18% to 41%.
From the total number of people admitted to CH hospitals, 36% were uninsured, which is the highest share of uninsured people admitted to hospitals. On the other hand, 86% of those hospitalized in SSO hospitals had health insurance. Among patients admitted to GA, MH, and private hospitals, 19%, 27%, and 23% lacked health insurances, respectively.
Figure 1. Percentage of people with different socio-economic conditions in different hospitals
Considering the link between the education level of households' head and the type of chosen hospitals, the results indicated that illiterate people had mostly chosen CH hospitals. Households headed by an educated person had mostly preferred private hospitals and GA hospitals. People with primary to senior high school education had mostly chosen SSO and MH hospitals. It is rather strange that 18% of households from the first cost quintile had chosen private hospitals as compared to other hospitals with lower tariffs.
Among 5806 households considered herein, 1170 households (20%) had faced CHE. The incidence of CHE among patients admitted to private hospitals, SSO, MH, GA, and CH hospitals were 24%, 17%, 21%, 18%, and 22%, respectively. These findings are consistent with Ghiasvand et al.’s (2014) findings indicating that about 15% of patients admitted to five MH hospitals were exposed to CHE. Moreover, the distribution of CHE across the first to fifth cost quintiles were 30%, 18%, 15%, 17%, and 22%, respectively.
Figure 2. Distribution of exposure to CHE by the type of hospitals and cost quintiles
4.2 Regression results
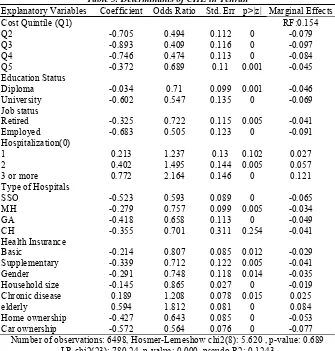
Table 2 reports the results of the logistic regression. As evident from Table 2, there are wide ranges of factors linked with CHE. The economic situation of households captured by their adjusted cost quintiles, home and car ownership affected the incidence of CHE in almost all of our analysis. Poor households have higher chances of exposure to CHE. The predicted probability of experiencing CHE increased by 8.4 percent when households had at least one elderly member, the presence of whom held other covariates at the reference points. As compared to households without any members suffering from a chronic disease, those who have a member with a chronic disease are 1.208 times more likely to experience CHE. However, having a large family seemed to be a protective factor.
Table 3. Determinants of CHE in Tehran
Explanatory Variables Coefficient Odds Ratio Std. Err p>|z| Marginal Effects
Cost Quintile (Q1) RF:0.154
Q2 -0.705 0.494 0.112 0 -0.079
Q3 -0.893 0.409 0.116 0 -0.097
Q4 -0.746 0.474 0.113 0 -0.084
Q5 -0.372 0.689 0.11 0.001 -0.045
Education Status
Diploma -0.034 0.71 0.099 0.001 -0.046
University -0.602 0.547 0.135 0 -0.069
Job status
Retired -0.325 0.722 0.115 0.005 -0.041
Employed -0.683 0.505 0.123 0 -0.091
Hospitalization(0)
1 0.213 1.237 0.13 0.102 0.027
2 0.402 1.495 0.144 0.005 0.057
3 or more 0.772 2.164 0.146 0 0.121
Type of Hospitals
SSO -0.523 0.593 0.089 0 -0.065
MH -0.279 0.757 0.099 0.005 -0.034
GA -0.418 0.658 0.113 0 -0.049
CH -0.355 0.701 0.311 0.254 -0.041
Health Insurance
Basic -0.214 0.807 0.085 0.012 -0.029
Supplementary -0.339 0.712 0.122 0.005 -0.041
Gender -0.291 0.748 0.118 0.014 -0.035
Household size -0.145 0.865 0.027 0 -0.019
Chronic disease 0.189 1.208 0.078 0.015 0.025
elderly 0.594 1.812 0.081 0 0.084
Home ownership -0.427 0.643 0.085 0 -0.053
Car ownership -0.572 0.564 0.076 0 -0.077
Number of observations: 6498, Hosmer-Lemeshow chi2(8): 5.620 , p-value: 0.689 LR chi2(23): 780.24, p-value: 0.000, pseudo R2: 0.1243
Source: Research findings; Stata 14 was used for all analyses.
Given the significance of the type of hospitals, in order to re-examine the robustness of our findings, we estimated four regressions to identify factors affecting the incidence of CHE in each hospital group. Because of the small number of observations in CH hospitals, we did not consider this group. The results are shown in Table 3. The combined effect of all the variables in these models were different from zero since p-values from log-likelihood ratio tests were less than 0.000 in all of them.
Table 4. Determinants of CHE in different types of hospitals Explanatory
Variables
Private Hospitals SSO Hospitals MH Hospitals GA Hospitals
Coefficient OR Coefficient OR Coefficient OR Coefficient OR
Cost Quintile (Q1)
Q2 -0.510 0.600 -0.538 0.584 -0.916 0.400 -0.743 0.475
(-0.036) (0.003) (0.017) (0.017)
Q3 (0.031) -0.511 0.600 (0.000) -0.853 0.426 (0.001) -1.189 0.304 (0.001) -1.027 0.358
Q4 (0.004) -0.669 0.512 (0.082) -0.330 0.719 (0.001) -1.189 0.305 (0.001) -1.002 0.367
Q5 -0.071 0.931 -0.202 0.817 -0.867 0.420 -0.654 0.520
(0.741) (0.307) (0.035) (0.035)
Education Status
Diploma 0.040 1.041 -0.362 0.696 -0.403 0.668 -0.802 0.448
(-0.856) (0.021) (0.008) (0.008)
University (-0.136) -0.377 0.686 (0.003) -0.855 0.425 (0.013) -0.326 0.722 (0.013) -0.901 0.406 Job Status
Retired (-0.627) -0.106 0.900 (0.028) -0.441 0.643 (0.002) -0.161 0.851 (0.002) -0.989 0.372
Employed (-0.028) -0.509 0.601 (0.000) -0.990 0.372 (0.000) -0.151 0.860 (0.000) -1.209 0.298 Hospitalization
1 (-0.016) 0.631 1.879 (0.427) 0.184 1.202 (0.156) 0.169 1.184 (0.156) -0.472 0.624
2 (-0.003) 0.837 2.308 (0.116) 0.396 1.486 (0.368) 0.145 1.156 (0.368) -0.341 0.711
3 or more (0.000) 1.082 2.951 (0.003) 0.745 2.106 (0.471) 0.765 2.149 (0.471) 0.271 1.312 Health Insurance
Basic -0.174 0.840 -0.301 0.740 -0.057 0.944 -0.248 0.781
(-0.231) (0.062) (0.313) (0.313)
Supplementary (-0.280) -0.205 0.815 (0.008) -0.704 0.495 (0.732) -0.139 0.870 (0.732) -0.111 0.895 Household
size
-0.169 0.844 -0.132 0.876 -0.156 0.855 -0.163 0.849
(-0.001) (0.006) (0.039) (0.039)
Chronic disease
0.155 1.168 0.218 1.244 0.383 1.466 0.043 1.044
(-0.251) (0.118) (0.848) (0.848)
Gender (-0.283) -0.237 0.789 (0.292) -0.216 0.806 (0.722) -0.091 0.913 (0.012) -0.860 0.423
Elderly (0.000) 0.665 1.945 (0.006) 0.400 1.492 (0.000) 0.936 2.550 (0.072) 0.424 1.528
Home ownership
-0.575 0.563 -0.535 0.585 -0.356 0.700 0.105 1.111
(0.000) (0.000) (0.046) (0.650)
Car ownership -0.433 0.659 -0.668 0.513 -0.765 0.465 -0.451 0.637
(-0.001) (0.285) (0.000) (0.029)
Number of observation 1845 2346 1316 908
Hosmer-Lemeshow chi2 7.780 8.790 5.630 3.970
P-value (0.455) (0.360) (0.689) (0.859)
Source: Research findings
The employment status of the household's head remained a significant determinant of exposure to CHE only in SSO and GA hospitals. As compared to households with unemployed heads, households with employed or retired heads had a lower risk of exposure to CHE in the GA hospitals. However, in SSO hospitals, as compared to households with unemployed heads, only households with employed heads were less likely to experience CHE.
Only in SSO hospitals, health insurance had a significant decreasing effect on the incidence of CHE. This is because over 70% of people admitted to SSO hospitals were covered by SSO health insurance. As a result, 70% of patients admitted to SSO hospitals paid no cost. In all other hospitals, patients had to pay at least 10% of the applicable tariffs. It, thus, seems that the health insurance was only effective when out-of-pocket payments were eliminated and policyholders chose the hospitals that were listed in their health insurances.
The increase in the number of hospitalization was associated with a higher risk of exposure to CHE in private hospitals. In all other types of hospitals, only when hospitalization increased from zero to three times and more, the risk of CHE was significantly higher. Hospitalization more than a few times a year was considered as a proxy for the possibility of chronic disease. Furthermore, multiple admissions during a year had indirect costs such as loss of income due to absenteeism, reduced productivity, and the risk of job loss.
Interestingly, the education level of the household's head was not linked with the incidence of CHE in private hospitals. In our sample, there was no positive relationship between people's educational attainment and their purchasing power. Almost 64% of people in the fifth cost quintile had at most senior high school degree. In relation to the gender of household's head, only in GA hospitals belonging to government agencies, female heads experienced a significantly lower risk of CHE. This is another indication of the bias inherited in aggregation. While the size of households and having an elderly remained significant factors in all hospitals, having a member with chronic disease remained only significant in MH hospitals.
Given the importance of the type of hospitals on the incidence of CHE, we attempted to investigate the characteristics of poor people (first and second cost quintiles) who decided to go to private hospitals despite their higher costs.
Table 4 reports the results. It seems that educated people were more likely to go to private hospitals. In particular, as compared to households with illiterate heads, households headed by a person with a diploma and university degrees were 1.73 and 2.68 times more likely to go to private hospitals, respectively. One explanation can be that people with higher education tend to acquire more information about diagnosis, which affects their behavior in the health domain.
significant factors, households headed by an unemployed person were more likely to go to private hospitals (Table 5).
Table 5. Determinant of poor household decision to go to a private hospital Explanatory Variables Coefficient Odds Ratio Std. Err p>|z| Marginal Effects Education Status
Diploma 0.310 1.363 0.100 0.100 0.044
University 0.920 2.509 0.135 0.000 0.166
Job status
Retired -0.784 0.456 0.115 0.000 -0.109
Employed -0.509 0.601 0.123 0.019 -0.075
Health Insurance
Basic -0.283 0.754 0.085 0.049 -0.043
Supplementary 0.412 1.510 0.122 0.047 0.067
Gender -0.496 0.609 0.118 0.048 -0.064
Household size -0.116 0.891 0.027 0.009
Chronic disease 0.218 1.244 0.078 0.132 0.033
elderly 0.386 1.471 0.081 0.006 0.059
Home ownership -0.152 0.859 0.085 0.311 -0.022
Car ownership 0.687 1.988 0.076 0.000 0.103
Number of observations: 1937, Hosmer-Lemeshow chi2: 10.17, p-value: 0.253 Source: Research findings; Stata 14 was used for all analyses.
Due to the unemployment, having an elderly member or a member with a chronic disease could contribute to a higher risk of CHE. It is puzzling why these poor people with lower capacity to pay decided to go to private hospitals? While it can be argued that poor people make poor decisions, we believe that medical decision-making concerned with salient outcomes such as the risk of surgery failure is ruled by households' emotion. Put another way, households concerned with the health of loved ones will opt for private hospitals that had no queuing and convince themselves that they did what they could while ignoring the long-run consequences of their decisions. This is also because of the widespread notion of higher efficiency and better-specialized services in private hospitals.
5. Concluding Remarks
Identifying demographic and socio-economic characteristics of households faced with CHE have been the subject of a multitude of studies (See, for example,
Our analysis identified many factors that affected the risk of CHE. For example, lack of health insurance, increased frequency of hospitalization, and the type of hospitals were linked with CHE. However, we demonstrated that the significant effect of insurance involved in aggregate data was solely determined by its effect in reducing the risk of CHE in SSO hospitals. Similarly, the significant effect of gender effect on aggregate data was derived by its effect in hospitals affiliated to government agencies that constituted 13.88% of our sample. Therefore, our results show the bias inherited in aggregation. It seems by taking into account the heterogeneity present across hospitals, a better picture can be depicted when examining the determinant of CHE among patients admitted to hospitals.
It seems that the significant effect of health insurance pertinent to the SSO is not because of higher accessibility of SSO hospitals. We identified many plausible explanations for the significant effect of insurance effect on SSO hospitals. First, the organization relies on higher pre-payments by the insured people that are almost twice the contributions paid through other basic health insurances. Second, policyholders of the social security health insurance pay no cost to the organizational hospitals. Third, the SSO is the supplier of both health insurance and retirement/disability insurance. This gives the organization some degree of flexibility as retirement resources can be used to cover short-term health costs. Fourth, the organization has vested interests in domestic pharmaceutical companies that can lead to lower health costs and lower out-of-pocket payments. Fifth, while the organization is subject to receiving government subsidies, it is not financed or managed by the government.
Apart from the higher efficiency of SSO, individuals' choice of hospitals was another important factor that affected the incidence of CHE. Individuals’ choice of hospitals should be matched with their ability to pay and their insurance policy obligations. Surprisingly, the choice of private hospitals by poor people was augmented by unemployment, having an elderly member, or a member with a chronic disease, all contributing to a higher risk of CHE.
The rate of CHE in private hospitals is 24.4%, which is above the aggregate rate and is the highest. With the rise of the private sector and the aging population, there would be more incidences of CHE, something that also was predicted by Xu
et al. (2003). Apart from private hospitals accessibility, some physicians advise
References
Basar, D., Brown, S., & Hole, A. R. (2012). Out-of-pocket health care expenditure in Turkey: Analysis of the household budget surveys 2002-2008.
Cavagnero, E., Carrin, G., Xu, K., & Aguilar-Rivera, A. M. (2006). Health financing in Argentina: An empirical study of health care expenditure and
utilization. Innovations in Health Financing: Working Paper Series, 8.
Ekman, B. (2007). Catastrophic health payments and health insurance: Some
counterintuitive evidence from one low-income country. Health
policy, 83(2-3), 304-313. Doi: 10.1016/j.healthpol.2007.02.004
Fazaeli, A. A., Ghaderi, H., Fazaeli, A. A., Lotfi, F., Salehi, M., & Mehrara, M. (2015). Main determinants of catastrophic health expenditures: A Bayesian
Logit approach on Iranian household survey data (2010). Global Journal of
Health Science, 7(4), 335-340. Doi: 10.5539/gjhs.v7n4p335
Ghiasvand, H., Hadian, M., Maleki, M. R., & Shabaninejad, H. (2010). Determinants of catastrophic medical payments in hospitals affiliated to Iran
University of Medical Sciences 2009. Hakim Research Journal, 13(3),
145-154. Doi: 0141707/AIM.0012
Ghiasvand, H., Sha’baninejad, H., Arab, M., & Rashidian, A. (2014). Hospitalization and catastrophic medical payment: Evidence from hospitals
located in Tehran. Archives of Iranian Medicine, 17(7), 507-513.
Doi: 0141707/AIM.0012
Harris, C. R., & Jenkins, M. (2006). Gender differences in risk assessment: Why
do women take fewer risks than men? Judgment and Decision Making, 1(1),
48-63.
Hatam, N., Orejlu, P. H., Jafari, A., & Kavosi, Z. (2015). Catastrophic healthcare expenditures of hospitalized patients in the hospitals of Shiraz in
2013. Shiraz E-Medical Journal, 16(5). e22231.
Li, Y., Wu, Q., Xu, L., Legge, D., Hao, Y., Gao, L., Ning, N. & Wan, G. (2012). Factors affecting catastrophic health expenditure and impoverishment from medical expenses in China: Policy implications of universal health
insurance. Bulletin of the World Health Organization, 90, 664-671. Doi:
10.2471/BLT.12.102178
Mahboobi-Ardakan, P., Mehraban, S., & Kazemian, M. (2016). Estimation of total consumption function of health care services in Iran from 1981 to
2011. Journal of Management and Training for Industries, 3(2), 30-40.
Mehrara, M., & Fazaeli, A. A. (2010). Health finance equity in Iran: An Analysis
of household survey data (1382-1386). Journal of Health
Administration, 13(40), 51-62.
Mehrdad, R. (2009). Health system in Iran. JMAJ, 52(1), 69-73.
Roberts, M., Hsiao, W., Berman, P., & Reich, M. (2003). Getting Health Reform
Sinha, R. K., Chatterjee, K., Nair, N., & Tripathy, P. K. (2016). Determinants of out-of-pocket and catastrophic health expenditure: A cross-sectional
study. British Journal of Medicine and Medical Research, 11(8), 1-11.
Therapeutic deputy of Ministry of Health and Medical Education (2011). General
Tariffs for Diagnostic and Therapeutic Services in Public and Private Sector at 2011. Tehran: Rahavard.
Xu, K., Evans, D. B., Kawabata, K., Zeramdini, R., Klavus, J., & Murray, C. J. (2003). Household catastrophic health expenditure: A multicountry
analysis. The Lancet, 362(9378), 111-117.
Xu, K., Evans, D. B., Kadama, P., Nabyonga, J., Ogwal, P. O., Nabukhonzo, P., & Aguilar, A. M. (2006). Understanding the impact of eliminating user fees:
Utilization and catastrophic health expenditures in Uganda. Social science &
Medicine, 62(4), 866-876. Doi: 10.1016/j.socscimed.2005.07.004
Yardim, M. S., Cilingiroglu, N., & Yardim, N. (2013). Financial protection in health in Turkey: The effects of the health transformation