Please cite this article in press as: Dubey DK, Nath DC. Measurement issues of low birth weight in India. J Biostat Epidemiol. 2017; 3(2): 31-40
J Biostat Epidemiol. 2017; 3(2): 31-40.
Original Article
Measurement issues of low birth weight in India
Dharmendra Kumar Dubey1*, Dilip C. Nath2
1
Department of National Drug Dependence Treatment Center and Psychiatry, All India Institute of Medical Sciences, New Delhi, India
2
Vice-chancellor, Assam University, Silcher, Assam, India
ARTICLE INFO ABSTRACT
Received 01.03.2017 Revised 07.05.2017 Accepted 16.05.2017 Published 04.06.2017
Background & Aim: Low birth weight (LBW) is a strong predictor of an individual baby's survival. LBW is defined by the World Health Organization (WHO) as weight at birth of less than 2500 g. The current study aimed to study the pattern of the reporting system of birth weight in India and examine the heaping at certain digits, assess the agreement between actual birth weight and birth weight reported based on recall, and identify key determinants of birth weight reporting in India.
Methods & Materials: The National Family Health Survey (NFHS-3) data was used for the present study. The sensitivity, specificity, positive predictive value and negative predictive value were calculated to assess the magnitude of the misclassification bias. In addition, univariate and multivariable analyses were also analyzed. Chi-square test was used to detect the associations and Cohen's kappa statistic was used for agreement between categories of birth weights and birth sizes.
Results: Mothers’ recalled assessment of baby’s size as small or normal were in agreement with the categories of birth weight as LBW or normal weight (K = 0.46, P < 0.050). The value of Kappa statistic indicated a moderate agreement between recalled birth size and recorded birth weight.
Conclusion: Due to this poor reporting system prevalent in the country, the actual prevalence of LBW can get affected. Method of reporting can also affect the actual scenario of the LBW due to hypothetical or memory recall base birth size.
Key words: Birth weight; Birth; Body height; Immediate recall; Health smart card
Introduction
1Low birth weight (LBW) has defined by the World Health Organization (WHO) as weight at birth of less than 2500 g (2.5 kg). LBW is a strong predictor of an individual baby's survival and it is an indicator of infant risk. The LBW infants are at increased risk of early growth retardation, infectious disease, developmental delay, and death during infancy and childhood risk (WHO, 2015). Worldwide, more than 15-30 million infants are born, among which 20% of them have LBW. This share is 96% in developing countries (1).
* Corresponding Author: Dharmendra Kumar Dubey, Postal Address: Department of National Drug Dependence Treatment Center and Psychiatry, All India Institute of Medical Sciences, New Delhi, India. Email: dubey.dharm@gmail.com
In developing countries, data on birth weight are very difficult to obtain, as most births occur outside health facilities. Many infants are not weighed at the time of birth, while those who are may not be given a formal record of birth weight or a birth certificate (2). The method of recording birth weight data can affect birth weight estimates in developing countries. Birth weight data are often difficult to obtain in less developed countries, especially in countries where most infants are born outside formal health systems (3).
birth weight and the incidence of LBW, and, if the sample size is sufficiently large, regional estimates within a country can also be made (5). Existing literature reveals that most of the studies related to LBW are a hospital-based data, only few of them are based on nationally representative surveys like National Family Health Survey (NFHS) data, especially on birth weight measurement issues. Realizing the measurement issue of LBW in India and need to catch the attention of researchers and policy-makers, it is decided to explore the subject in detail.
After reviewing the existing literature these key questions arise (i) what are the key measurement issues of birth weight in India? (ii) What is the level of heaping at certain digits in reporting of birth weight in India? (iii) What is the agreement between actual birth weight and
birth weight reported based on recall? Looking
at the importance of the issue, current study aimed to study the pattern of the reporting system of birth weight in India and examine the heaping at certain digits, assess the agreement between actual birth weight and birth weight reported based on recall, and identify key determinants of birth weight reporting in India.
Methods
NFHS-3 data conducted during 2005-2006 was used for analysis purpose. It provides a comprehensive picture of the population and health conditions in India. Birth weight is an important indicator of a child’s vulnerability to the risk of childhood illness and chances of survival. In the absence of birth weight, a mother’s subjective assessment of the size of the baby at birth is a useful proxy for birth weight. Birth weight was recorded on the NFHS-3 questionnaire for births in the five years preceding the survey either from a written record or the mother’s memory recall. Since birth weight may not be known for many babies, the mother’s estimate of the baby’s size at birth was obtained for all births (6). The present study is based on the sample of births, five years preceding the date of survey. Questions related to pregnancy outcomes and the health of offspring were mainly administered for last pregnancy and last birth
occurring within 5 years of the survey date. Thus, the amount of time between birth and recall ranged from 0 to 5 years.
Children whose birth weight were less than 2.5 kilograms, or children reported to be very small or smaller than average were considered to have a higher than average risk of early childhood death. Information on mother’s perception of birth size was obtained by asking, ‘‘when (NAME) was born was he/she very large, larger than average, average, smaller than average, or very small? Was (NAME) weighed at birth? (IF YES), how much did (NAME) weigh?’’ The response categories were small size, smaller than average, average, larger than average and large. This question was asked before the question about actual birth weight, to minimize the influence of maternal knowledge about actual birth weight on assessment of birth size.
For the purpose of analysis mothers perception of birth size was categorized in two groups of normal birth weight which is large + larger than average + average, and LBW which is smaller than average + small size. The survey gathered information on birth weight either from the child’s health card or mother memory recall. Birth weight variable was used as a dichotomous dependent variable and selected socioeconomic, demographic and health variables as explanatory variables, including place of residence, education, economic status, caste, religion, birth order, age, place of delivery, working status and region.
The consistency between mother’s
assessment of the birth size and recorded birth weight were analyzed by comparing the birth size (small and normal size) with birth weight categorized as LBW (< 2500 g) and normal (> 2500 g). The analysis focused on the usefulness of the less than normal size or small size category, as an indicator of LBW. Mothers’ reports were considered accurate when the reported size of the baby as small or normal corresponded exactly to low or normal birth weight. The sensitivity, specificity, positive predictive value and negative predictive value of maternal recall of birth size as small as an indicator of LBW were calculated to assess the magnitude of the misclassification bias.
analyses were conducted to identify the significant differentials and determinants of having birth weight records. In multivariable analysis, logistic regression was performed with birth weight recorded or missing as dichotomous
dependent variable and socioeconomic,
demographic variables as explanatory variables. The chi-square test was used to detect associations between two categorical variables and Cohen's kappa test was used to test for agreement between categories of birth weights and birth sizes. Kappa value equals to (observed agreement - expected agreement) / (1- expected agreement) (7). Validation of the maternal self-report with the birth weight taken from health card was measured by calculating the sensitivity and specificity for measuring bias and kappa
score for measuring precision. Kappa
coefficients were considered to represent excellent agreement if the value was greater than 0.75, the moderate agreement if the value was between 0.40 to 0.75 and poor agreement if the value was less than 0.40 (8).
Results
Recorded birth weight and mother’s recall
birth size: Among the survey respondents,
nearly one-third reported birth weight during the 5 years preceding the survey date. However, out of reported birth weight, birth weight was reported 87% through mother memory recall method and 13% through health card method. Information reported through both methods either birth weights and birth size were available for 34% births. For the other 66% cases, mothers could not produce the health card, which was recorded under missing cases. Since the accuracy of mother’s subjective evaluation of birth weight can be assessed only for births for which actual birth weight was available by Boerma et al. (5). The data on actual birth weight, recorded in grams, exhibited heaping on multiples of 500 g (Figure 1). Heaping is a typical pattern of misreporting or recording of certain information, such as age, height, or birth weight, showing a large concentration of particular values (9). The frequency distribution of recorded birth weights shows unusually large
frequencies of values of birth weight ending in 0 or 5. In India, 19% of the birth weights were recorded at exact weight 2500 g. This indicates that the medical personnel who weigh the infants often round birth weight to the nearest 500 g. Heaping is also important for estimating the percentage of infants with LBW (10). When there is heaping at 2500 g, the cut-off point for LBW, it affects the estimate of the prevalence of LBW.
Figure 1. Heaping of reported birth weights on multiple of 500 g, India
Table 1 presents the distribution of the reported birth weight and not reported (missing) birth
weight according to different explanatory
variables. In India, only 34% birth weight reported either from a health card or mother’s memory recall and not reported birth weight was 66%. Urban respondent reported birth weight was more
than rural respondent (60% and 25%,
respectively). It was found that missing records are less in urban than rural respondents. The distributions of birth weight reporting and not reporting (missing) according to explanatory variables are shown in table 1. The results of chi-square analysis indicated that all predictor variables were significantly associated with having birth weight records and missing records. Table 2 shows the heaping of birth weight, which is reported on exact weight of 2500 g either by health card or mother memory recall. In India, 19% of birth weight is reported on exact weight. Reported weight varies from health card (16%) which is less than mother memory recall (19%). The reported birth weight on exact weight of 2500 g varies in either health card or mother memory recall according to explanatory variables.
0 500 1000 1500 2000 2500 3000 3500 4000 4500 5 0 0 1 0 0 0 1 5 0 0 2 0 0 0 2 5 0 0 3 0 0 0 3 5 0 0 4 0 0 0 4 5 0 0 5 0 0 0 5 5 0 0 6 0 0 0 6 5 0 0 7 0 0 0 7 5 0 0 8 0 0 0 Num ber o f birt h
Table 1. The percent and sample distribution of the reported birth weight and missing records, according to background characteristics, India, 2005-2006
Variable BW reported [n (%)] Missing records [n (%)] P-value*
Place of residence < 0.001
Urban 8623 (60.3) 5680 (39.7)
Rural 10626 (25.2) 31509 (74.8)
Education of mother < 0.001
No education 3944 (14.0) 24293 (86.0)
Educated < secondary 11310 (48.6) 11985 (51.4)
Secondary and above 3995 (81.4) 910 (18.6)
Economic status < 0.001
Poor 4163 (15.4) 22868 (84.6)
Middle 3757 (33.6) 7424 (66.4)
Rich 11337 (62.2) 6889 (37.8)
Caste < 0.001
Schedule caste 3322 (28.3) 8405 (71.6)
Schedule tribe 1142 (21.2) 4247 (78.8)
Other backward class 7417 (32.3) 15545 (67.7)
Others 6829 (46.9) 7731 (53.1)
Religion < 0.001
Hindu 15365 (34.8) 28787 (65.2)
Muslim 2622 (27.2) 7019 (72.8)
Others 1285 (48.6) 1360 (51.4)
Birth order < 0.001
1st order 8553 (50.0) 8553 (50.0)
2nd order 6376 (41.7) 8913 (58.3)
3rd order 2404 (26.3) 6736 (73.7)
4th order 1018 (17.7) 4734 (82.3)
5th and above order 888 (9.7) 8262 (90.3)
Age of mother < 0.001
15-24 years 8424 (35.5) 15300 (64.5)
25-34 years 9842 (35.3) 18022 (64.7)
35-49 years 983 (20.3) 3867 (79.7)
Place of delivery < 0.001
Home 2515 (7.3) 31945 (92.7)
Institutional 16834 (76.6) 5143 (23.4)
Working status < 0.001
Working 4789 (28.9) 11794 (71.1)
Nonworking 14432 (36.3) 25325 (63.7)
Method of reporting < 0.001
From card 531 (12.8) 3615 (87.2)
From recall 13170 (87.2) 1933 (12.8)
Region < 0.001
North 2038 (27.9) 5276 (72.1)
East 3545 (24.9) 10693 (75.1)
North East 557 (26.1) 1582 (73.9)
West 4528 (64.1) 2537 (35.9)
South 6480 (72.6) 2441 (27.4)
Central 2101 (12.5) 14659 (87.5)
Total 19250 (34.1) 37188 (65.9)
Table 2. Represents the percentage and number of the reported birth weight from health card and mother memory recall on exact weight 2500 g, according to background characteristics, India, 2005-2006
Variables From card (2500 g) From recall (2500 g) Total heaping at (2500 g)
Place of residence
Urban 237 (16.90) 1379 (19.10) 1616 (18.70)
Rural 212 (15.70) 1760 (19.00) 1972 (18.60)
Education
No education 62 (17.30) 723 (20.20) 785 (19.90)
Educated < secondary 278 (17.30) 1847 (19.00) 2125 (18.80)
Secondary and above 110 (13.90) 570 (17.80) 680 (17.00)
Economic status
Poor 74 (19.80) 783 (20.70) 857 (20.60)
Middle 84 (17.20) 628 (19.20) 712 (19.00)
Rich 291 (15.40) 1729 (18.30) 2020 (17.80)
Caste
Schedule caste 74 (19.10) 599 (20.30) 673 (20.20)
Schedule tribe 18 (13.00) 174 (17.30) 192 (16.80)
Other backward class 169 (15.40) 1181 (18.70) 1350 (18.20)
Others 169 (16.50) 1113 (19.20) 1282 (18.80)
Religion
Hindu 353 (16.80) 2553 (19.30) 2906 (18.90)
Muslim 60 (13.70) 399 (18.30) 459 (17.50)
Others 36 (16.40) 188 (17.70) 224 (17.40)
Birth order
1st order 236 (17.70) 1404 (19.40) 1640 (19.20)
2nd order 145 (15.30) 1031 (19.00) 1176 (18.40)
3rd order 49 (16.70) 416 (19.70) 464 (19.40)
4th order 10 (9.60) 156 (17.00) 166 (16.30)
5th and above order 09 (12.90) 133 (16.30) 142 (16.00)
Age
15-24 years 194 (18.30) 1495 (20.30) 1689 (20.00)
25-34 years 225 (14.70) 1502 (18.10) 1727 (17.60)
35-49 years 31 (18.90) 143 (17.50) 174 (17.70)
Place of delivery
Home 40 (17.80) 423 (18.50) 463 (18.40)
Institutional 410 (16.20) 2716 (19.10) 3124 (18.70)
Working status
Working 77 (14.50) 826 (19.40) 903 (18.90)
Nonworking 372 (16.70) 2312 (18.90) 2684 (18.60)
Region
North 32 (18.00) 365 (19.60) 397 (19.50)
East 87 (22.70) 618 (19.60) 705 (19.90)
North East 05 (7.60) 76 (15.50) 81 (14.50)
West 104 (18.70) 792 (19.90) 896 (19.80)
South 184 (13.50) 863 (16.90) 1047 (16.20)
Central 37 (18.00) 427 (22.50) 464 (22.10)
Total 450 (16.30) 3140 (19.00) 3590 (18.60)
Data are shown as number (%); Total number may not be matched for each variable due to the missing case
Heaping of the birth weight: The data on
numerical birth weight exhibited considerable heaping on digits that were multiples of 500 g. Heaping refers to a pattern of misreporting in which the distribution of a number reported by
which the heaping is clearly visible. The heaping indicates that birth weights are often rounded, either by medical personnel who weigh the infants and write the weight on health card or by mothers themselves when recalling the figure. Magnitude of birth weight heaping tended to increases the pattern of low birth weight. This pattern suggests that there is some diminution in mother’s ability to recall the exact weight as time since the birth increases. In addition, heaping is substantially worse (i.e. there are more birth weights that are multiples of 500 g) for infants whose weights were reported from mother’s recall than when birth weights were recorded on a health record. Although heaping is an indication of overall data quality, for the purposes of estimating the percentage of infants with LBW, it is the heaping at 2500 g, the cut-off point for LBW which is most important. Across the survey, approximately 19% of infants were reported to have weighed exactly 2500 g at birth. Assuming that a proportion of the newborn reported as weighing 2500 g actually weighed less than 2500 g, some LBW babies would be misclassified as having had a normal birth weight and the prevalence of LBW will be biased downwards. Heaping of the birth weight is an issue in reported birth weight because at time of reporting respondent reported a hypothetical weight, so it may be misleading in the estimation of overall LBW data.
Birth weight pyramid: Birth weight pyramid
showing the proportion of weights in each birth weight category by the method of recall and health card in India. The observed heaping patterns are graphically illustrated in the form of birth weight pyramid (Figure 2), which are analogous to population pyramid. This pyramid clearly shows that for most heaping was common for memory recalled birth weights and health card. The distribution of reported birth weights, although not perfectly normally distributed, was very close to the unimodal bell-shaped distribution of weights. However, the weights recorded from health cards and memory recall were highly heaped at weight recorded between (2501-3000 g). The pyramid indicated that there was the proportion of infants in the groups of the birth weight distribution when the
birth weight was recalled from memory. This is clearly equal to the birth weight reported through health card.
Figure 2. Birth weight pyramid showing the proportion of weights in each birth weight category by method of recall, India
Sensitivity and specificity of birth size in
predicting LBW: The sensitivity, specificity,
positive predictive value, and negative
predictive value of small maternal recalled birth size as an indicator of LBW are calculated according to different background characteristics based on the contingency table. It is evident from the availability of data about 87% of cases, mothers’ recalled assessment of baby’s size as small or normal were in agreement with the categories of birth weight as LBW or normal weight (K = 0.46, P < 0.050). The value of Kappa statistic indicated a moderate agreement between recalled birth size and recorded birth weight. The sensitivity analysis indicated that 53% of LBW babies were accurately assessed by their mothers as small, and the specificity indicated that 91% of normal birth weight infants were correctly assessed by their mothers as not being small. The positive predictive value of small size revealed that more than half (61%) of infants whose mothers considered them to be small had actually LBW. The negative predictive value is 88% of normal size who remained normal as per recorded birth weight in India. According to different background characteristics, sensitivity, specificity, positive and negative predictive values (PPV and NPV), and kappa value with confidence interval (CI) has shown in table 3.
0.6 2.5 7.2 25.2 33 23.8 5.3 1.4 1 0 0.1 1 3.9 10.5 25.5 32.9 17.8 5.4 1.6 1.1 .1
Table 3. The percentage of the validity and agreement of maternal self-reported birth size compare to birth weight taken by different background characteristics.
Variables Sensitivity
(%)
Specificity (%)
PPV (%)
NPV (%)
Kappa statistic
CI for Kappa statistic Lower Upper
Place of residence
Urban 53.4 90.7 57.9 89.0 0.45 0.44 0.46
Rural 53.4 90.8 63.8 86.5 0.46 0.45 0.47
Education
No education 53.6 90.2 66.0 84.6 0.46 0.45 0.48
Educated < secondary 54.5 90.3 61.3 87.6 0.46 0.45 0.47
Secondary and above 48.8 92.3 54.1 90.6 0.42 0.41 0.44
Economic status
Poor 57.7 88.6 63.3 86.0 0.47 0.46 0.49
Middle 56.2 90.3 64.2 86.9 0.48 0.47 0.50
Rich 50.3 91.6 59.0 88.4 0.44 0.43 0.45
Religion
Hindu 53.5 90.5 61.1 87.5 0.46 0.45 0.47
Muslim 52.7 92.7 64.7 88.6 0.48 0.47 0.50
Others 54.3 89.6 57.8 88.3 0.45 0.44 0.48
Birth order
1st order 53.9 89.9 60.6 87.2 0.45 0.44 0.46
2nd order 51.5 91.5 59.8 88.5 0.45 0.44 0.46
3rd order 56.9 90.6 62.0 88.6 0.49 0.48 0.51
4th order 51.3 90.7 61.4 86.7 0.44 0.43 0.47
5th and above order 53.9 93.7 75.5 85.0 0.52 0.51 0.55
Caste
Schedule Caste 52.4 90.1 62.0 86.1 0.45 0.44 0.47
Schedule tribe 57.9 87.6 58.8 87.2 0.46 0.45 0.49
Other backward class 53.6 90.7 60.7 87.9 0.46 0.45 0.47
Others 52.5 91.6 61.7 88.2 0.47 0.46 0.48
Age
15-24 years 54.9 89.2 61.6 86.2 0.45 0.44 0.46
25-34 years 51.8 91.9 61.3 88.5 0.46 0.45 0.47
35-49 years 55.2 91.9 57.9 91.0 0.48 0.47 0.51
Place of delivery
Home 53.5 91.3 66.1 86.1 0.47 0.46 0.49
Institutional 53.3 90.7 60.5 87.9 0.46 0.45 0.47
Working status
Working 53.8 90.6 61.2 87.7 0.46 0.45 0.47
Nonworking 52.6 91.0 61.5 87.5 0.46 0.45 0.47
Region
North 49.9 90.2 65.9 82.5 0.43 0.42 0.45
Central 51.0 90.5 62.1 85.8 0.44 0.43 0.46
East 60.2 92.5 70.8 88.6 0.56 0.55 0.58
Northeast 65.4 91.7 63.5 92.3 0.56 0.55 0.60
West 50.8 90.8 60.9 86.7 0.44 0.43 0.45
South 52.5 89.9 53.5 89.6 0.43 0.42 0.44
Total 53.4 90.7 61.3 87.7 0.46 0.45 0.47
PPV: Positive predictive value; NPV: Negative predictive value; CI: Confidence interval
And kappa statistic indicates moderate agreement for each predictor between mother recall of the birth size and numerical birth weight recorded. Kappa values for all predictors belonged to the range between 0.42 and 0.56. For each predictor variable, kappa statistic was calculated and significant P was considered as less than 0.050. These were statistically significant for all predictor variables.
The actual birth weight was not available for 66% of the infants, as their mothers could not
produce health cards. This might have introduced a selection bias in the data analysis because infants with recorded or missing birth
weights are likely to have different
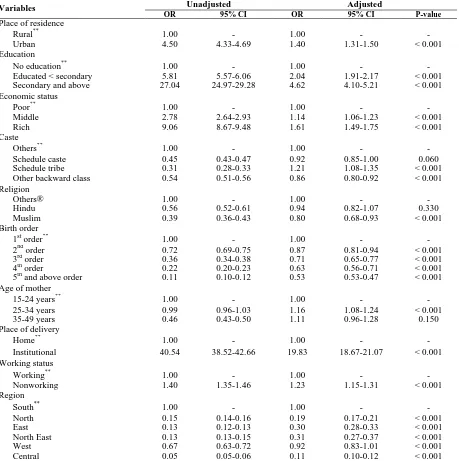
variables and all significant factors identified in the univariate analysis as predictors. The results of the logistic regression analysis showing the extent of the effects [odds ratio (OR)] of predictors on having birth weight recorded. Except for Hindu, age group 35-49 and western region of India, all other significant predictors of having birth weight records from the univariate
analysis remained significant in the
multivariable analysis. Controlling for other factors, Infants of mothers who live in urban places were 1.40 times (OR: 1.40, 95% CI: 1.31-1.50, P < 0.050) as likely to have birth weight recorded than those living mothers in rural places. Rest explanatory variables shown in (Table 4).
Table 4. The results of logistic regression predicting odds of having birth weight record, India, National Family Health Survey (NFHS), 2005-2006.
Variables Unadjusted Adjusted
OR 95% CI OR 95% CI P-value
Place of residence
Rural** 1.00 - 1.00 - -
Urban 4.50 4.33-4.69 1.40 1.31-1.50 < 0.001
Education
No education** 1.00 - 1.00 - -
Educated < secondary 5.81 5.57-6.06 2.04 1.91-2.17 < 0.001
Secondary and above 27.04 24.97-29.28 4.62 4.10-5.21 < 0.001
Economic status
Poor** 1.00 - 1.00 - -
Middle 2.78 2.64-2.93 1.14 1.06-1.23 < 0.001
Rich 9.06 8.67-9.48 1.61 1.49-1.75 < 0.001
Caste
Others** 1.00 - 1.00 - -
Schedule caste 0.45 0.43-0.47 0.92 0.85-1.00 0.060
Schedule tribe 0.31 0.28-0.33 1.21 1.08-1.35 < 0.001
Other backward class 0.54 0.51-0.56 0.86 0.80-0.92 < 0.001
Religion
Others® 1.00 - 1.00 - -
Hindu 0.56 0.52-0.61 0.94 0.82-1.07 0.330
Muslim 0.39 0.36-0.43 0.80 0.68-0.93 < 0.001
Birth order
1st order** 1.00 - 1.00 - -
2nd order 0.72 0.69-0.75 0.87 0.81-0.94 < 0.001
3rd order 0.36 0.34-0.38 0.71 0.65-0.77 < 0.001
4th order 0.22 0.20-0.23 0.63 0.56-0.71 < 0.001
5th and above order 0.11 0.10-0.12 0.53 0.53-0.47 < 0.001
Age of mother
15-24 years** 1.00 - 1.00 - -
25-34 years 0.99 0.96-1.03 1.16 1.08-1.24 < 0.001
35-49 years 0.46 0.43-0.50 1.11 0.96-1.28 0.150
Place of delivery
Home** 1.00 - 1.00 - -
Institutional 40.54 38.52-42.66 19.83 18.67-21.07 < 0.001
Working status
Working** 1.00 - 1.00 - -
Nonworking 1.40 1.35-1.46 1.23 1.15-1.31 < 0.001
Region
South** 1.00 - 1.00 - -
North 0.15 0.14-0.16 0.19 0.17-0.21 < 0.001
East 0.13 0.12-0.13 0.30 0.28-0.33 < 0.001
North East 0.13 0.13-0.15 0.31 0.27-0.37 < 0.001
West 0.67 0.63-0.72 0.92 0.83-1.01 < 0.001
Central 0.05 0.05-0.06 0.11 0.10-0.12 < 0.001
Discussion
This paper deals with reporting of birth weight in India including heaping at certain digits and key determinants. This study has three objectives, first one is to study the pattern of the reporting system of birth weight in India and examine the heaping at certain digits. The result showed that only one-third of births in India were weighted at birth either from health card or from recall and remaining two-third births were missing. Further, reporting of birth weight was found lower in rural areas, among uneducated mothers, households with poor economic status, schedule tribes, Muslims, and for higher order births. Birth weight was also reported in less proportion among mothers belong to higher age group, for births that took place at home and in the Central region of India. Significant differential in birth weight reporting between home delivery and institutional delivery suggest that promoting institutional delivery in India may improve birth weight reporting in the country. Further, data revealed that substantial heaping of reported birth weight occurs on weights of exactly 2500 g, the cut-off point for LBW. Some of the birth weights reported as being exactly 2500 g might be of less than 2500 g; thus, not including them could lead to biased estimates of the prevalence of LBW downwards. The birth weight is reported either through health card or mother memory recall, maternal recall of infant characteristics and events occurring during labor and delivery were excellent at four months post-partum (11). The proportion of infants not weighed at birth is routinely reported. Efforts are needed to increase the weighing of newborns and the recording of
their weights (10). Infants with missing birth
weight records were more likely to have LBW. Maternal recalled birth size appeared to be a poor proxy for birth weight. Estimates of LBW based on maternal assessments of birth size as small should be considered as an underestimate of its actual prevalence. As infants with missing birth weight data have different characteristics from those with recorded birth weight, estimates of LBW depending solely on available birth weight records will produce a biased prevalence
(12). Channon found that there were substantial differences in the distribution of birth weights by the method of reporting (2).
Second objective deals with an agreement between low birth based on actual reported weight and LBW approximated using reported birth size based on recall. Agreement analysis showed moderate level (K = 0.46, P < 0.050) agreement between actual birth and hypothetical birth size. The sensitivity and specificity analysis indicated that 53% of babies reported by their mothers as small were actually LBW, while 91% of LBW babies were accurately assessed by their mothers as small. Although mothers’ perception of birth size appeared to be consistent with the recorded birth weight at the aggregate level, there are a substantial number of misclassifications of birth weight, particularly for babies considered small, and it may be concluded that small maternal recalled size is not a satisfactory proxy for LBW. This finding is in agreement with many previous studies (3, 5, 10, 13-15).
Third objective deals to identify key determinants of birth weight reporting. Results suggest that birth weight of infants with missing vs. reporting is likely to have different characteristics. Univariate analysis provides unadjusted effects of predictor variables on the response variable without controlling the effects of other predictor variables. The adjusted effect of a predictor variable was obtained through multivariable logistic regression analysis using missing vs. reporting birth weight as response variables and all significant factors identified in the univariate analysis. All predictors were significant in terms of birth weight records through univariate and multivariable analysis. Subramanyam et al. had also focused to describe the population data, represent and compare the birth weight reported from health cards with
maternal recall data in terms of its
socioeconomic patterning and as a risk factor for childhood growth failure (16).
Conclusion
prevalent in the country, the actual prevalence of LBW can get affected. Method of reporting can also affect the actual scenario of the LBW due to hypothetical or memory recall base birth size.
Conflict of Interests
Authors have no conflict of interests.
Acknowledgments
The work described in this paper was extracted from Ph.D. thesis from Department of Statistics, Gauhati University, Assam, India.
References
1. Rekha C, Whelan RM, Reddy P, Reddy PS.
Evaluation of adjustment methods used to determine prevalence of low birth-weight babies at a rural hospital in Andhra Pradesh, India. Indian J Public Health 2013; 57(3): 177-80.
2. Channon AA. Can mothers judge the size of
their newborn? Assessing the determinants of a mother's perception of a baby's size at birth. J Biosoc Sci 2011; 43(5): 555-73.
3. Channon AA, Padmadas SS, McDonald JW.
Measuring birth weight in developing countries: Does the method of reporting in retrospective surveys matter? Matern Child Health J 2011; 15(1): 12-8.
4. United Nations. Resolutions and decisions
adopted by the general assembly during its twenty-sixth special session. New York, NY: United Nations Publications; 2002.
5. Boerma JT, Weinstein KI, Rutstein SO,
Sommerfelt AE. Data on birth weight in developing countries: Can surveys help? Bull World Health Organ 1996; 74(2): 209-16.
6. Ministry of Health and Family Welfare
Government of India. National family health
survey (NFHS-3). Mumbai, India:
International Institute for Population
Sciences; 2007.
7. Sundaram KR, Dwivedi SN, Sreenivas V.
Medical statistics: Principles and practice. Philadelphia, PA: Lippincott Williams & Wilkins; 2014.
8. Gayle HD, Yip R, Frank MJ, Nieburg P,
Binkin NJ. Validation of maternally reported birth weights among 46,637 Tennessee WIC program participants. Public Health Rep 1988; 103(2): 143-7.
9. Shryock HS. The methods and materials of
demography. Philadelphia, PA: Elsevier Academic Press; 2004.
10. Blanc AK, Wardlaw T. Monitoring low birth
weight: An evaluation of international
estimates and an updated estimation
procedure. Bull World Health Organ 2005; 83(3): 178-85.
11. Bat-Erdene U, Metcalfe A, McDonald SW,
Tough SC. Validation of Canadian mothers' recall of events in labour and delivery with electronic health records. BMC Pregnancy Childbirth 2013; 13(Suppl 1): S3.
12. Islam MM. Can maternal recalled birth size
be used as a proxy measure of birth weight? An evaluation based on a population health survey in Oman. Matern Child Health J 2014; 18(6): 1462-70.
13. Al Riyami A, Afifi M, Al Kharusi H, Morsi M. National health survey 2000. Principal report. Muscat, Oman: Ministry of Health; 2000.
14. Eggleston E, Tsui AO, Fortney J. Assessing
survey measures of infant birth weight and birth size in Ecuador. J Biosoc Sci 2000; 32(3): 373-82.
15. Robles A, Goldman N. Can accurate data on
birthweight be obtained from health interview surveys? Int J Epidemiol 1999; 28(5): 925-31.
16. Subramanyam MA, Ackerson LK,