AUT J. Elec. Eng., 49(2)(2017)205-214 DOI: 10.22060/eej.2017.12131.5043
Internal Fault Detection, Location, and Classification in Stator Winding of the
Synchronous Generators Based on the Terminal Voltage Waveform
M. Fayazi and F. Haghjoo*
Dept. of Electrical Engineering, Shahid Beheshti University, Tehran, Iran
ABSTRACT: In this paper, a novel method is presented for detection and classification of the faulty phase/region in the stator winding of synchronous generators on the basis of the resulting harmonic components that appear in the terminal voltage waveforms. Analytical results obtained through Decision Tree (DT) show that the internal faults are not only detectable but also they can be classified and the related region can be estimated. Therefore, this scheme can be used to protect the synchronous generators against the various internal faults. Fuji technical documents and data sheets for an actual salient pole synchronous generator (one unit of an Iran’s hydroelectric power plants) are used for the modeling. Simulations in Maxwell software environment are presented. All the related parameters, such as B-H curve, unsymmetrical air gap and pole saliency, slot-teeth effect, and other actual parameters, are considered to obtain a comprehensive model to generate acceptable terminal voltage waveforms without any simplification.
Review History:
Received: 7 November 2016 Revised: 17 February 2017 Accepted: 28 August 2017 Available Online: 17 September 2017
Keywords:
Synchronous Generator Internal Faults Turn-Turn Faults Phase To Ground Faults Detection
Classification Location
Harmonic Components Decision Tree
1- Introduction
Considering the importance of synchronous generators protection due to their essential role in the power system, different algorithms for detection, classification, and location of the fault in the stator windings of synchronous generators are studied.
The best and general form of the stator protection in the face of phase-to-phase and phase-to-ground fault occurrence is provided by an instantaneous longitudinal percentage biased differential relay. Turn to Turn Fault (TTF) occurrence on one phase of the stator winding cannot disturb the balance between the currents in the neutral and the terminal CTs. Accordingly, these types of the faults cannot be detected by such a protective scheme while it is detectable by transverse differential protection when the generator has (only) two windings per phase [1].
In the case of a stator winding with two or more branches connected in parallel for each phase, it is preferable to apply a circulating or a differential current for the TTF detection. During TTFs on the windings with parallel branches, the current distribution in those branches is changed and the current circulating between them is used for the fault registration in the current differential method [2].
Generators having single winding per phase or those generators whose parallel windings are not accessible can be protected by using zero component of voltage, which is caused by Electro-Motive Force (EMF) reduction in the faulty phase. This component is achievable through the secondary winding
of the voltage transformer connected to generator winding terminals [1]. Although the above schemes cannot detect weak faults (such as single turn-turn ones), other methods had been proposed to achieve this goal by considering a model for the stator winding. P. H Park et al. [3] proposed the dq0 model in which a sinusoidal distribution is assumed for the machine winding. Using such model, only the fundamental component is recognized and all the higher space harmonics produced by the machine windings are neglected. For example, when a TTF occurs in the machine, the generated flux distribution in the air-gap is no longer sinusoidal and significant space harmonics will be produced in the air-gap magnetic field. Since the dq0 model fails to model internal faults, other models were generally derived in the phase domain [4–9], where the voltage and flux linkage equations are directly developed in the fixed phase reference. These fault models suppose that the ratio between the winding inductances is proportional to the ratio between the effective numbers of winding turns. However, this is acceptable when the windings are concentrated or a pure sinusoidal distribution of magneto-motive force exists in the air gap.
Another synchronous machine model, which is presented in [10–16], analyzes the internal faults based on the modified winding function theory by the electrical parameters of the machine. Although all space harmonics generated by the windings are accounted by this model, the assumption of sinusoidal distribution cannot justify the large salient pole synchronous generators. A method for 100% stator winding protection against the phase-to-ground faults (PGFs) is presented in [15], where the component of zero sequence voltage and the third harmonic voltage are used in this model
to detect PGFs. This method uses the main component of zero sequence voltage to detect PGFs in 95% of the stator winding and the related third harmonic component for fault detection in the remnant winding (5%) in the neutral point vicinity. A combination of winding function theory and direct phase quantities is used in [17-19] to simulate the internal faults in the synchronous machines. In this simulation, only the odd space harmonics are considered to calculate the winding inductances while the faulty windings can produce some harmonics and even fractional sub-harmonics.
The author of the paper [18] proposed a model that simulates synchronous machine by a multi-loop circuit formed by coils that are moving relative to each other. The calculation of the loop inductance is based on coil-to-coil approach. However, it is very difficult to apply internal faults (especially TTFs) to this model (especially for large machines with many coils in stator). Another technique to partition the stator winding is presented in [20], in which the air-gap space harmonics are neglected. Some researches have focused on numerical algorithms to measure harmonics or statistical value to detect faults in the stator windings. For example, the Principal Component Analysis (PCA) is used in [21] to detect stator winding faults, while it cannot detect weak TTFs or PGFs near the neutral point. Another protective method used the 3rd harmonic component of the voltage waveform in the neutral point and stator terminations, which cannot exhibit high sensitivity, and the related setting will change in a wide range while the operating condition varies [22].
TTFs create some distortions in the air gap flux configuration. Accordingly, the induced voltage waveform in the same phase will be reduced and distorted. Simultaneously, some distortions will induce in the healthy phase voltage waveforms. Reduction in the voltage amplitudes and the related distortions in the voltage waveforms depend on the type, location, and number of turns of the fault. Thereby, three phases of the generator cannot be considered as the separated ones and their interactions must be regarded.
TTF or PGF will occur due to a damage to the insulation between the adjacent bars or between a bar and the stator core, respectively. The current through the faulty point to the ground in PGFs can be sensed by a differential relay. However, a low current from PGF occurrence in the neutral point vicinity cannot activate such protective device. Although the probability of the fault occurrence in the neutral point vicinity is very low (voltage between these bars and the grounded core is very low), it should be noted that such fault might provide circumstances to occur phase-to-phase or turn- to-turn faults. In terms of the generator protection against PGFs, the proposed techniques depend on the generator grounding type. The modeled synchronous generator in this paper is a high impedance grounded generator (HIG), in which (as a common problem) PGF occurrence in the 5% of the winding in the neutral point vicinity cannot be detected.
To achieve a comprehensive model for the generator, simulations are done using FEM algorithm in Maxwell software with considering the effects of the following items:
• Pole saliency and air gap irregularity;
• Magnetic nonlinear characteristics (Core saturation); • Stator edge (slot-teeth);
• Mutual inductance of the phases;
• Air gap flux distortion and its effect on the other phases and windings.
Moreover, not only bars dimensions but also insulation between the bars are applied in our model based on Fuji technical documents, plans, and data sheets. Since all the important parameters are considered in these simulations, we assert that unlike the above mentioned models, which find a compact and simple model to simulate the faulty machine, a comprehensive and precise model is presented in this paper without any simplification.
Since Phase-to-Phase faults (PPFs) are easily detectable by differential relays, internal faults, including TTFs and PGFs are discussed in this paper. Various internal faults are detected and classified based on the created distortions in the three phase terminal voltage waveforms. These voltage waveforms are available through the installed PT on the generator terminals. Also, since detection algorithms based on the smaller input parameters are preferred, a Decision Tree-based algorithm is applied to extract the best harmonic components obtained by DFT process to detect, locate, and classify the mentioned internal faults.
Decision Tree (DT) is a graphical tree-shaped representation of a decision that can be used to determine a statistical probability of some events. Each branch of the tree exhibits possible decision or the related probability to occur that event. DT can be introduced as an appropriate way to understand the potential options of a decision and its range of possible results. Clementine, DPL, Edraw, and Gratis can be pointed as some of the existing DT softwares that are presented to solve the complicated problems, from which Clementine is used in this paper.
Determining the faulty phase and the number of the shorted turns is done for the simulated TTFs in this paper. Also, fault detection, faulty phase identification, and fault location are performed for simulated PGFs.
2- Modeling of synchronous generator
To generate the necessary signal waveforms, a hydroelectric synchronous generator designed by Fuji is selected and simulated using Maxwell software. This generator is operating now in one of Iranian power plants with the presented technical specifications in Table I. A section of this generator with details in Maxwell software is shown in Figure 1. A view of the flux density (B) distribution of one cross section of the generator in normal condition (NC) is shown in Figure 2. As shown, the flux density in the generator pole shoes is about 1.2 Tesla in no-load condition.
3- Simulation of the internal faults
3- 1- TTFS
In this section, various TTFs are simulated on FEM model of the machine to generate distorted voltage waveforms. The generator works in no-load condition, and all the simulated TTFs are selected on the basis of the actual location of the bars installed in the stator slots. Indeed, if two installed bars in one slot belong to one branch of a specified phase, a TTF occurs between them. The TTFs on each branch of the stator winding and their associated possible number of occurrence are listed in Table II. These TTFs are named as below,
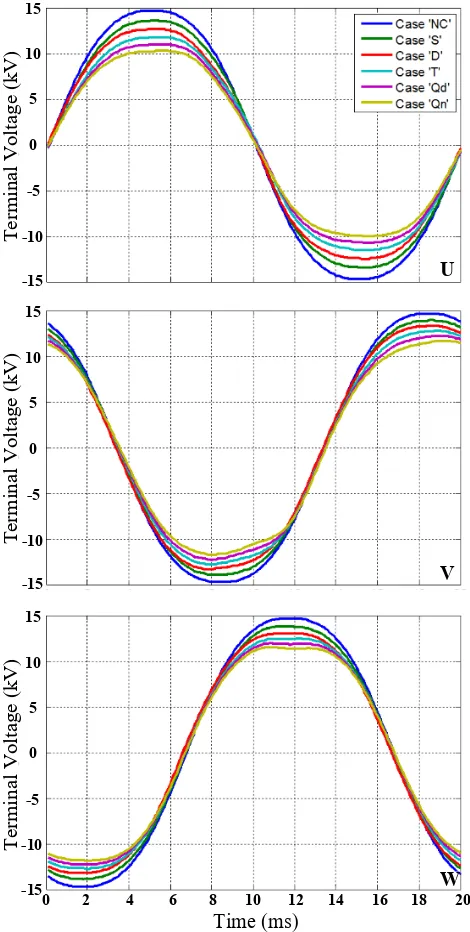
Three phase voltage waveforms for some sample cases are shown in Figure 3. The phase U is considered as the faulty one. As shown, the apparent voltage drop in the faulty phase and the voltage distortion in the healthy ones, all caused by a single TTF, are very small such that the related distortions can be just observed using a digital signal processing algorithm, e.g. DFT or wavelet transform (WT). The increasing of the shorted turns number results in distortion in the faulty phase and the other ones so that such variations can be observed visually.
Harmonic components of the individual three phase voltage waveforms (U, V and W) and their cumulative results as U+V+W (that can be considered as the output of an open delta connected PTs) are used to detect TTFs. Accordingly, ratio of
2nd up to 7th harmonic components to the fundamental one (e.g.
Uh2 / Uh1, Uh3 / Uh1 and so on) are used to train DT. It is noticeable
that only a few of them are required and will be used after DT training while discrimination criteria are selected.
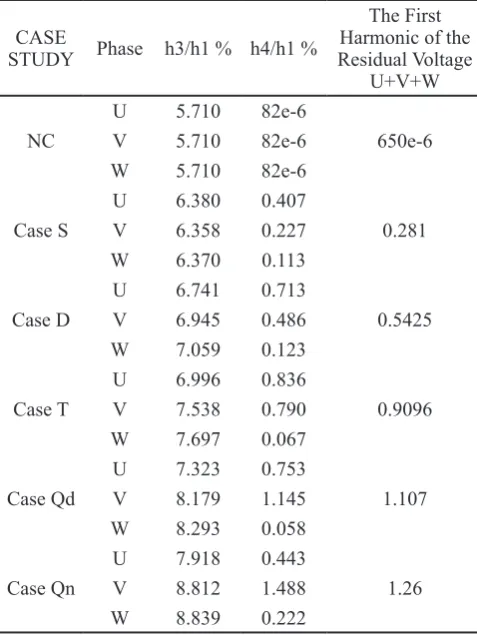
Table III compares the mentioned harmonic contents for the simulated cases while Figure 4 shows them for various TTFs.
It is an important property in these simulations that the results of a specific TTF occurrence on the various paralleled branches in each phase are identical, i.e., the influence of a TTF occurrence in phase U on the healthy adjacent phase
V, indicated by UFVH, is exactly similar to VFWH or
WFUH. Reversely, UFWH, WFVH, and VFUH are
identical. This is due to the exact symmetrical distribution of the three phase bars along the stator circumference. Accordingly, it is possible to train DT with the shifted data in order for detecting and classifying TTFs in the other phases. Similarly, TTFs on the other paralleled circuits in each phase, where these circuits are located sequentially along the stator circumference by two shifting of 120°, result in the similar outputs. Based on the mentioned simulations, run totally 60 times, DT can access to any TTF data that may occur.
Stator Inner
Diameter 4500 mm MVA Rating 300
Stator Outer
Diameter 5770 mm Voltage Rating 18 kV
Stator Height 3041 mm Current Rating 9642 A
Number of Slots 180 Nominal p.f. 0.9
Winding Type Two Layers Bars Rotation Speed 500 rpm
Number of Phases 3 Frequency 50 Hz
Number of
Parallel Circuits 3 Excit . Voltage Rating 230 V
Winding Pitch 13 Excit . Current Rating 2157 A
Turns/Circuit 20 Number of Poles 12
Grounding Transformer
Turns Ratio 10392/500
Rotor Outer
Diameter 4398 mm
Ground Resistance at the
Secondary Side 1.98W
Shaft Outer
Diameter 2300 mm
Air Gap Length 51 mm
Table 1. Specifications of simulated salient pole synchronous generator
Fig. 1. A section of simulated synchronous generator
Fig. 2. Flux density distribution in a cross section of the generator in no-load condition in Maxwell software
environment
Table 2. Number of possible ttfs on each branch
TTF type Number of Possible Cases
Single Turns 20
Double TTF 16
Triple TTF 12
Quadruple TTF 8
Quintuple TTF 4
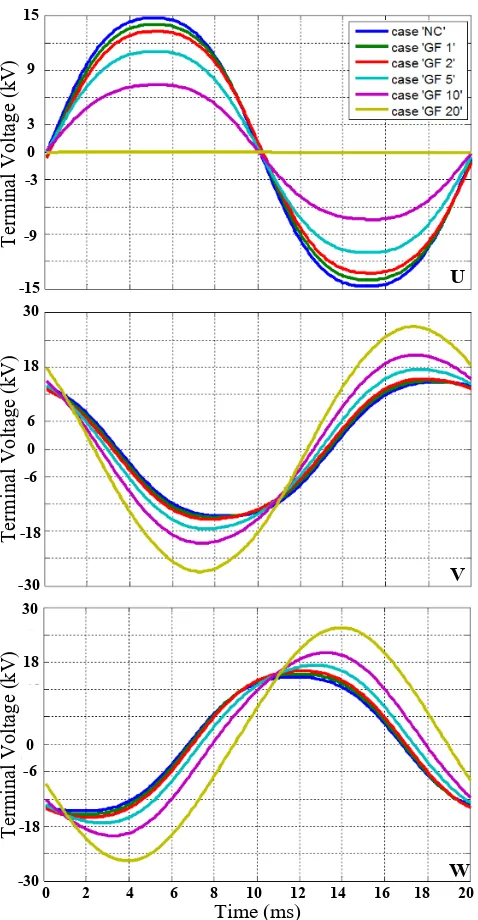
Various PGFs are simulated on the machine FEM model to generate the distorted voltage waveforms. The generator works in no-load condition and all the simulated faulty cases are selected on the basis of the actual location of the bars installed in the stator slots. The total number of possible simulations to apply PGFs on the stator winding is sixty in each branch/phase. Three phase voltage waveforms for some cases are shown in Figure 5. As shown, the apparent voltage drop and the voltage distortion during PGF occurrence on the single or double first turns (close to neutral) are very small. Increasing the number of the faulty turns intensifies the related distortions and voltage drops.
Again, individual single phases and their cumulative results as U+V+W are used to achieve the main goal. Percentages of the second up to the seventh harmonic components related to the fundamental frequency component are used to train DT while the suitable ones are selected after training DT.
As the case studies, some PGFs on the first branch of phase U are simulated (totally 20 cases), of which some can be considered as:
• PGF on the first turn of the winding in the vicinity of the neutral point, i.e. %5 of winding as ‘PGF 1’;
• PGF on the second turn of the winding, i.e. 10% of the winding as ‘PGF 2’;
• PGF on the fifth turn of the winding, i.e. 25% of the winding as ‘PGF 5’;
• PGF on the middle of the winding, i.e. 50% of the winding as ‘PGF 10’;
• PGF on the 20th turn of the winding, i.e. on the generator terminal (%100 of the winding) as ‘PGF 20’.
Table IV compares harmonic contents for the above-mentioned cases. Figure 6 shows them, individually, during the above PGFs.
Time (ms)
0 2 4 6 8 10 12 14 16 18 20 15
10
5
0
-5
-10
-15 15
10
5
0
-5
-10
-15 15
10
5
0
-5
-10
-15
Terminal Voltage
(kV
)
Terminal Voltage
(kV
)
Terminal Voltage
(kV
)
U
V
W
Fig. 3. Three phase voltage waveforms in no-load condition (NC) and some TTFs.
Fig. 4. Percentage variations of the third (top), the fourth (mid) harmonic components, and the fundamental component of residual voltage (down) during various TTFs (related to the
As mentioned before, it is possible to train DT with the proper shifted data to detect and identify the PGF location in other phases. Similarly, since PGF occurrence on the other paralleled circuits in each phase results in the similar outputs, DT can access to any PGF data achieved from the mentioned simulations.
4- Extraction of the appropriate harmonic components
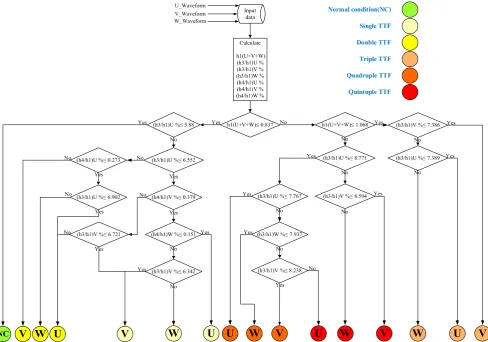
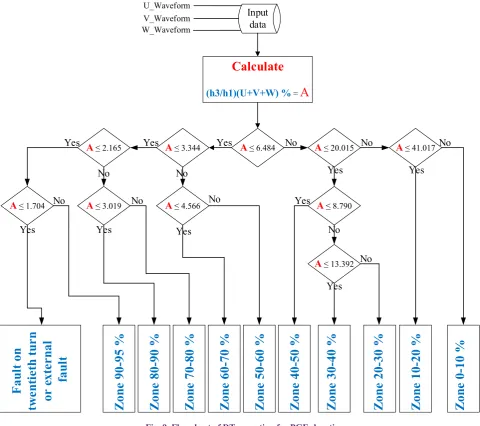
In order to obtain useful harmonic components for detection, classification, and identification of the faulty region (TTFs and PGFs), DT algorithm is trained by the various internal fault harmonic components and the healthy terminal voltage waveforms. The best values of the components are selected by DT at the highest decision branches as the main classification criteria , while 70% of the data are used to train DT and 30% of them are employed to test it. DT mechanisms to achieve such detector and classifier for TTFs and PGFs are shown in Figure 7 and Figure 8, respectively. Also, DT mechanism to identify
PGF location is shown in Figure 9. As shown, the third and fourth harmonics of the individual voltage waveforms and the first harmonic of the residual voltage (U+V+W) are selected by DT to achieve TTFs detection and classification. Also, the third harmonics of the individual voltage waveforms is selected by DT to detect and classify PGFs, while the third harmonic of the residual voltage (U+V+W) is selected by DT to identify PGF location.
5- Analysis of results
The results of the proposed algorithm for the simulated TTFs and PGFs are summarized in Table V and Table VI, respectively. These tables show that:
a) for TTFs
• All the possible TTFs can be detected with the accuracy of 100%;
• The number of shorted turns in TTFs can be classified with the accuracy of about 100%;
Fig. 5. Three phase voltage waveforms for no-load condition and some PGFs.
Fig. 6. Percentage variations of the third harmonic components for individual voltages (top) and the residual voltage by
considering ‘NC’ case (mid) and without it (down). Time (ms)
0 2 4 6 8 10 12 14 16 18 20 15
9
3 0 -3
-9
-15 U
V
W
Terminal Voltage
(kV
)
30
18
6 0 -6
-18
-30
Terminal Voltage
(kV
)
30
18
6 0 -6
-18
-30
Terminal Voltage
(kV
)
• The related faulty phase can be determined by the accuracy of about 99%.
b) For PGFs
• All of the possible PGFs can be detected with the accuracy of 100%;
• The related faulty phase can be determined by the accuracy of about 100%.
• The location of PGF can be identified with the accuracy of 100%,
As seen above, a total accuracy of 99.64% is obtained for TTF detection and classification, and 100% for PGF detection, classification, and region identification.
6- Conclusion
In this paper, an analytical method is proposed to detect, classify, and locate the internal faults, namely phase-to-ground faults and turn-to-turn faults, in the stator winding of synchronous generators based on harmonic components of the terminal voltage waveforms. To this end, an actual 300MVA, 18 kV, 12 poles hydroelectric synchronous generator is simulated using FEM in Maxwell software environment, and DT is employed to extract the proper harmonic components. It is shown that using the third and the fourth harmonic components of the individual terminal voltage waveforms and the fundamental component of the residual voltage waveform, not only all the turn-to-turn faults are detectable but also the faulty phase can be determined by an accuracy of about 99%. Additionally, the number of the shorted turns can be determined precisely. Also, all PGFs in stator winding can be detected, classified, and located with the third harmonic
components of the individual terminal voltage waveforms and the third component of the residual voltage waveform. In the presented simulations, all the machine parameters, such as magnetic hysteresis, core saturation, winding distribution, CASE
STUDY Phase h3/h1 % h4/h1 %
The First Harmonic of the Residual Voltage
U+V+W
NC
U 5.710 82e-6
650e-6
V 5.710 82e-6
W 5.710 82e-6
Case S
U 6.380 0.407
0.281
V 6.358 0.227
W 6.370 0.113
Case D
U 6.741 0.713
0.5425
V 6.945 0.486
W 7.059 0.123
Case T
U 6.996 0.836
0.9096
V 7.538 0.790
W 7.697 0.067
Case Qd
U 7.323 0.753
1.107
V 8.179 1.145
W 8.293 0.058
Case Qn
U 7.918 0.443
1.26
V 8.812 1.488
W 8.839 0.222
CASE
STUDY Phase h3/h1 % the Residual Voltage (%)The Third Harmonic of
NC U 5.710 411900 V 5.710 W 5.710 PGF 1 U 5.870 107.11 V 5.550 W 5.357 PGF 2 U 5.828 50.65 V 5.107 W 4.862 PGF 5 U 5.763 17.81 V 3.853 W 3.917 PGF 10 U 6.056 6.91 V 2.620 W 2.775 PGF 20 U 9.000 1.50 V 1.131 W 1.497
Table 3. Percentage variations of third and fourth harmonics in three phases and first harmonic component of residual voltage
(summation of three phase voltages) for various ttfs
Table 5. Dt accuracy for ttf detection and classification in the stator winding.
Table 6. Dt accuracy for pgf detection, classification and region identification in the stator winding.
Table 4. Percentage variations of harmonics and third harmonic component of residual voltage (summation of three
phase voltages) for various pgfs.
Obtained
Accuracy for (133 samples)Train (51 Samples) CumulativeTest Fault
Detection 100% 100% 100%
Phase
Identification 100% 96.07% 98.91% TTFs
Classification 100% 100% 100%
Total Performance Accuracy 99.64%
Obtained
Accuracy for (133 samples)Train (51 Samples) CumulativeTest Fault
Detection 100% 100% 100%
Phase
Identification 100% 100% 100%
PGFs
Location 100% 100% 100%
Input data
Calculate
h1(U+V+W) (h3/h1)U % (h3/h1)V % (h3/h1)W % (h4/h1)U % (h4/h1)V % (h4/h1)W %
h1(U+V+W)≤ 0.837 U_Waveform
V_Waveform W_Waveform
(h3/h1)U %≤ 5.88 Yes No h1(U+V+W)≤ 1.068
Yes
(h3/h1)U %≤ 6.552 No
(h4/h1)V %≤ 0.379 Yes
(h4/h1)W %≤ 0.151
(h3/h1)V %≤ 6.342 Yes
Yes
No
Yes
No (h3/h1)V %≤ 6.721
No
No
Yes
(h4/h1)U %≤ 0.273 No
(h3/h1)U %≤ 6.902 Yes No
(h3/h1)V %≤ 7.386 Yes
(h3/h1)U %≤ 7.389 No
Yes
Yes
No (h3/h1)U %≤ 8.771
No
(h3/h1)V %≤ 8.594 No
No
Yes (h3/h1)U %≤ 7.767
Yes
Yes
(h3/h1)W %≤ 7.937 No
Yes
(h3/h1)V %≤ 8.238 No
Yes No Yes
No
Normal condition(NC)
Single TTF
Double TTF
Triple TTF
Quadruple TTF
Quintuple TTF
V U
W
V W U U W V U W V W U V
NC
Fig. 7. Flowchart of DT operation for TTFs detection and classification
Fig. 8. Flowchart of DT operation for PGFs detection and classification Input
data
Calculate (h3/h1)U % (h3/h1)V % (h3/h1)W %
(h3/h1)W %≤ 5.563 U_Waveform
V_Waveform W_Waveform
(h3/h1)U %≤ 5.515 Yes No (h3/h1)U %≤ 5.632
NC
Normal
Condition
Faulty
Phase
NC
NoYes
W
U
V
Yespoles saliency, and air gap irregularity, magnetic nonlinearity (core saturation), stator edge (slot-teeth), bars dimensions and even insulation between them, flux distortion in the faulty phase and its effect on the other healthy phases are considered for the FEM algorithm in Maxwell software, based on Fuji technical documents, plans, and data sheets. Therefore, we assert that a comprehensive and precise model is used for internal faults simulations.
REFERENCES
[1] B. Ravindranath, M. Chander, Power system protection
and switchgear, New Age International, 1977.
[2] M. Fayazi, F. Haghjoo, Turn to turn fault detection and
classification in stator winding of synchronous generators based on terminal voltage waveform components, in: Power Systems Protection and Control Conference (PSPC), 2015 9th, IEEE, 2015, pp. 36-41.
[3] ABB Lecture, “Generator and Transformer Protection”,
3rd Edition, 1998.
[4] K. Louie, A new accurate phase-domain synchronous
generator model for transient simulation, in: Electrical and Computer Engineering, 2006. CCECE’06. Canadian
Conference on, IEEE, 2006, pp. 2245-2248.
[5] D.D.S. Muthumuni, E. Dirks, Internal fault simulation
in synchronous machines, in: Electrical and Computer Engineering, 2000 Canadian Conference on, IEEE, 2000, pp. 1202-1206.
[6] A. Megahed, O. Malik, Simulation of internal faults in
synchronous generators, IEEE Transactions on Energy Conversion, 14(4) (1999) 1306-1311.
[7] A. Megahed, O. Malik, Synchronous generator internal
fault computation and experimental verification, IEE Proceedings-Generation, Transmission and Distribution, 145(5) (1998) 604-610.
[8] P. Subramaniam, O. Malik, Digital simulation of a
synchronous generator in direct-phase quantities, in: Proceedings of the Institution of Electrical Engineers, IET, 1971, pp. 153-160.
[9] D. Muthumuni, P. McLaren, E. Dirks, V. Pathirana, A
synchronous machine model to analyze internal faults, in: Industry Applications Conference, 2001. Thirty-Sixth IAS Annual Meeting. Conference Record of the 2001 IEEE, IEEE, 2001, pp. 1595-1600.
Input data
Calculate
(h3/h1)(U+V+W) % =
A
A≤ 6.484 U_Waveform
V_Waveform W_Waveform
A≤ 3.344 Yes No A≤ 20.015 No
Yes
Yes No A≤ 2.165
A≤ 8.790
A≤ 4.566
A≤ 41.017
A≤ 1.704 A≤ 3.019
Yes
No
A≤ 13.392
No No Yes Yes Yes No No Yes No Yes No Yes
Zon
e
0-10
%
Zon
e
10
-20
%
Zon
e
20
-30
%
Zon
e
30
-40
%
Zon
e
40
-50
%
Zon
e
50
-60
%
Zon
e
60
-70
%
Zon
e
70
-80
%
Zon
e
80
-90
%
Zon
e
90
-95
%
Fau
lt on
twe
nt
ie
th t
ur
n
or
exte
rn
al
fau
lt
[10] X. Tu, L.-A. Dessaint, M. El Kahel, A.O. Barry, A new model of synchronous machine internal faults based on winding distribution, IEEE Transactions on Industrial electronics, 53(6) (2006) 1818-1828.
[11] S. Hemmati, S. Shokri, S. Saied, Modeling and simulation of internal short circuit faults in large hydro generators with wave windings, in: Power Engineering, Energy and Electrical Drives (POWERENG), 2011 International Conference on, IEEE, 2011, pp. 1-6.
[12] A. Dehkordi, A. Gole, T. Maguire, P. Neti, A real-time model for testing stator-ground fault protection schemes of synchronous machines, in: International Conference on Power Systems Transients (IPST2009), 2009.
[13] A. Sinha, D. Vishwakarma, R. Srivastava, Modeling and simulation of internal faults in salient-pole synchronous generators with wave windings, Electric Power Components and Systems, 38(1) (2009) 100-114.
[14] X. Tu, L.-A. Dessaint, M. El Kahel, A. Barry, Modeling and experimental validation of internal faults in salient pole synchronous machines including space harmonics, Mathematics and Computers in Simulation, 71(4) (2006) 425-439.
[15] A. Sinha, D. Vishwakarma, R. Srivastava, Modeling and Real-time Simulation of Internal Faults in Turbogenerators, Electric Power Components and Systems, 37(9) (2009) 957-969.
[16] X. Tu, L.-A. Dessaint, N. Fallati, B. De Kelper, Modeling and real-time simulation of internal faults in synchronous generators with parallel-connected windings, IEEE Transactions on Industrial Electronics, 54(3) (2007) 1400-1409.
[17] H. Jiang, R. Aggarwal, G. Weller, S. Ball, L. Denning, A new approach to synchronous generator internal fault simulation using combined winding function theory and direct phase quantities, (1999).
[18] X. Wang, Y. Sun, B. Ouyang, W. Wang, Z. Zhu, D. Howe, Transient behaviour of salient-pole synchronous machines with internal stator winding faults, IEE Proceedings-Electric Power Applications, 149(2) (2002) 143-151.
[19] P. Le-Huy, C. Larose, F. Giguère, Flexible Phase-Domain Synchronous-Machine Model with Internal Fault for Protection Relay Testing and related Real-Time Implementation Issues, in: International Conference on Power Systems Transients (IPST2011), 2011.
[20] M. Rahnama, J. Nazarzadeh, Synchronous machine modeling and analysis for internal faults detection, in: IEEE International Conference on Electric Machines & Drives (IEMDC’07), 2007.
[21] N. Yadaiah, N. Ravi, Statistical method for fault detection in synchronous generators, in: Computer Communication and Informatics (ICCCI), 2012 International Conference on, IEEE, 2012, pp. 1-4.
[22] A. Dehkordi, D. Ouellette, P. Forsyth, Protection testing of a 100% stator ground fault using a phase domain synchronous machine model in real time, (2010).
Please cite this article using:
M. Fayazi and F. Haghjoo, Internal Fault Detection, Location, and Classification in Stator Winding of the Synchronous Generators Based on the Terminal Voltage Waveform, AUT J. Elec. Eng., 49(2)(2017)205-214.