DOI: 10.22075/JRCE.2018.13348.1242
journal homepage: http://civiljournal.semnan.ac.ir/
Damage Identification of Structures Using
Second-Order Approximation of Neumann Series Expansion
S. S. Kourehli1*
1. Department of Civil Engineering, Azarbaijan Shahid Madani University, Tabriz, Iran
Corresponding author:[email protected]
ARTICLE INFO ABSTRACT
Article history:
Received: 10 December 2017 Accepted: 12 June 2018
In this paper, a new method proposed for structural damage detection from limited number of sensors using extreme learning machine (ELM). One of the main challenges in structural damage identification problems is the limitation in the number of used sensors. To address this issue, an effective model reduction method has been proposed. To condense mass and stiffness matrices, the second-order approximation of Neumann series expansion (NSEMR-II) has been used. Mode shapes and frequencies of damaged structures and corresponding generated damage states used as input and output to train extreme learning machine, respectively. To show the effectiveness of presented method, three different examples consists of a truss structure, irregular frame and shear frame have been studied. The obtained results show the ability of the proposed approach in identifying and estimating different damage cases using limited numbers of installed sensors and noisy modal data.
Keywords: Damage Detection, Limited Sensors,
Neumann Series Expansion, Mode Shape.
1. Introduction
Identification of damage in structures has received increasing attention in the last few decades. One of the many nondestructive evaluation approaches is based on the change of vibration parameters with a change in the structural properties [1].
One of the main challenges in structural damage identification problems is the limitation in the number of used sensors. To address this issue, different model reduction
data. Also, Rasouli et al. [7] used Guyan’s static reduction method and particle swarm evolutionary algorithm to detect damage in structures. Also, some researchers used the mode shape expansion approaches for structural damage detection [8]. Ghannadi et al. [9] developed a novel method for damage identification based on expanded mode shape data and artificial neural network. To expand mode shapes, SEREPa expansion method has been used. In this study, space truss and plane truss used to show the effectiveness of presented method.
Nowadays, different learning machines (LM) have been used to identify damage in structures. Most of these methods used modal data or static responses of structures as input data to predict damage existence and severity as output. Recently, Djemana et al. [10] developed a damage identification method using extreme learning machine (ELM). In this paper, piezoelectric sensors have been used. Results showed that ELM can be used as a tool to predict of a single damage in structures. The obtained results reveal that ELM is an effective tool to identify structural damages. Also, Gökdağ [11] presented a method to identify crack in beams under moving vehicle. In this paper an objective function formulated using dynamic responses of beam structures and solved by the particle swarm optimization (PSO). The results reveal that the proposed method can predict cracks with depth ratio of 0.1. Also, different optimization techniques have been proposed in recent years to detect damage in structures [12-14]. Hoseini vaez et al. [15] used wavelet transform to identify damages in Koyna dam. Also, Hoseini vaez et al. [16] proposed a damage identification approach in post-tensioned slab using 2D wavelet transforms. Also, bagheri et al. [17] used discrete wavelet analysis to detect damage in structures under
earthquake excitation. In other work, Yazdanpanah et al. [18] presented a damage identification method based on new damage indicator. Results show a better performance of proposed indicator in comparison with other indicators. Also, Naderpour and Fakharian [19] identified modal parameters of structures using wavelet packet transform and peak picking method. Kourehli [20] used modal data of damage plate structures as input and damage states as output to train ELM. To show the performance of the presented method, a cantilever and a plate with four-fixed have been used. Also, Kourehli [21] used artificial neural network and the Guyan reduction method to identify damages. Recently, Ghadimi et al. [22] presented a novel approach to predict cracks in beam structures using ELM.
In this paper, a new structural damage identification method is presented based on limited number of sensors data and ELM. In this approach, NSEMR-II is used to condense mass and stiffness matrices, while ELM is used to predict damage. The evaluate the effectiveness of proposed method, three different examples, namely a truss bridge, frame structure and 15-story shear frame containing single damage or several damages have been used. The obtained results reveal that the proposed method is viable method to identify structural damages.
2. Neumann series Expansion-Based
Model Reduction
used to reduce the finite element model. The background of NSEMR-II approach is briefly summarized in the following.
The analytical model of a given structure can be divided to master and slave DOFs as follows
[𝐾𝑚𝑚 𝐾𝑚𝑠 𝐾𝑠𝑚 𝐾𝑠𝑠] {
𝜙𝑗𝑚 𝜙𝑗𝑠} =
𝜆𝑗[
𝑀𝑚𝑚 𝑀𝑚𝑠
𝑀𝑠𝑚 𝑀𝑠𝑠] { 𝜙𝑗𝑚
𝜙𝑗𝑠} (1)
where the superscripts “m” and ‘‘s” denote the master and slave DOFs, respectively. So, the reduced mass (𝑀𝑟) and stiffness (𝐾𝑟) matrices based on NSEMR-II can be expressed as [24]: 𝑀𝑟 = 𝑇𝑇M T (2)
𝐾𝑟 = 𝑇𝑇K T (3)
Where 𝑇 = [ 𝐼 −[𝐵1+ 𝐾𝑠𝑠−1𝑀𝑠𝑠(𝐴1𝐴4+ 𝐴1𝐴5)] −1 × [𝐵2+ 𝐾𝑠𝑠−1𝑀𝑠𝑠(𝐴1𝐴2+ 𝐴1𝐴3)] ] (4)
and 𝐴1 = 𝐾𝑠𝑠−1𝑀𝑠𝑠𝐾𝑠𝑠−1𝐾𝑠𝑚𝑀𝑚𝑚−1 (5)
𝐴2 = 𝐾𝒎𝒎𝑀𝒎𝒎−1𝐾𝑚𝑚 (6)
𝐴3 = 𝐾𝑚𝑠𝑀𝑠𝑠−1𝐾𝑠𝑚 (7)
𝐴4 = 𝐾𝑚𝑚𝑀𝑚𝑚−1𝐾𝑚𝑠 (8)
𝐴5 = 𝐾𝑚𝑠𝑀𝑠𝑠−1𝐾𝑠𝑠 (9)
𝐵1 = 𝐼 + 𝐴1𝐾𝑚𝑠 (10)
𝐵2 = 𝐾𝑠𝑠−1𝐾𝑠𝑚+ 𝐴1𝐾𝑚𝑚 (11)
In this paper, the NSEMR-II is used to condense mass and stiffness matrices to measured master DOFs.
3. Extreme Learning Machine
(ELM)
The ELM is an extremely fast single-hidden layer feedforward neural network which was originally proposed by Huang et al. [29]. In ELM, the weights of the output layer optimize by Moore-Penrose generalized inverse. The structure of ELM can be seen in Fig. 1. See more details in refs. [22, 29].
Fig. 1.The structure of ELM.
4. Numerical Examples
4.1. Truss Structure
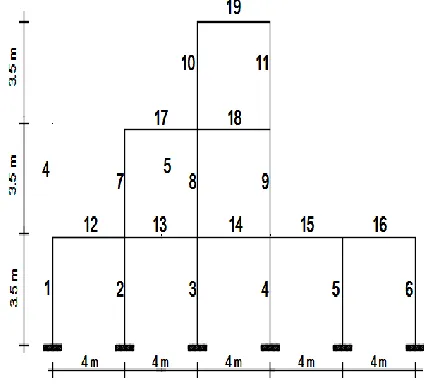
The first example is a plane truss structure with 17 elements and 8 nodes (see Fig. 2). The finite element model of studied structures was simulated by using MATLAB software.
Fig. 2. Plane truss structure.
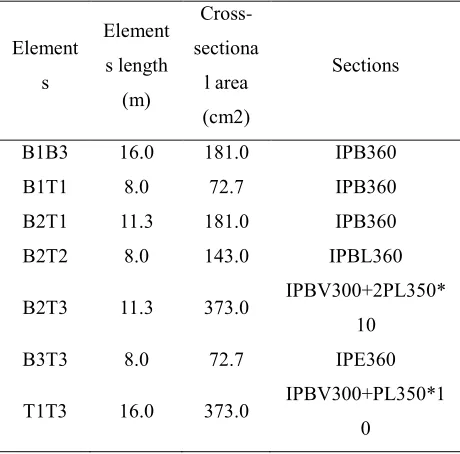
Table 1 shows the characteristics of different elements in studied steel truss bridge structure. In this paper, the first three vibrating modes are utilized for damage detection.
To compare the performance of different model reduction approaches, three different model reduction approaches namely, Guyan’s approach, first-order andNSEMR-II has been studied. Table 2, presented the first ten natural frequencies obtained by various reduction approaches for truss structure. It
can be seen that the NSEMR-II has less errors and is more accurate, which is utilized in this paper.
Table 1. Characteristics of truss elements.
Element s
Element s length (m)
Cross-sectiona
l area (cm2)
Sections
B1B3 16.0 181.0 IPB360 B1T1 8.0 72.7 IPB360 B2T1 11.3 181.0 IPB360 B2T2 8.0 143.0 IPBL360
B2T3 11.3 373.0 IPBV300+2PL350* 10 B3T3 8.0 72.7 IPE360
T1T3 16.0 373.0 IPBV300+PL350*1 0
To evaluate presented method, three different damage cases are considered by reduction in elasticity modulus of truss elements. The considered reduction factors in different truss elements listed in Table 3. As it can be seen from Fig. 2, sensors installed at joints T1, T2, T3, T4, T5 and selected as measured DOFs.
Table 3. Considered reduction factors in different truss elements.
Case 1 Case 2 Case 3 Element
number
Damage ratio
Element number
Damage ratio
Element number
Damage ratio 12 0.1 6 0.2 3 0.2
- - 16 0.1 7 0.2
- - - - 15 0.1
In real cases, the presented approach uses mode shapes and frequencies of the damaged structure in measured DOFs. So, in the numerical examples using the finite element
Table 2. The first ten natural frequencies obtained by various reduction approaches for truss structure. Natural frequencies (Hz) f1 f2 f3 f4 f5 f6 f7 f8 f9 f10 Unreduced damaged model 11.087 15.975 28.716 49.970 63.458 67.732 76.509 91.382 91.815 100.452
Guyan's method 11.144 16.160 29.939 52.987 66.046 74.179 88.795 118.944 206.513 215.519
Guyan's method's errors (%) 0.512 1.157 4.262 6.038 4.078 9.517 16.059 30.162 124.922 114.549
The first order aproxmation 11.088 15.976 28.725 50.230 64.254 68.806 83.631 101.090 107.575 157.033
The first order aproxmation errors (%) 0.006 0.007 0.034 0.520 1.254 1.586 9.310 10.624 17.165 56.326
The second order aproxmation 11.088 15.976 28.719 50.027 63.711 68.043 79.267 91.854 102.117 116.250
The second order aproxmation errors (%) 0.005 0.006 0.011 0.114 0.398 0.459 3.605 0.517 11.220 15.727
To train ELM, incomplete mode shape and frequencies (modal data) of damaged structures used an input and corresponding damage severity (DS) used as output.
Training data consists of modal data of truss structures with different DS values equal to 0%, 10%, 20% and 0, 10 % for elements numbered 2,4,6,8,10,12 and elements numbered 1, 3, 5, 7, 9, 11, 13, 14, 15, 16, 17 respectively. In this case, only 10000 random combinations of the assigned DSs used to train and test ELM. Table 4 show the performance of the ELM for detecting and estimating damage. It can be see that the low values of MSE has been achieved.
Table 4. Performance of the ELM in truss bridge.
Sample
Numbers MSE
Training 9000 5.910E-06
Testing 1000 7.797E-06
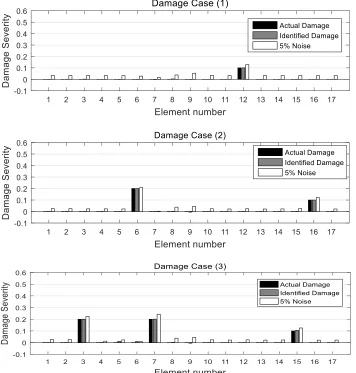
Finally, the effectiveness of the presented approach has been studied using three damage cases. Fig. 3 shows that the presented approach is robust and effective in spite of limited number of measurements which may be noisy data.
4.2. Frame Structure
The second example is an irregular steel frame with 7 column elements, 8 beam elements and 11 free nodes, as shown in Fig. 4. The steel material properties are mass density ρ=7850 kg/m3, elasticity modulus E=200 GPa. For columns, mass per unit length is m=117.75 kg/m, moment of inertia is I=3.310−4 m4, and cross-sectional area is A=1.510−2 m2. while for beams this properties are m=119.32 kg/m, I=3.6910−4 m4 and A=1.5210−2 m2 [31]. In this example, the measured DOFs are 11 translational DOFs to identification of damage in frame structure.
Table 5, presented the first ten natural frequencies obtained by various reduction approaches for frame structure. It can be see that the NSEMR-II is more accurate and utilized in this paper.
Also, the considered reduction factors (DSs) in different frame elements listed in Table 6.
Fig. 3 Obtained results for three different damage cases using noise free data and 5% noisy data in truss structure.
Table 6. Considered reduction factors in frame structure elements.
Case 1 Case 2 Case 3
Element number
Damage ratio
Element number
Damage ratio
Element number
Damage ratio
10 0.1 2 0.2 4 0.1
- - 19 0.1 11 0.2
- - - - 18 0.1
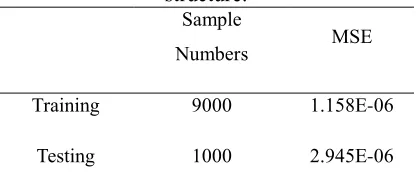
Table 7. Performance of the ELM in frame structure.
Sample
Numbers MSE
Training 9000 1.158E-06
Testing 1000 2.945E-06
Fig. 5 show the performance of the presented method for detecting and estimating damage severities in different elements using only translational DOFs measurements for frame structure which may be noisy data.
Table 5. The first ten natural frequencies obtained by various reduction approaches for frame structure. Natural frequencies (Hz) f1 f2 f3 f4 f5 f6 f7 f8 f9 f10
Unreduced damaged model 11.901 27.032 42.759 81.507 98.516 103.270 106.222 117.252 126.583 132.295 Guyan's method 11.904 27.059 42.802 107.307 202.603 224.161 299.904 368.990 389.269 436.242
Guyan's method's errors (%) 0.028 0.102 0.099 31.653 105.656 117.063 182.336 214.699 207.520 229.750
The first order aproxmation 11.904 27.058 42.799 107.440 116.671 160.047 198.985 209.526 214.299 260.222
The first order aproxmation errors (%) 0.026 0.095 0.094 31.816 18.429 54.980 87.329 78.698 69.295 96.698
The second order aproxmation 11.903 27.055 42.799 83.228 100.720 106.537 119.607 129.951 144.247 163.513
The second order aproxmation errors (%) 0.023 0.086 0.093 2.111 2.237 3.164 12.600 10.831 13.954 23.597
4.3. Fifteen Story Shear Frame
The fifteen story shear frame is shown in Fig. 6. For this case, 8 sensors installed on the 1, 3, 5, 7, 9, 11, 13, 15 stories (see fig. 6). Also, the stiffness and mass in different stories are shown in Table 8.
Fig. 6 15-story shear frame.
Table 8. The characteristics of the shear frame.
Story number Mass (ton) Stiffness (MN m-1)
1-5 50 300
6-10 50 200
11-15 50 100
Table 9, presented the first ten natural frequencies obtained by various reduction approaches for frame structure. It can be seen that the NSEMR-II is more accurate and utilized in this paper.
Fig. 5 Obtained results for three different damage cases using noise free data and 5% noisy data in frame structure.
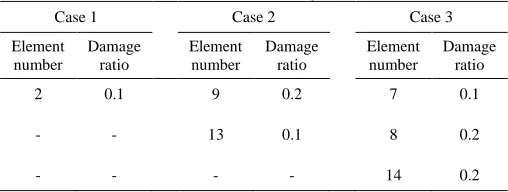
Table 10. Considered reduction factors in different shear frame story’s stiffness.
Case 1 Case 2 Case 3
Element number
Damage ratio
Element number
Damage ratio
Element number
Damage ratio
2 0.1 9 0.2 7 0.1
- - 13 0.1 8 0.2
- - - - 14 0.2
To generate training patterns, DS values equal to 0%, 10%, 20% for elements numbered 1,3,5,7,9,11,13,15 and 0, 10 % for other elements, were considered for every element in the structure. In this case, only
10000 random combinations of the assigned DSs used to train and test ELM. Table 11 shows the low values of MSE in training and testing stages.
Table 11. Performance of the ELM in shear frame.
Sample
Numbers MSE
Training 9000 4.7189E-07
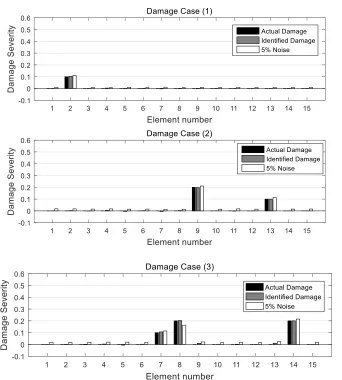
Fig. 7 show that the performance of the proposed approach for detecting and estimating damage severities in different elements using incomplete measurements
noisy data. The obtained results indicate that the proposed approach is promising in identification of different damage cases.
Table 9. The first ten natural frequencies obtained by various reduction approaches for 15-story shear frame.
Natural frequencies (Hz) f1 f2 f3 f4 f5 f6 f7 f8
Unreduced damaged model 1.084 2.751 4.675 6.275 8.205 9.646 11.239 12.232 Guyan's method 1.086 2.780 4.802 6.597 8.641 10.333 12.729 16.684
Guyan's method's errors (%) 0.222 1.061 2.725 5.131 5.312 7.124 13.260 36.392
The first order aproxmation 1.084 2.751 4.676 6.291 8.240 9.779 11.870 16.136
The first order aproxmation errors (%) 0.000 0.001 0.032 0.257 0.427 1.379 5.615 31.909
The second order aproxmation 1.084 2.751 4.675 6.276 8.209 9.694 11.621 15.535
The second order aproxmation errors (%) 0.000 0.000 0.001 0.017 0.042 0.499 3.406 26.996
5. Conclusions
In the presented study, damage identification problem was investigated using extreme learning machine and incomplete measurements. To condense mass and stiffness matrices, the NSEMR-II has been used. The ELM which is an extremely fast learning machine, used to predict damage. The performance of the presented approach was evaluated by using three examples, e.g., a truss structure, irregular frame and 15-story shear frame. Also, the performance of the presented approach has been studied using noisy data (5% noise). Results reveal that the prented approach is robust and promising using sparse sensor measurement and noisy data.
REFERENCES
[1] Fan, W., Qiao, P. (2011). “Vibration-based damage identification approachs: a review and comparative study.” Structural Health Monitoring, Vol.10, pp. 83-111.
[2] Kourehli, S.S. (2015). “Damage quantification approach using artificial neural network and static response with limited sensors.” Journal of Vibroengineering, Vol. 17, pp. 1317-1325. [3] Ghannadi, P., & Kourehli, S. S. (2018).
“Investigation of the accuracy of different finite element model reduction techniques.” Structural Monitoring and Maintenance, Vol. 5, pp. 417-428.
[4] Hosseinzadeh, A.Z., Bagheri, A., Ghodrati Amiri, G. and Koo, K.Y. (2014). “A flexibility-based approach via the iterated improved reduction system and the cuckoo optimization algorithm for damage quantification with limited sensors.” Smart Materials and Structures, Vol. 23, 045019, doi: 10.1088/0964-1726/23/4/045019. [5] Kourehli. S.S., Bagheri, A., Ghodrati Amiri,
G., Ghafory-Ashtiany, M. (2014). “Structural damage identification approach
based on incomplete static responses using an optimization problem.” Scientia Iranica, Vol. 21, pp. 1209-1216.
[6] Li, H., Wang, J. and Hu, SLJ. (2008). “Using incomplete modal data for damage detection in offshore jacket structures.” Ocean Eng. Vol. 35, pp. 1793–9.
[7] Rasouli, A., Ghodrati Amiri, G., Kheyroddin, A., Ghafory-Ashtiany, M. and Kourehli, S.S. (2014). “A New Approach for Damage Prognosis Based on Incomplete Modal Data via an Evolutionary Algorithm.” European Journal of Environmental and Civil Engineering, Vol. 18, pp. 253-270.
[8] Au, FTK., Cheng, Y.S., Tham, L.G. and Bai ZZ. (2003). “Structural damage detection based on a microgenetic algorithm using incomplete and noisy modal test data.” J. Sound Vib., Vol. 259, pp. 1081–94.
[9] Ghannadi, P., & Kourehli, S. S. (2019). “Data-driven method of damage detection using sparse sensors installation by SEREPa.” Journal of Civil Structural Health Monitoring, Vol. 9, pp. 459-475. [10] Djemana, M., Hrairi, M., and Al Jeroudi, Y.
(2017). “Using Electromechanical Impedance and Extreme Learning Machine to Detect and Locate Damage in Structures. “ Journal of Nondestructive Evaluation. Vol. 36, pp. 39.
[11] Gökdağ, H. (2013). “A Crack Identification Approach for Beam-Like Structures under Moving Vehicle using Particle Swarm Optimization.” Materials Testing., Vol. 55, pp. 114-120.
[12] Kaveh, A., Hoseini Vaez, S.R., Hosseini, P. (2017), “Enhanced vibrating particles system algorithm for damage identification of truss structures”, Scientia Iranica, Transactions on Civil Engineering, DOI: 10.24200/SCI.2017.4265
[14] Kaveh, A., Hoseini Vaez, S.R., Hosseini, P., Fallah, N. (2016), “Detection of damage in truss structures using Simplified Dolphin Echolocation algorithm based on modal data”, Smart Structures and Systems, Vol. 18, No. 5, pp. 983-1004.
[15] Hoseini Vaez, S.R., Arefzade, T. (2017), “Vibration-based damage detection of concrete gravity dam monolith via wavelet transform”, Journal of Vibroengineering, Vol. 19, Issue 1, pp. 204 213.
[16] Hoseini Vaez, S.R., Dehghani, E., Babaei, V. (2017), “Damage Detection in Post-tensioned Slab Using 2D Wavelet Transforms”, Journal of Rehabilitation in Civil Engineering, Vol. 5, Issue 2, pp. 25-38.
[17] Bagheri, A., Kourehli, S.S (2013), “Damage detection of structures under earthquake excitation using discrete wavelet analysis” Asian journal of civil engineering (BHRC), Vol. 14, N0. 2., pp. 289-304.
[18] Yazdanpanah, O., Seyedpoor, S. M. and Akbarzadeh Bengar, H. (2015), “A new damage detection indicator for beams based on mode shape data”, Structural Engineering and Mechanics, Vol. 53, pp. 725-744.
[19] Naderpour H. and Fakharian P. (2016), “A synthesis of peak picking method and wavelet packet transform for structural modal identification”, KSCE Journal of Civil Engineering, Vol. 20, Issue 7, pp. 2859–2867.
[20] Kourehli, S. S. (2017). “Application of extreme learning machine to damage detection of plate-like structures. “International Journal of Structural Stability and Dynamics, Vol. 17, 1750068. [21] Kourehli, S.S. (2015). “Damage assessment
in structures using incomplete modal data and artificial neural network.” International Journal of Structural Stability and Dynamics. 15: 1450087. doi: 10.1142/S0219455414500874.
[22] Ghadimi, S., Kourehli, S.S. (2017). “Multiple Crack Identification in Euler Beams Using Extreme Learning Machine.”
KSCE journal of civil engineering , doi: 10.1007/s12205-016-1078-0.
[23] Guyan, R.J. (1965). “Reduction of stiffness and mass matrices.” AIAA journal, Vol. 3, pp. 380-380.
[24] Yang, Q.W. (2009). “Model reduction by Neumann series expansion.” Applied Mathematical Modelling, Vol. 33, pp. 4431-4434.
[25] Sauer, G. (1989). “Iterative improvement of eigensolutions from reduced matrices.” Communications in Applied Numerical Approachs, Vol. 5, pp. 329-335.
[26] Zhang, N. (1995). “Dynamic condensation of mass and stiffness matrices.” Journal of Sound and Vibration, Vol. 188, pp. 601-615.
[27] Bouhaddi, N., Fillod, R. (1996). “Model reduction by a simplified variant of dynamic condensation.” Journal of Sound and Vibration, Vol. 191, pp. 233-250. [28] Pang, J., Dukkipati, R., Patten, W.N. and
Sheng, G. (2003). “Comparative analysis of model-reduction approachs.” International Journal of Heavy Vehicle Systems, Vol. 10, pp. 224-253.
[29] Huang, G.B., Zhu, Q.Y., Siew, C.K. (2006). “Extreme Learning Machine: A New Learning Scheme of Feed forward Neural Networks.” Neurocomputing, Vol. 70, pp. 489-501.
[30] MATLAB. (2015). Matlab user manual. Lowell (MA): Mathwork.