https://doi.org/10.5194/wes-4-465-2019
© Author(s) 2019. This work is distributed under the Creative Commons Attribution 4.0 License.
Field-test of wind turbine by voltage source converter
Nicolás Espinoza and Ola Carlson
Department of Electrical Engineering, Chalmers University of Technology, Gothenburg, 412 96, Sweden
Correspondence:Ola Carlson (ola.carlson@chalmers.se)
Received: 25 April 2018 – Discussion started: 23 May 2018
Revised: 22 May 2019 – Accepted: 24 June 2019 – Published: 9 September 2019
Abstract. One of the main challenges for wind energy development is making wind turbines efficient in terms of costs whilst maintaining safe and reliable operation. An important design criterion is to fulfil the grid codes given by the transmission system operators. Grid codes state how wind farms must perform when connected to the grid under normal and abnormal conditions. In this regard, it is well-known that not all technical require-ments can be tested by using actual impedance-based test equipment. Therefore, test equipment comprising a fully rated voltage source converter in back-to-back configuration is proposed. Thanks to the full controllability of the applied voltage in terms of magnitude, phase and frequency, the use of voltage-source-converter-based test equipment provides more flexibility compared to actual test systems. As demonstrated in this paper, the investigated test device not only can recreate any type of fault, including its recovery ramp, but also can carry out steady-state tests, such as frequency variations and frequency scan, on the test object. Finally, test results from a 4.1 MW wind turbine and 8 MW test equipment located in Gothenburg, Sweden, are shown to validate the investigated grid code test methodology.
1 Introduction
The reliability of the electrical grid depends on how well the generating units, including wind energy systems, are pre-pared to provide support in the case of grid contingencies. In this regard, transmission system operators (TSOs) have specific technical requirements included in their grid codes for connecting wind power plants into the electricity grid. In general terms, a grid code specifies how a generating plant should behave under normal and abnormal grid condi-tions. The continuous increase in electrical energy from wind power injected into the power system has led TSOs to impose ever more stringent requirements on these kinds of plants. It is therefore crucial to develop test methodologies for this type of technology to ensure correct integration of wind en-ergy into electricity grids (Espinoza, 2016).
To evaluate the capability of wind turbines to withstand grid disturbances, tests are currently carried out on the gener-ating unit by using an impedance-based voltage dip generator (Yang et al., 2012). By developing further new test method-ologies, it will be possible to test for grid scenarios other than voltage dips, ensuring reliable and fault-tolerant
opera-tion of the wind turbine system. Furthermore, in the future, wind turbines will be required to participate more actively in regulating the grid (Tsiliand and Papathanassiou, 2009). In this regard, it is well-known that voltage source convert-ers (VSCs) can provide the necessary flexibility to control the terminal voltage as desired. On the other hand, electronic devices have become cheaper and more accessible over the years (Blaabjerg and Ma, 2013). It is therefore natural that future test devices will be partly or fully driven by VSC de-vices. For these reasons, a test run was carried out from Jan-uary 2015 to August 2017 on a 4.1 MW full-power converter (FPC) wind turbine (also known as the “Big Glenn” wind turbine) using fully rated 8 MW VSC-based test equipment.
2 Review of grid code technical requirements
given in Erlich and Bachmann (2005). Finally, control strate-gies developed to meet grid code technical requirements have been documented in Bongiorno and Thiringer (2013), Molina et al. (2007), and Martinez and Navarro (2008).
2.1 Requirements for steady-state condition of the grid
A TSO can require reactive power injection from wind farms to support overall system voltage control during normal grid operation. Usually, reactive power requirements are delim-ited within a minimum power factor range from 0.95 lagging to 0.925 leading, an active power set point of between 0.05 and 1 pu, and within a nominal voltage varying between 0.9 and 1.1 pu.
Reactive power requirements are also dependent on the active power production of the wind farm. For instance, the Danish grid code (ENERGINET, 2010) stipulates dependen-cies between voltage and reactive power and between ac-tive and reacac-tive power production. Both requirements must be complied with simultaneously during normal wind farm operation. Moreover, reactive power injection can be con-trolled, with either a voltage control or power factor control (Tsiliand and Papathanassiou, 2009). An additional option for defining reactive power production is to manually set the reactive power operating point if, for example, a continuous voltage deviation is present at the connection point.
Moreover, grid codes specify the steady-state frequency and voltage operation range within which the wind turbine should operate continuously. For voltages, normal condition is considered to be at 1.0 pu, with a frequency of 50 or 60 Hz. A deviation of approximately ±0.1 pu from the rated volt-age and±0.5 Hz from the rated frequency is also considered a normal condition. Any steady-state grid condition outside these boundaries is defined by a minimum operational time. In some cases, a control action on the active power set point of the wind farm can be requested by the TSOs: e.g. the Dan-ish (ENERGINET, 2010), IrDan-ish (EirGrid, 2015) and German (E.ON, 2006, 2008) TSOs. When active power curtailment is requested in case of frequency deviations, the generation unit must vary its active power output in order to contribute to the overall regulation of the system frequency. In severe cases where the system frequency is outside the frequency opera-tion band, the generating plant is allowed to disconnect.
the European grid code (ENTSO-E, 2016) defines the guide-lines to establish the LVRT profiles in each network within the European Union (EU).
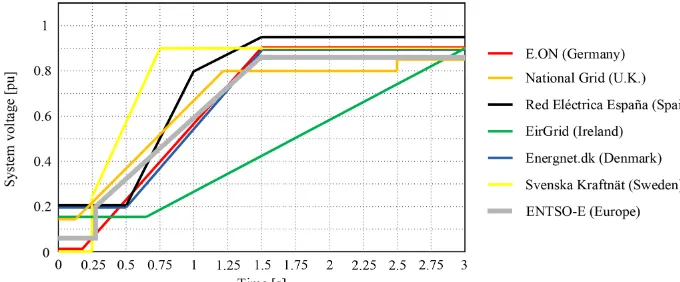
When specified in the grid code, wind parks are required to support voltage restoration by injecting reactive power into the grid. Specifically, the generating plant must provide volt-age support by injecting a specific amount of reactive current depending of the retained voltage at the connection point. For example, the Danish grid code (ENERGINET, 2010) en-forces a specific LVRT with a retained voltage of 0.2 pu per 500 ms, as shown in Fig. 1, and stipulates reactive power sup-port during voltage restoration. Reactive current must be in-jected in a linear fashion when the voltage deviates below 0.9 pu. When the system voltage is lower than 0.5 pu, nomi-nal reactive current must be reached.
2.3 Testing for grid code fulfilment
The IEC 61400-21 standard issued by the International Elec-trotechnical Commission (IEC) defines the methodology for testing part of the technical requirement stipulated in grid codes, particularly for interconnecting wind turbines (IEC 61400-21 ed2.0, 2008). Moreover, specialised test equipment has been developed to fulfil the standard criteria (Yang et al., 2012).
simula-Figure 1.Example of LVRT profiles from the selected grid codes.
tion results, while the effectiveness of actual tests remains undisclosed.
A simple and flexible solution to realise a voltage dip gen-erator is to use two fully rated VSCs in back-to-back configu-ration. By controlling the turbine-side output of the converter system, the effect of all kinds of grid faults can be emulated (Wessels et al., 2010). Thanks to the full controllability of the applied voltage in terms of magnitude, phase and frequency, the use of VSC-based test equipment, shown in Fig. 2, pro-vides more flexibility compared to the standard impedance-based test equipment (Espinoza et al., 2013; Ausin et al., 2008). It also brings more advantages in terms of size and weight (Yang et al., 2012; Diaz and Cardenas, 2013). Fur-thermore, the AC grid is decoupled from the test object when conducting the test. This means that, if a proper control strat-egy is implemented for the grid-side VSC of the test equip-ment, grid strength is not a major limitation.
Moreover, the LVRT profile given in the majority of the grid codes can be fully tested, including the recovery ramp (Espinoza et al., 2013). Such precise control allows more test types to be conducted than normally required by grid codes. For example, frequency support capabilities of the test object can be evaluated by conducting a test in which the funda-mental frequency applied at the point of common coupling (PCC) is varied. On the other hand, a frequency character-isation of the wind turbine can be conducted by introduc-ing asynchronous frequency content into the applied voltage while observing the equivalence admittance at the PCC, as demonstrated later in this paper.
Since wind turbine data are not always available, the test equipment can be used to obtain more information from an actual wind turbine system (Espinoza, 2016). By using fully controllable VSC-based test equipment, it is possible to de-termine how well the wind turbine can reject frequency com-ponents other than the fundamental frequency. Thus, the gen-erating unit can be scanned across a wider frequency range in which the wind turbine could interact with other elements already present in the interconnecting grid.
In this regard, frequency scan tests have been carried out using the test device to characterise the input admittance of the wind turbine unit being tested. In this paper, this analy-sis is limited to the sub-synchronous range. The implemen-tation of the controller in the test equipment is discussed in Espinoza (2016).
The main drawback of this technology is that it is more ex-pensive than the standard test device introduced in the previ-ous section. In addition, the control algorithm needed to im-plement such an arrangement of VSC is more complex, while extra attention must be paid when dealing with over-currents due to the use of sensitive power electronics. Moreover, to emulate a grid fault as realistically as possible, the controller which computes the output voltage of the VSC needs to be of high dynamic performance (Lohde and Fuchs, 2009).
3 Description of the test facility
3.1 System layout
The test equipment is an 8 MW back-to-back HVDC station located at the harbour in Gothenburg, Sweden (Göteborg En-ergi AB, 2019). Figure 3 displays the wind turbine itself. The turbine is located at the edge of the land and close to the sea. Most of the time, the wind turbine receives offshore wind from the northern part of Denmark. The station, shown in the upper right corner of Fig. 3, houses the interconnecting equipment shown at the bottom of the figure. A diagram of the wind turbine layout connected to the VSC-based test de-vice, including the VSC, interconnecting filters and coupling transformer, is shown in Fig. 2.
3.2 Description of the VSC-based test system
Figure 2.Single-line diagram of a VSC-based test equipment.
Figure 3.Gothenburg test facility, comprising the 4.1 MW FPC “Big Glenn” wind turbine. The facility houses the back-to-back HVDC station and coupling inductor (back) and AC filters (front).
more inductance (LCL) is placed to remove the harmonic content produced by the VSC itself. This converter controls the AC voltage imposed on the wind turbine system, while the grid-side converter controls the DC-link voltage by ex-changing active power with the interconnecting grid. The test equipment is interfaced with the 10.5 kV grid using again an LCL filter bank and coupling transformer. Finally, the wind turbine and test equipment are connected by a 300 m cable. In this installation, only the phase voltages and three-phase currents at the PCC are sampled by a computer located in the HVDC station control room. The instantaneous active and reactive power are calculated offline.
3.2.1 Control of the grid-side VSC
struc-ture of a typical controller for this type of application can be found in Espinoza (2016).
3.2.2 Control of the turbine-side VSC
A dedicated open-loop voltage control is incorporated in the control algorithm of the turbine-side VSC of the test equip-ment. The output of the controller is the reference value for the VSC terminal voltage. Finally, a PWM modulator is used to compute the switching signals of the converter (Espinoza, 2016).
3.3 Big Glenn wind turbine
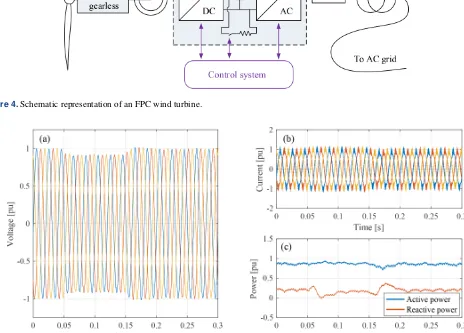
In an FPC wind turbine, the generator is connected to the grid through a full-power rated back-to-back VSC, as shown in Fig. 4. A gearbox is typically used to step up the rota-tional speed when coupling the wind turbine hub with the generator shaft. In a direct-drive configuration similar to that found in Big Glenn (no gearbox in the drive train, allowing direct connection between hub and rotor), a dedicated low-speed multi-pole generator must be used to achieve the de-sired nominal frequency in the stator terminals. The back-to-back VSC is then used to transfer the generated power to the AC grid while allowing enough decoupling thanks to the DC link between the two VSCs in Fig. 4. This configuration allows for an increased fault-tolerant capability of the wind turbine, avoiding severe transients in the generator when a grid fault occurs. Moreover, the grid-side converter of an FPC wind turbine can be designed and controlled to provide addi-tional reactive power support.
The use of fully rated back-to-back VSC for grid inter-connection of wind turbine generators allows a fast response during abnormal grid conditions (Beeckmann et al., 2010; Perdana, 2014). For instance, during a voltage dip, gener-ated power cannot be delivered into the grid due to insuf-ficient grid voltage. In this scenario, the grid-side converter can quickly control the current output, avoiding the feeding of large-magnitude fault currents into the grid. The DC-link capacitor is protected by a DC crowbar. This allows redirec-tion of the produced power into a resistor, providing fast DC over-voltage protection.
The wind turbine under test is rated at 4.1 MVA at 10.5 kV. The stator of the generator, having a voltage rating of 0.69 kV, is directly connected to the back-to-back VSC. The generator-side VSC, here operated in torque control mode, injects the generated power into the wind turbine DC-link capacitor. The grid-side VSC controls the DC-link voltage by exchanging active power with the imposed AC grid. A fil-tering stage is placed between the VSC and the LV side of the wind turbine transformer in order to reduce the harmonic content injected into the electricity grid.
Finally, the output transformer of the wind turbine, with an impedance of 0.06 pu, steps up the voltage from 0.69 to 10.5 kV. Information about wind turbine control during faults
can be found in Espinoza (2016), Perdana (2014) and Es-pinoza et al. (2015).
4 Tests results
4.1 Testing for LVRT
One of the first tests carried out on the test facility on 13 Jan-uary 2015 corresponded to a voltage dip at full power produc-tion. The first attempt was to select a relatively small voltage variation, with a smooth transition between normal operation level and retained level. In order to conduct the experiment safely while learning the dynamics of the system, the volt-age was reduced from 1 to 0.9 pu for 100 ms. The results are shown in Fig. 5. In the following and in all plots, a base volt-age of 10.5 kV and base power of 4.1 MVA are used.
The three-phase PCC voltage is shown in Fig. 5. At 0.05 s the voltage is reduced from 1 to 0.9 pu. At 0.15 s the volt-age is brought back to 1 pu. In this test, a stiff ramp rate of 0.2 pu ms−1has been selected for the inception of the voltage dip, while a ramp of 0.01 pu ms−1has been set for the recov-ery. In order to maintain constant power production during the voltage reduction, the generating unit increases the mag-nitude of the current while maintaining a constant power pro-duction, as also depicted in Fig. 5. During the voltage vari-ation, the wind turbine maintains its active power set point, injecting a steady 0.9 pu of active power into the imposed grid. From the figure, it can be observed that the wind turbine does not engage its LVRT control. Thus, the reactive power is only reduced due to the reduction of the voltage across the AC link between the wind turbine and test equipment.
A second test was carried out the same day and during the time in which the wind turbine was still producing nom-inal active power. Here, the voltage was varied from 1 to 0.65 pu for 100 ms with the same ramp rates as previously mentioned. In this test, the LVRT control strategy of the wind turbine was activated during the voltage dip, providing an in-dication of how sensitive fault ride-through thresholds are set in the test object. The results are presented in Fig. 6.
Figure 4.Schematic representation of an FPC wind turbine.
Figure 5.Wind turbine tested for voltage dip at full power production. The figure shows three-phase voltage(a)and current(b), plus active and reactive power output(c).
4.2 Reactive power control during voltage dip
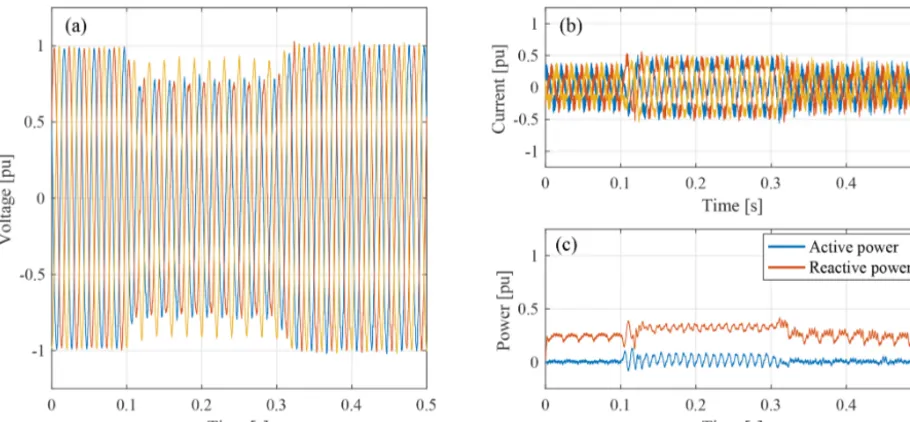
A similar test was carried out on 17 May 2016. Unfortu-nately, the wind turbine was operating at low wind speed. However, the lack of active power produced made the vari-ations in reactive power more prominent, as shown later in this section. This experiment consisted of a voltage varia-tion from 1 pu to 0.75 for about 200 ms. To avoid an os-cillatory response similar to those experienced in the pre-vious experiment, the down-slope ramp of the controlled VSC voltage was set at 0.04 pu ms−1and recovery ramp at 0.0067 pu ms−1. From the voltage waveform given in Fig. 7, it is possible to observe that the voltage is controlled by the test equipment in an effective and smooth way. Moreover, due to reduced slope at dip inception the oscillatory response shown in Fig. 6 was not triggered.
The active power was set to 0.15 pu during this test. The reactive power seen in Fig. 7 at pre-fault is mainly due to the capacitor bank of the local LCL filter placed at the termi-nals of the turbine-side VSC of the test equipment, while the variation observed during the voltage dip is due to the control action of the wind turbine.
Figure 6.Wind turbine tested for LVRT at full power: three-phase voltage(a)and current(b), plus active and reactive power output(c).
Figure 7.Wind turbine tested for LVRT at low power production: three-phase voltage(a)and current(b), and active and reactive power output(c).
A small transient on the reactive power set point can be observed both at fault inception and recovery. This can be at-tributed to the voltage monitoring system and the dynamics of the reactive power controller of the wind turbine – partic-ularly to the wind turbine control action when calculating a reactive current reference based on a varying measured volt-age. Afterwards, the wind turbine resumes normal operation, reducing the current (and therefore the reactive power out-put) to its pre-fault operating point. The system reaches a post-fault steady state at 0.43 s.
4.3 Testing for unbalance voltage dip
Figure 8.Wind turbine tested for unbalanced voltage dip at low power production: three-phase voltage(a), current(b)and active and reactive power output(c).
the measurement point. Moreover, observe from the power plot in Fig. 8 that the reactive power is increased from ap-proximately 0.25 to 0.35 pu. A relatively small oscillation at 100 Hz in both active and reactive power is seen, mainly due to the small negative sequence present in the current.
These last three examples clearly illustrate the response of the wind turbine, particularly the reactive power controller during a balanced and unbalanced voltage dip. Given that the tested wind turbine’s control system is unknown, these results suggest that the controller may also account for the negative sequence whilst still experiencing small oscillations in its output power.
4.4 Impact of the voltage dip in wind turbine converter
A voltage dip applied at the VSC terminals of the test equip-ment drastically affects the wind turbine converter voltage. Moreover, the grid-side VSC controller of the wind turbine will react to the voltage dip measured at the LV side of its step-up output transformer, particularly at the grid-side LCL filter shown in Fig. 4. Although the measured voltage will be somewhat smooth due to the wind turbine transformer impedance and filtering stage, the resulting output current and DC voltage of the back-to-back VSC are controlled in such way that the wind turbine can maintain normal opera-tion when possible. In this regard, the internal signals of the grid-side wind turbine converter are plotted for the case in Fig. 6, and the effect of the voltage dip test is further dis-cussed below.
If the voltage reduction does not dip sufficiently, the wind turbine might have some extra room in its rating to maintain normal power production at a reduced voltage (see Fig. 5). This can be done by increasing the current immediately after
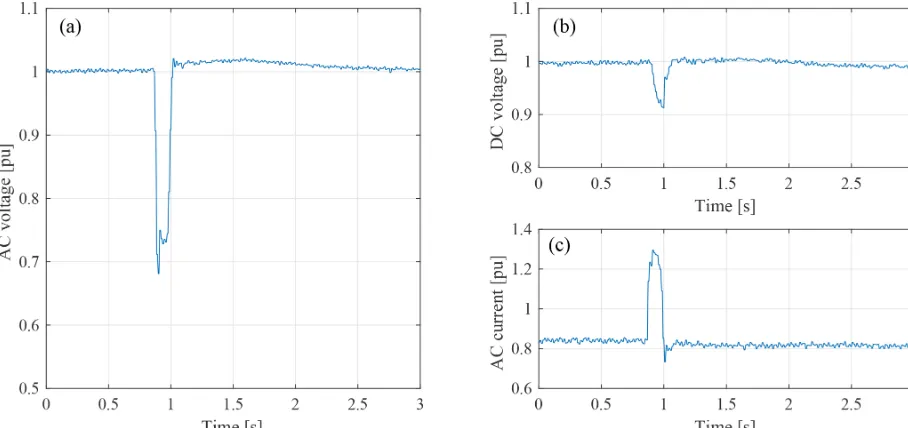
detecting a voltage dip. In this regard, Fig. 9 shows the ef-fect of a voltage dip in the wind turbine converter. The volt-age imposed is measured at 1 pu and is dropped to 0.74 pu for approximately 150 ms. The VSC line current is also plot-ted in Fig. 9 and increases rapidly when the voltage dip is detected at 0.08 s. Its pre-fault value is 0.85 pu and rises to 1.3 pu during the dip.
The DC voltage (also shown in Fig. 9) is dropped during the test. This can be attributed to the rapid increase in wind turbine current, which can be faster than the time constant of the DC link capacitors at the wind turbine converter. This allows a normal power flow during the dip while slightly dis-turbing the DC voltage.
Finally, it is interesting to see the decoupling that exists between the grid-side VSC and the generator-side VSC of the wind turbine. Figure 10 shows the generator torque and speed when the grid voltage experiences a dip. If the conditions are met for the wind turbine VSC response to be smooth, the generator is unaffected. Here, the torque is maintained at a constant 1 pu and the speed is also controlled at 1 pu. This means the wind turbine system is operated at full power. Note that the wind turbine converter has over-current capabilities to maintain a constant power flow during transients.
4.5 Testing for frequency deviation
re-Figure 9.Wind turbine VSC under a voltage dip: AC voltage resulting at the LV side of the wind turbine transformer(a), and DC voltage (b)and AC current magnitude measured at the grid-side VSC(c).
Figure 10.Wind turbine VSC under a voltage dip: generator torque(a)and speed(b).
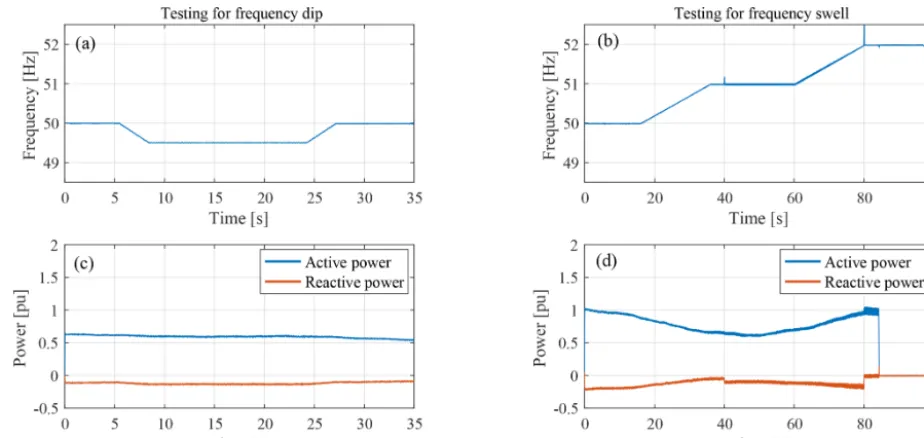
active power curve (shown in red in Fig. 11) has a different value compared to the other case studies shown in this paper. In the following, only the measured frequency and active and reactive power outputs are shown. The first scenario cor-responds to a frequency drop of 0.5 Hz for 15 s. From the first case shown in Fig. 11, it can be observed that the frequency varies with a ramp of 0.2 Hz s−1, or 5 s per varied Hz, for both the drop and recovery of the frequency. According to the Swedish grid code (Svenska Kraftnät, 2005), the wind turbine should maintain its active power production at any given frequency within the specified normal frequency range (i.e. from 49.5 to 50.5 Hz) while varying its output power for frequencies outside this range and ultimately ceasing to op-erate at frequencies outside the full operational range (i.e. 48 to 52 Hz). The lower plot for frequency dip in Fig. 11 shows that the active power is kept constant at 0.7 pu for most of the time during the test. At 30 s, the active power is slightly
reduced, mainly due to variations in wind speed during the test.
The second scenario corresponds to two consecutive fre-quency swells of 1 Hz. The frefre-quency is initially controlled at 50 Hz and varied upwards with a ramp of 0.05 Hz s−1, or 20 s per varied Hz. A frequency of 51 Hz is maintained for approximately 25 s. The frequency is then increased to 52 Hz. The results are shown on the right-hand side of Fig. 11.
Figure 11.Frequency variation test, showing set points of active and reactive power during frequency dip(a, c)and frequency swell(b, d).
power output whilst experiencing an oscillation at roughly 100 Hz. The wind turbine shuts down, via an over-frequency protection relay, 5 s after the frequency reaches 52 Hz, at t=85 s. The different power production levels experienced when conducting the test are also somewhat reflected in the reactive power output of the wind turbine, as seen in the red traces for both scenarios in Fig. 11.
4.6 Frequency scan
Conducting a frequency scan on a wind turbine generator can provide valuable information about how the tested system be-haves across a wider frequency range. This information is vi-tal when analysing the risk of sub-synchronous oscillations, interaction with cables and filter banks or with active devices, such as Static Synchronous Condenser (STATCOM). The in-vestigated method can also provide information for evaluat-ing the stability and performance of large time-constant con-trollers, such as voltage control or power oscillation damping (POD) control installed in a wind energy system.
Firstly, this section shows the frequency scan test carried out on 20 June 2016, when the wind turbine was operating at 0.6 pu power of production. Afterwards, the result of the fre-quency scan test carried out on 17 May 2016, at low power production, is given. The current and voltage are again mea-sured at the HVDC station controlling the voltage applied to the wind turbine. The frequency scan is conducted by adding a voltage component of a magnitude of 0.015 pu (modulated to the frequency being scanned) to the fundamental reference voltage of 1 pu. The measured phase voltage and line cur-rent are evaluated at the frequency of interest and using the methodology given in Espinoza (2016), also reported in Es-pinoza et al. (2016).
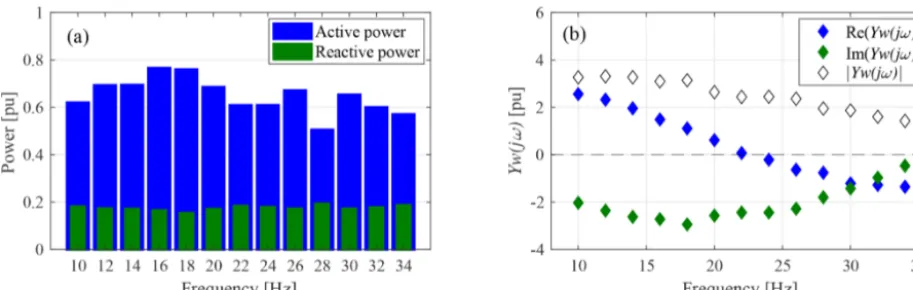
During the scan, the wind turbine changed its operating conditions during each tested frequency. The average power output of the wind turbine is measured at 2.9 MW. However, a wide variation between 2.6 and 3.5 MW was encountered during the test, as shown in Fig. 12a as bars of different height. For each scan at a given frequency, the wind turbine impedanceZw(j ω) is obtained as an average of the phase impedances, while each phase impedance is computed with the corresponding voltage and current vector measured at the frequency of interest and averaged within the sampling pe-riod.
The wind turbine admittance Yw(j ω) can be calculated by the inverse of Zw(j ω). The real and imaginary parts, plus magnitude of the measured phase admittanceYw(j ω), are shown in Fig. 12b as blue and green diamonds respec-tively. The magnitude of the admittance is plotted as white diamonds. The resulting measured points in Fig. 12b sug-gest that the wind turbine presents a positive real part for frequencies below 22 Hz, with a maximum measured value of 2.8 pu at 10 Hz. On the other hand, a relatively high non-passivity behaviour is seen for frequencies above 30 Hz, meaning that the wind turbine could resonate if these fre-quencies are encountered in the network. The minimum value forRe(Yw(j ω)) is−1.5 pu and can be observed at the last scanned frequency of 34 Hz.
ex-Figure 12.Results of frequency scan on the wind turbine operated at 65 % of power production: operating points prior the scan and admit-tance components measured.
Figure 13.Results of frequency scan on wind turbine operated at 5 % of power production: the operating points prior the scan and admittance components measured
hibiting its maximum capacitance in the scanned frequency range. For frequencies above 20 Hz, Im(Yw(j ω)) increases to a maximum of−0.4 pu measured at 34 Hz, corresponding to its minimum capacitance in the sub-synchronous range. Observe, however, that the reactive power set point shown Fig. 12a is kept relatively constant at 0.2 pu (0.9 MVAr) at 50 Hz throughout the test.
The absolute value of the measured wind turbine admit-tance|Yw(j ω)|is also shown in Fig. 12b as white diamonds. Note that the operating point of the wind turbine during each scan impacts not only the amplitude of the admittance but also its vector components. For this reason, the uneven trend of |Yw(j ω)| somewhat matches the variation on the output power of the wind turbine at each scanned frequency.
Finally, a second frequency scan is given in Fig. 13. The test was conducted on a day with very little wind; thus, the wind turbine was operating at low power production. The fig-ure shows the active and reactive power set points at the mo-ment of each test. Moreover, it can be noted that the power flow was dominated mainly by reactive power coming from the filter banks between wind turbine and test equipment, with a measured reactive power of 0.23 pu throughout the
test. The calculated admittance magnitude and its real and imaginary components are also shown in Fig. 13 as white, blue and green diamonds, respectively.
evaluate the performance of the generating unit in further im-proving overall grid reliability. This includes evaluating dif-ferent operating modes of the wind turbine, which can be of interest for the overall stability of the interconnected power system.
Field-test results from the Big Glenn 4.1 MW wind tur-bine and 8 MW test equipment have been included in this pa-per. The tests carried out on the actual wind turbine system included not only balance and unbalanced voltage dips, de-fined by different retained voltage and different ramp rates, but also frequency variation tests and frequency scans. The results show that an LVRT control strategy is implemented in the tested system that injects reactive power when a voltage dip is detected. Moreover, it has been shown that the gen-erating unit maintains smooth control of the reactive power output even during unbalanced voltage dips, at least for low power set points. These results demonstrate that a VSC-based test device can be used to evaluate how well a wind tur-bine system can withstand the technical requirements given in the grid codes.
The multi-megawatt FPC wind turbine system has also been characterised in the sub-synchronous range using the interconnected VSC-based test equipment. The frequency scanning technique has been demonstrated by field-tests, and the input admittance of the generating unit has been eval-uated under two operating conditions. The frequency trend of the scanned turbine exhibits a non-passive behaviour at higher frequencies within the sub-synchronous range while also exhibiting capacitive behaviour throughout the complete scanned range.
The unique field-tests presented in this report have pro-vided an experimental validation of the proposed wind tur-bine testing methodology, particularly on the wind turtur-bine impedance characterisation and on the evaluation of its steady-state and dynamic performance under different grid conditions.
Data availability. Data presented in this work were obtained through several non-disclosure agreements. However, results can be obtained by contacting the authors.
Author contributions. OC organised the research with the 8 MW test equipment. He also organised and took part in the measure-ments. NE prepared the manuscript, took part in the measurements,
the test equipment was done by Göteborg Energi with support from Protrol, among several companies. The tests were performed in col-laboration with Protrol, Göteborg Energi and Chalmers University of Technology. The cooperation is greatly acknowledged.
Financial support. This research has been supported by the Swedish Energy Agency (grant no. 2014-002371, project no. 32591-2), the Västa Götelandsregionen (grant no. RUN 912-0969-14), and the Göteborg Energi AB (grant no. SN06: HVDC-lab).
Review statement. This paper was edited by Joachim Peinke and reviewed by two anonymous referees.
References
Altın, M., Göksu, O., Teodorescu, R., Rodriguez, P., Jensen, B. B., and Helle, L.: Overview of recent grid codes for wind power inte-gration, in: 2010 12th International Conference on Optimization of Electrical and Electronic Equipment (OPTIM), 1152–1160, https://doi.org/10.1109/OPTIM.2010.5510521, 2010.
Ausin, J. C., Gevers, D. N., and Andresen, B.: Fault ride-through capability test unit for wind turbines, Wind Energy, 11, 3–12, https://doi.org/10.1002/we.255, 2008.
Beeckmann, A., Diedrichs, V., and Wachtel, S.: Evaluation of Wind Energy Converter Behavior during Network Faults – Limita-tions of Low Voltage Ride Through Test and Interpretation of the Test Results, in: 9th International Workshop on Large-Scale Integration of Wind Power into Power Systems as well as on Transmission Networks for Offshore Wind Power Plants, Jade Hochschule, 2010.
Blaabjerg, F. and Ma, K.: Future on Power Electronics for Wind Turbine Systems, IEEE J. Em. Sel. Top. P., 1, 139–152, https://doi.org/10.1109/JESTPE.2013.2275978, 2013.
Bongiorno, M. and Thiringer, T.: A Generic DFIG Model for Volt-age Dip Ride-Through Analysis, IEEE T. Energy Conver., 28, 76–85, https://doi.org/10.1109/TEC.2012.2222885, 2013. Diaz, M. and Cardenas, R.: Matrix converter based Voltage Sag
Generator to test LVRT capability in renewable energy sys-tems, in: 2013 8th International Conference and Exhibition on Ecological Vehicles and Renewable Energies (EVER), 1–7, https://doi.org/10.1109/EVER.2013.6521629, 2013.
ENERGINET: Technical regulation 3.2.5 for wind power plants with a power output greater than 11 kW, https://en.energinet.dk/ -/media/BD322E7805694462AB125E5B5D0D79BC.PDF?la= en&hash=DB619E3EAD98AD2F2691CEA0B68BE8B438F4B3FD (last access: 1 August 2019), 2010.
ENTSO-E: ENTSO-E Network Code for Requirements for Grid Connection Applicable to all Generators, available at: https:// www.entsoe.eu/network_codes/rfg/ (last access: 1 August 2019), 2016.
E.ON: Grid Code – High and Extra High Voltage, E.ON Nets GmbH, Bayreuth, Germany, 2006.
E.ON: Requirements for Off-Shore Grid Connection in the E.On Nets Network, E.ON Nets GmbH, Bayreuth, Germany, 2008. Erlich, I. and Bachmann, U.: Grid code requirements concerning
connection and operation of wind turbines in Germany, in: IEEE Power Engineering Society General Meeting 2005, 2, 1253– 1257, https://doi.org/10.1109/PES.2005.1489534, 2005. Espinoza, N.: Wind Turbine Characterization by Voltage Source
Converter Based Test Equipment, Doktorsavhandling PhD The-sis, Chalmers tekniska högskol, Ny serie, no: 4195, Depart-ment of Energy and EnvironDepart-ment, Electric Power Engineering, Chalmers University of Technology, 2016.
Espinoza, N., Bongiorno, M., and Carlson, O.: Grid Code Testing of Full Power Converter Based Wind Turbine Using Back-to-Back Voltage Source Converter System, in: EWEA 2013 Annual Event Conference Proceedings, available at: http://publications.lib. chalmers.se/records/fulltext/174669/local_174669.pdf (last ac-cess: 1 August 2018), 2013.
Espinoza, N., Bongiorno, M., and Carlson, O.: Novel LVRT Testing Method for Wind Turbines Using Flexible VSC Technology, IEEE T. Sustain. Energ., 6, 1140–1149, https://doi.org/10.1109/TSTE.2015.2427392, 2015.
Espinoza, N., Bongiorno, M., and Carlson, O.: Frequency char-acterization of type-IV wind turbine systems, in: 2016 IEEE Energy Conversion Congress and Exposition (ECCE), 1–8, https://doi.org/10.1109/ECCE.2016.7855126, 2016.
EWEA: Wind in Power, 2015 European statistics, The European Wind Energy Association, available at: https://www.ewea.org/fileadmin/files/library/publications/ statistics/EWEA-Annual-Statistics-2015.pdf (last access: 1 August 2019), 2016.
Göteborg Energi AB: Göteborg Wind Lab, available at: http://www. goteborgwindlab.se (last access: 26 June 2017), 2019.
Hu, S., Li, J., and Xu, H.: Comparison of Voltage Sag Gen-erators for Wind Power System, in: APPEEC 2009, Asia-Pacific Power and Energy Engineering Conference 2009, 1–4, https://doi.org/10.1109/APPEEC.2009.4918228, 2009.
IEC 61400-21 ed2.0: Wind turbines – Part 21: Measurement and as-sessment of power quality characteristics of grid connected wind turbines, International Electrotechnical Commission, Germany, 2008.
Lohde, R. and Fuchs, F.: Laboratory type PWM grid emulator for generating disturbed voltages for testing grid connected devices, in: 13th European Conference on Power Electronics and Appli-cations 2009 (EPE’09), 1–9, 2009.
Martinez, I. and Navarro, D.: Gamesa DAC converter: the way for REE grid code certification, in: 13th Power Electronics and Motion Control Conference 2008 (EPE-PEMC 2008), 437–443, https://doi.org/10.1109/EPEPEMC.2008.4635305, 2008. Mohseni, M. and Islam, S. M.: Review of international grid codes
for wind power integration: Diversity, technology and a case for global standard, Renew. Sustain. Energ. Rev., 16, 3876–3890, https://doi.org/10.1016/j.rser.2012.03.039, 2012.
Molina, M., Suul, J. A., and Undeland, T.: A Simple Method for Analytical Evaluation of LVRT in Wind Energy for In-duction Generators with STATCOM or SVC, in: 2007 Euro-pean Conference on Power Electronics and Applications, 1–10, https://doi.org/10.1109/EPE.2007.4417780, 2007.
Perdana, A.: Dynamic Models of Wind Turbines, Chalmers Uni-versity of Technology, Gothenburg, Sweden, available at: http: //www.chalmers.se/ (last access: 26 June 2017), 2014.
Saniter, C. and Janning, J.: Test Bench for Grid Code Sim-ulations for Multi-MW Wind Turbines, Design and Con-trol, IEEE Transactions on Power Electronics, 23, 1707–1715, https://doi.org/10.1109/TPEL.2008.925425, 2008.
Svenska Kraftnät: The Business Agency Svenska kraftnats regula-tions and general advice concerning the reliable design of pro-duction plants, Svenska Kraftnat, 2005.
Tsiliand, M. and Papathanassiou, S.: A review of grid code techni-cal requirements for wind farms, in: IET Renewable Power Gen-eration, 3, 308–332, https://doi.org/10.1049/iet-rpg.2008.0070, 2009.
Wessels, C., Lohde, R., and Fuchs, F.: Transformer based voltage sag generator to perform LVRT and HVRT tests in the laboratory, in: 2010 14th International Power Electronics and Motion Con-trol Conference (EPE/PEMC), Ohrid, Macedonia, 6–8 Septem-ber 2010, https://doi.org/10.1109/EPEPEMC.2010.5606830, 2010.