Journal of Industrial Engineering and Management Studies
Vol. 6, No. 1, 2019, pp. 111-129 DOI: 10.22116/JIEMS.2019.87662
www.jiems.icms.ac.ir
A quantitative model for optimization and disruption mitigation in
a supply chain (Auto parts case study)
Seyed Ali Alavikia1, Mohammad Taghi TaghaviFard2,*, Maghsoud Amiri2, Parham Azimi3
Abstract
However, there is a lot of capital and plenty of manpower in the auto spare part industry, the enterprises and supply chains of this industry do not perform well in our country. This research models a three-level supply chain with multiple manufacturers, distribution centers and retailers, to minimize the total cost by taking into account various disruptions. The database of two active car spare parts companies for five strategic products in one year has been used. Then, the mathematical model is analyzed by considering disruptions based on three different sales policies: back orders, lost sales and outsourcing. Besides, to evaluate the performance of the model some numerical examples are used and analyzed to determine that algorithm works. Model solved efficiently by MATLAB software. The results show that the proposed algorithm of this research can neutralize the effect of the disruptions and cause a significant reduction in total cost of the system. The model is useful for helping decision makers to adopt an active approach to maintaining business benefits when disruptions take place in the supply chain.
Keywords: Optimization model,Fuzzy, Auto parts supply chain, Disruption.
Received: May 2018-30
Revised: January 2019-05
Accepted: February 2019-06
1. Introduction
Iran's automobile industry turnover was $ 25 billion in 1395, including $ 16 billion in domestic production and $ 3 billion in imports of automobiles and related parts, and $ 6 billion in spare parts for after-sales services. (ISNA, 2017) The $ 6 billion annual volume of spare parts represents the position of this sector of the industry. Given today's competitive environment, supply chain management is essential in order to reduce costs, improve customer service and achieve a balance between costs and services, and thereby to give a competitive advantage to a company.
* Corresponding author; [email protected]
1 Faculty of Management & Accounting, Department of Industrial Management, Faculty of Management &
Accounting, Allameh Tabataba’i University, Tehran, Iran.
2 Faculty member, Department of Industrial Management, Faculty of Management & Accounting, Allameh
Tabatabai&rsquo University, Tehran, Iran.
(Fakhrzad & Alidoosti, 2018) Delivering the outputs depends on organization's ability to manage the flow of materials, information, and money inside and outside the organization. This flow is known as the supply chain. In today's competitive market, the supply chain coordination (SCC) has great significance. In the lack of coordination, the SC members optimize their own decisions independently. (Johari, Hosseini-Motlagh, & Nematollahi, 2016) Increasing globalization, the rapid development of technology and the creation of competitive advantages hinder the organization's ability to predict and manage the behavior of supply chain partners. Supply chains may be complex and long and involve a large number of different business partners and their problems and issues are inevitable. Failure to resolve these problems will result in customers' dissatisfaction and loss of sale and impose lots of costs to organizations. Companies in the world-class owe many of their successes to supply chain management, hence the supply chain has become a popular management discourse in recent decades. Since supply chain loops are independent entities of economics, creating a mechanism that can coordinate the activities and objectives of these entities in order to optimize the overall system performance is a key issue in the management of the supply chain. Generally, traditional researches in supply chain focused on making decisions in the ideal conditions, where demand was defined, and the producer had complete information about the market; but in the real world, the complete market information is rarely available and obtaining demand distributions may be hard and even impossible. In the dynamic and complex business environment, uncertainty is considered as an important concern. The demand uncertainty is also an important issue in the science and industry. These uncertainties of demand posed major challenges to supply chain management, leading to a reduction in real income. In order to take uncertainty and its effects into account, it is necessary to pay attention to the sources of uncertainty, which are disruptions or interruptions in all parts of the supply chain.
Many studies have been carried out on the main field of this research, the supply chain; many of the existing studies carried out in this field are qualitative articles, and there aren’t any quantitative modeling issues. (Giannakis, 2011) Although such studies play a major role in explaining new topics or in learning the key concepts, their application is restricted to the above and is less applicable to solving problems that impress competition of supply chains. Qualitative studies with quantitative statistical approaches are another category of research in the supply chain, although these researches have pretended quantitative due to the use of statistical tools, but the principles of research are based on qualitative concepts such as chain performance measurement (Maestrini, Luzzini, Maccarrone, & Caniato, 2017), supply chain culture (Zhi, Baofeng, Yuan, & Xiande, 2015), supply chain interoperability (Veronica , 2013), supply chain stability (Tamplin, 2017), lean supply chain (Kanchan, 2018), agile supply chain (Minkyun & Sangmi, 2017), and so on. Quantitative studies in the supply chain are the third category of research in the supply chain, which the present study is in this category, and attempts to simulate real supply chains and solve problems and concerns of different parts of chains. Due to the extensive research, this section can be divided into three main sub-domains: a) studies focused on demand forecasting and inventory control; b) pricing-focused studies; and c) studies focused on disruptions and uncertainties. Each of these sub-domains also deals with the study of two-level, three-level, and etc. To clarify the perspective of each subcategory, relevant literature is classified.
systems, with emphasis on the concept of "level inventory", which deals with the analysis of the cost function of multilevel systems, is Clarke and Scarf's paper, "Optimal Policies for Multi-Level Inventory Issues". [12] In another study [13], it has been forecasted using the Bayesian network of gasoline in Iran. The model presented in this study has been expanded with the use of annual data for the years 1347-1386 and GDP, vehicle numbers, population and actual price of gasoline. The results of this research show that the Bayesian network has less error than the regression method.
2) Pricing-focused studies, uses concepts such as game theory to find the best pricing strategy. (Aust & Buscher, 2012) (Giri & Sharma, 2014)
3) In studies focused on distortions and uncertainties, the goal is to design supply chain network and develop models that are both acceptable and efficient in both normal and disruptive situations. (Liang & Renbin, 2017) A systematic literature review and a comprehensive analysis of the decision-making models for supply chain risk (SCR) mitigation was also provided by Rajagopal et al. (2017) (Rajagopal, Venkatesan, & Goh, 2017) A review of the literature indicates that most of the available articles ignore the potential for breakdowns and disruptions in the supply chain, and generally assume the demand and supply parameters in a definitive manner. Other research in the literature has often overlooked the severity of the disruption and often focuses solely on complete disruption (Shishebori & Yousefi Babadi, 2015) (Peng,, snyder, Lim, & Liu, 2011) and few studies have focused on minor disruption (Azad, Saharidis, Davoudpour, Maleky, & Yektamaram, 2013); A minor disorder is also modeled definitively in (Azad, Saharidis, Davoudpour, Maleky, & Yektamaram, 2013). There are some gaps in the literature. First, it is clear that most researches focused on supply chain optimization and collaboration problems under ideal conditions, although some studies developed reactive and recovery mitigation models after the occurrence of a sudden disruption. However, no study has been found that predicts the possible changes in future demand that is used as input to the mitigation planning model in supply chain. On the other hand, most past studies focused mainly on a single disruption in production and a very few focused on a series of disruptions on a real-time basis, but they are for a single manufacturer and a retailer, which limits their applicability in real-life situations. In addition, most studies have simplified the chain as a single product. According to the above mentioned, the present research tries to fill the scientific and research gaps by using actual data to present an applicable model.
To fill the gaps in the current literature, this paper attempts to carry out the following novelties in modelling and solution approach:
Our proposed heuristics for reactive mitigation are capable of dealing with following: (i) single occurrence of sudden disruption, (ii) a series of sudden independent disruptions, and (iii) a series of a mix of independent and dependent disruptions.
The three different policies for managing a sudden disruption are considered: Back orders, lost sales and Outsourcing.
Using real data instead of dummy and random numbers to present an applicable actual model. Considering multi-products supply chain instead of a simple single product supply chain. Considering a series of disruptions instead of a single disruption.
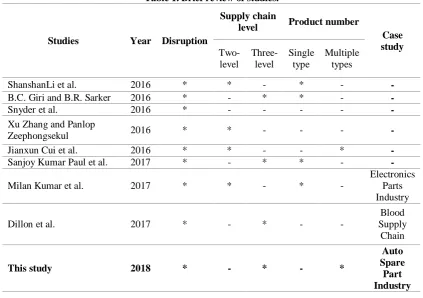
Table 1. Brief review of studies. Case study Product number Supply chain level Disruption Year Studies Multiple types Single type Three-level Two-level - - * - * * 2016
ShanshanLi et al.
- - * * - * 2016
B.C. Giri and B.R. Sarker
- - - - - * 2016
Snyder et al.
- - - - * * 2016
Xu Zhang and Panlop Zeephongsekul - * - - * * 2016
Jianxun Cui et al.
- - * * - * 2017
Sanjoy Kumar Paul et al.
Electronics Parts Industry - * - * * 2017 Milan Kumar et al.
Blood Supply Chain - - * - * 2017 Dillon et al.
Auto Spare Part Industry * - * - * 2018 This study
2. Problem Description
In this research, a three-level supply chain model is developed under ideal conditions for a limited planning time. This ideal program used to determine the cycle length that is supposed to be the length of time required for programming and analysis. The three-level supply chain consists of production factories, distributors and retailers with several parts per level.
For this system, supply chain develops three different approaches. 1- An ideal program for a limited planning time that updates the program if changes are made to data. 2- A preventive avoidance reduction planning approach for managing demand changes that can predict future demand by using an appropriate tool. 3- A program to reduce the impact of a response disruption based on real-time results for managing sudden production disruption. The existence of assumptions in designing all issues in the operation research is very important. The following assumptions have been considered in designing the proposed model for this research:
1. Several independent products (G) are produced in the system and the system is a three-level supply chain system (including multiple producers (I), multiple distributors (J), and several retailers (K))
2. In the reduction of preventive risks, only changes in demand are taken into account. 3. Disruption of production in different manufacturing plants is considered independently. 4. There is no safety stock in the system.
5. The number of turns during the recovery period is determined by the management of the production organization.
6. The demand process is discrete and is based on the Poisson process in every retailer. (The customer demand function is a type of Poisson distribution function.)
7. No horizontal link between retailers is allowed. 8. All retailers are considered the same.
2.1. Notations and parameters
g Product index G Number of Products i Plant index I Number of plants
j DC index J Number of DC
k Retailer index K Number of retailer
The following parameters are used in this study to formulate the mathematical model. 𝐶𝑃̃𝑔𝑖 Maximum production capacity of g in
plant i under ideal conditions OCj Operating cost of DC j 𝐶𝐷̃𝑔𝑖 Maximum handling capacity of DC j SCgi Spare capacity of g in plant i
𝐷̃𝑔𝑘 Demand for g in retailer k tn Start time of disruption at the nth
plant as fraction of period
pgi
Production cost per unit of product g at plant i (currency per unit) Tdn
Disruption duration for the n th plant as fraction of period
H1gi Holding Cost per unit per interval at plant
i (currency per unit per interval) L
Lost sales cost per unit (currency per unit)
H2gj Handling cost per unit of product g at DC
j(currency per unit) B
Back orders cost per unit per period (currency per unit per period)
H3gk
Holding cost per unit of product g per period at retailer k (currency per unit per period)
S Outsourcing cost per unit (currency per unit)
T1gij Transportation cost of product g per unit
from plant i to DC j(currency per unit) M
Number of periods in recovery window
T2gjk Transportation cost of product g per unit
from DC j to retailer k(currency per unit) D
'
gkm Demand for g in retailer k in
period m
The following variables are decision variables.
𝑃𝑔𝑖 production quantity of product g at
plant i 𝑃
′ 𝑔𝑖𝑚
production quantity of product g after disruption at plant i in period m
𝑋𝑔𝑖𝑗 transportation quantity of product g
from plant i to DC j 𝑋
′ 𝑔𝑖𝑗𝑚
transportation quantity of product g from plant i to DC j after disruption in period m
𝑌𝑔𝑗𝑘 transportation quantity of product g from DC j to retailer k 𝑌
′ 𝑔𝑗𝑘𝑚
transportation quantity of product g from DC j to retailer k after disruption in period m
3. Model formulation
In this section, the mathematical model (Paul, Sarker, & Essam, 2017) is developed for both an ideal and a disrupted supply chain system. The ideal plan is updated if there are any changes in the data and is also reviewed according to any prediction of future changes for a finite planning period. In the case of managing a disruption, the model is formulated again to incorporate the effect of a disruption and the production and distribution plan is revised for a finite planning period. After the recovery window, the production and distribution plan reverts to its ideal plan.
3.1. Formulation in ideal plan
inventory, the transportation cost as the unit transportation cost multiplied by the transportation quantity, the total operating cost as the sum of the operating cost of each DC, and the handling cost of distribution is the unit handling cost multiplied by the total handling quantity. Finally, the different costs are summed to obtain the objective function to be minimized subject to capacity, distribution and demand constraints, where decision variables are Pgi , Xgij and Ygjk .
The final model is considered in a constrained programing problem form.
𝑀𝑖𝑛𝑖𝑚𝑖𝑧𝑒: 𝑇𝐶 = 𝑇𝐶𝐹 + 𝑇𝐶𝑊 + 𝑇𝐶𝑅 (1)
𝑇𝐶 = ∑ ∑ 𝑝𝑔𝑖𝑃𝑔𝑖
𝐺
𝑔=1 𝐼
𝑖=1
+1
2∑ ∑ 𝐻1𝑔𝑖𝑃𝑔𝑖
𝐺
𝑔=1 𝐼
𝑖=1
+ ∑ ∑ ∑ 𝑇1𝑔𝑖𝑗𝑋𝑔𝑖𝑗 𝐺
𝑔=1 𝐼
𝑖=1 𝐽
𝑗=1
+ ∑ 𝑂𝐶𝑗 𝐽
𝑗=1
+ ∑ ∑ ∑ 𝐻2𝑔𝑗𝑋𝑔𝑖𝑗
𝐺
𝑔=1 𝐼
𝑖=1 𝐽
𝑗=1
+ ∑ ∑ ∑ 𝑇2𝑔𝑗𝑘𝑌𝑔𝑗𝑘
𝐺
𝑔=1
+1
2∑ ∑ 𝐻3𝑔𝑘𝐷̃𝑔𝑘
𝐺
𝑔=1 𝐾
𝑘=1 𝐽
𝑗=1 𝐾
𝑘=1
(2)
Costs at plant:
Production cost = ∑ ∑ 𝑝𝑔𝑖𝑃𝑔𝑖 𝐺
𝑔=1 𝐼
𝑖=1
(3)
Average holding cost =1
2∑ ∑ 𝐻1𝑔𝑖𝑃𝑔𝑖
𝐺
𝑔=1 𝐼
𝑖=1
(4)
Transportation cost = ∑ ∑ ∑ 𝑇1𝑔𝑖𝑗𝑋𝑔𝑖𝑗 𝐺
𝑔=1 𝐼
𝑖=1 𝐽
𝑗=1
(5)
Costs at DCs:
Operating cost = ∑ 𝑂𝐶𝑗
𝐽
𝑗=1
(6)
Handling cost = ∑ ∑ ∑ 𝐻2𝑔𝑗𝑋𝑔𝑖𝑗 𝐺
𝑔=1 𝐼
𝑖=1 𝐽
𝑗=1
Costs at retailer:
Transportation cost = ∑ ∑ ∑ 𝑇2𝑔𝑗𝑘𝑌𝑔𝑗𝑘 𝐺
𝑔=1 𝐽
𝑗=1 𝐾
𝑘=1
(8)
Average holding cost =1
2 ∑ ∑ 𝐻3𝑔𝑘𝐷̃𝑔𝑘
𝐺
𝑔=1 𝐾
𝑘=1
(9)
Here, P i , X ij and Y jk are decision variables, subject to the following constraints.
𝑃̃𝑔𝑖 ≤ 𝐶𝑃̃𝑔𝑖 ∀𝑖 (10)
𝑃𝑔𝑖 = ∑ 𝑋𝑔𝑖𝑗
𝐽
𝑗=1
∀𝑖 (11)
∑ 𝑋𝑔𝑖𝑗
𝐼
𝑖=1
= ∑ 𝑌𝑔𝑗𝑘
𝐾
𝑘=1
∀𝑗 (12)
∑ 𝑋𝑔𝑖𝑗 𝐼
𝑖=1
≤ 𝐶𝐷̃𝑔𝑗 ∀𝑗 (13)
∑ 𝑌𝑔𝑗𝑘
𝐽
𝑗=1
= 𝐷̃𝑔𝑘 ∀𝑘 (14)
∑𝐼 𝑃𝑔𝑖
𝑖=1
= ∑𝐾 𝐷̃𝑔𝑘
𝑘=1
∀𝑔. 𝑖. 𝑘 (15)
𝑃𝑔𝑖. 𝑋𝑔𝑖𝑗. 𝑌𝑔𝑗𝑘 ≥ 0 ∀𝑔. 𝑖. 𝑗. 𝑘 (16)
Constraint (10) ensures that the number of g products in each plant is smaller or equal to the maximum production capacity of g in that factory. Constraint (11) ensures that the number of g products per plant is equal to the total number of g shipped from the plant to the distributors in addition to the number of safety stock. Constraint (12) ensures that the total number of g products shipped from the factories to the distributors is equal to the total number of g shipped from the distributors to the retailers. Constraint (13) ensures that the total number of g products shipped from the factories to distributors is smaller or equal to the maximum capacity of the number of g products shipped from the factories to the distributors. Constraint (14) ensures that the total number of g products shipped from distributors to the retailer k is equal to the demand of g from retailer k. Constraint (15) ensures that the total quantity of g products produced is equal to the demand of retailers. Constraint (16) The number of g product per plant, the number of products shipped from factories to distributors, the number of products shipped from distributors to retailers, and the number of safety stock are all integers equal to or greater than zero.
3.2. Formulation for disruption mitigation plan
by the cost of sales lost per unit of product in the number of products whose sales have been lost. And the cost of outsourcing is the quantity outsourced products at the cost of purchasing each unit.
If there is a disruption in the nth factory for the duration of Tdn and the start time of tn, the
production loss after a disruption is calculated by the following:
𝐼𝑓: 𝑃𝑛
𝐶𝑃𝑛 > 𝑡𝑛+ 𝑇𝑑𝑛
(17) 𝐷′ = 𝐶𝑃 𝑛 × 𝑇𝑑𝑛− 𝑚𝑖𝑛 {∑ ∑ 𝑆𝐶𝑔𝑖 𝐼 𝑖=1 𝑔 𝑔=1
. ∑ ∑ 𝐶𝑃𝑔𝑖× (1 − 𝑡𝑛− 𝑇𝑑𝑛)
𝐼 𝑖=1 𝐺 𝑔=1 } 𝐼𝑓: 𝑃𝑛
𝐶𝑃𝑛 < 𝑡𝑛+ 𝑇𝑑𝑛
(18) 𝐷′ = 𝐶𝑃 𝑛 × ( 𝑃𝑛 𝐶𝑃𝑛− 𝑡𝑛) − 𝑚𝑖𝑛 {∑ ∑ 𝑆𝐶𝑔𝑖 𝐼 𝑖=1 𝑔 𝑔=1
. ∑ ∑ 𝐶𝑃𝑔𝑖× (1 − 𝑡𝑛− 𝑇𝑑𝑛)
𝐼
𝑖=1 𝐺
𝑔=1
}
If this quantity needs to be filled during the recovery window, we consider back orders, lost sales and outsourcing options so that the total supply chain cost during this time can be minimized.
Productioncost = ∑ ∑ ∑ 𝑝𝑔𝑖𝑃𝑔𝑖𝑚 𝐺 𝑔=1 𝐼 𝑖=1 𝑀 𝑚=1
Average holding cost = ∑ ∑ ∑1
2𝐻1𝑖𝑃′𝑔𝑖𝑚
𝑀 𝑚 𝐺 𝑔=1 𝐼 𝑖=1
Transportation cost = ∑ ∑ ∑ ∑ 𝑇1𝑖𝑗𝑋′ 𝑔𝑖𝑗𝑚 𝐺 𝑔=1 𝐼 𝑖=1 𝐽 𝑗=1 𝑀 𝑚=1
DCs Operating cost = 𝑀 × ∑ ∑ ∑ 𝑂𝐶𝑗𝑌𝑔𝑗𝑘
𝐺 𝑔=1 𝐼 𝑖=1 𝐽 𝑗=1
DCs Handling cost = ∑ ∑ ∑ ∑ 𝐻2𝑗𝑋′ 𝑔𝑖𝑗𝑚 𝐺 𝑔=1 𝐼 𝑖=1 𝐽 𝑗=1 𝑀 𝑚=1
DCs Transportation cost = ∑ ∑ ∑ 𝑇2𝑗𝑘𝑌′ 𝑔𝑗𝑘𝑚 𝐺 𝑔=1 𝐽 𝑗=1 𝐾 𝑘=1
retailers Average holding cost = ∑ ∑ ∑1
2𝐻3𝑘𝐷′𝑔𝑘𝑚
𝐺 𝑔=1 𝐾 𝑘=1 𝑀 𝑚=1
Back orders cost = 𝐵 × [ ∑ 𝑚(∑ ∑ 𝑃′ 𝑔𝑖𝑚 𝐺 𝑔=1 − 𝐼 𝑖=1 ∑ ∑ 𝑃𝑔𝑖) 𝐺 𝑔=1 𝐼 𝑖=1 𝑀 𝑚=1 ]
Lost sales cost = 𝐿 × [𝑀 ∑ ∑ 𝑃𝑔𝑖+ 𝐷′− ∑ ∑ ∑ 𝑃′ 𝑔𝑖𝑚 𝐺
𝑔=1 𝐼
𝑖=1 𝑀
𝑚=1 𝐺
𝑔=1 𝐼
𝑖=1
]
If S≤L, the cost of lost sale is zero, otherwise the cost of outsourcing is zero.
The total cost of the supply chain, which is our objective function, is derived from equations above and equals the total plant cost + total DC cost + total retailer cost + back orders cost + outsourcing cost + lost sales cost, where P´gim , X´gijm, Y´gjkm and D´gkm are decision variables.
𝑃′
𝑔𝑖𝑚 ≤ 𝐶𝑃𝑔𝑖 ; ∀𝑖. 𝑚. 𝑔 (29)
𝑃′
𝑔𝑖𝑚 = ∑ 𝑋′𝑔𝑖𝑗𝑚 𝐽
𝑗=1
; ∀𝑖. 𝑚. 𝑔 (30)
∑ 𝑋′ 𝑔𝑖𝑗𝑚 𝐼
𝑖=1
= ∑ 𝑌′ 𝑗𝑘𝑚 𝐾
𝑘=1
; ∀𝑗. 𝑚. 𝑔 (31)
∑ 𝑋′ 𝑔𝑖𝑗𝑚 𝐼
𝑖=1
≤ 𝐶𝐷𝑔𝑗𝑚; ∀𝑔. 𝑗. 𝑚 (32)
∑ 𝑌′ 𝑔𝑗𝑘𝑚 𝐽
𝑗=1
= 𝐷′
𝑔𝑘𝑚; ∀𝑘. 𝑚. 𝑔 (33)
𝑀 ∑ ∑ 𝑃𝑔𝑖
𝐺
𝑔=1 𝐼
𝑖=1
+ 𝐷′ 𝑔𝑘𝑚
≥ ∑ ∑ ∑ 𝑃′ 𝑔𝑖𝑚 𝐺
𝑔=1 𝐼
𝑖=1 𝑀
𝑚=1
(34)
𝑃′
𝑔𝑖𝑚. 𝑋′𝑔𝑖𝑗𝑚. 𝑌′𝑔𝑗𝑘𝑚. 𝑆𝑆′𝑔𝑖𝑚 ≥ 0.
∈ 𝑍 ; ∀𝑖. 𝑗. 𝑘. 𝑚. 𝑔 (35)
for a given Pgi , CPgi , CDj and Dgk , and the nth disrupted plant, if B≪L, S, the recovery plan
will use only the back orders option if 𝐷′ ≤ 𝑀 ∑𝐺𝑔=1∑𝐼𝑖=1𝑆𝐶𝑔𝑖and the recovery plan will use both the lost sales/outsourcing and back orders options if 𝐷′ ≤ 𝑀 ∑𝐺𝑔=1∑𝐼𝑖=1𝑆𝐶𝑔𝑖.
𝑀 ∑ ∑𝐼 𝑃𝑔𝑖
𝑖=1 𝐺
𝑔=1
+ 𝐷′ = ∑ ∑ ∑ 𝑃′ 𝑔𝑖𝑚 𝐼
𝑖=1 𝑀
𝑚=1 𝐺
𝑔=1
𝐷′ = ∑ ∑ ∑ 𝑃′ 𝑔𝑖𝑚 𝐼
𝑖=1 𝑀
𝑚=1 𝐺
𝑔=1
− 𝑀 ∑ ∑𝐼 𝑃𝑔𝑖
𝑖=1 𝐺
𝑔=1
𝐷′ ≤ 𝑀 ∑ ∑ 𝐶𝑃 𝑔𝑖 𝐼
𝑖=1 𝐺
𝑔=1
− 𝑀 ∑ ∑𝐼 𝑃𝑔𝑖
𝑖=1 𝐺
𝑔=1
𝐷′ ≤ 𝑀(∑ ∑ 𝐶𝑃
𝑔𝑖 𝐼
𝑖=1 𝐺
𝑔=1
− ∑ ∑ 𝑃𝑔𝑖 𝐼
𝑖=1 𝐺
𝑔=1
)
(36) 𝐷′ ≤ 𝑀 ∑ ∑ 𝑆𝐶
𝑔𝑖 𝐼
𝑖=1 𝐺
𝑔=1
Therefore, it can be said, that if 𝐷′ ≤ 𝑀 ∑𝐺𝑔=1∑𝐼𝑖=1𝑆𝐶𝑔𝑖, the system will utilize only the back
orders option in the recovery plan. From the opposite consequence of Eq. (36) , it also can be said that the recovery plan will use both the back orders and lost sales/outsourcing options if 𝐷′ > 𝑀 ∑ ∑ 𝑆𝐶
𝑔𝑖 𝐼
𝑖=1 𝐺
𝑔=1 .
4. Solution approaches
In this section, solution approaches for both ideal and disrupted systems are developed. A standard solution technique for solving the ideal supply chain system is proposed and applied to obtain updated and predictive mitigation plans for changes in the data and future predictions respectively. An efficient heuristic for managing a single disruption in the system is developed and then extended to be implemented for managing multiple disruptions on a real-time basis. The presented algorithm solves the problem by MATLAB software. The criteria for comparing the results obtained from the algorithm are also described and numerical results are presented in table and chart formats. All examples run in the 3.2GHz personal computer with 4GB of RAM through the Windows 10 operating system. In this research, the ranking method provided by Jimenez (Jimenez, Arenas, Bilbao, & Rodriguez, 2007) has been used for Defuzzification.
4.1. Heuristic for managing single disruption
A heuristic is designed to obtain the revised plan after an occurrence of a single disruption at any plant. Firstly, both the ideal and disrupted systems are solved using the MATLAB software and then the heuristic efficiently solves the disruption management model through the following steps.
Step 1: Input all the information about production and distribution under ideal conditions. Step 2: Obtain an ideal production and distribution plan by solving the mathematical model for ideal situations and also determine the spare capacity in each plant.
Step 3: Input a production disruption scenario involving a disrupted plant, disruption start time (tn) and disruption duration (Tdn).
4.1. If B≤L,S:
4.1.1. If 𝐷′ ≤ 𝑀 ∑𝐼𝑖=1𝑆𝐶𝑖, use the spare capacity to revise the plan until the unfilled demand is met;
4.1.2. If 𝐷′ > 𝑀 ∑𝐼𝑖=1𝑆𝐶𝑖, use both the spare capacity and lost sales/outsourcing options;
4.1.2.1. If L≥S,use the outsourcing option and
4.1.2.2. If L˂S, use the lost sales option.
4.2. If B>L,S:
4.2.1. If L≥S,use the outsourcing option to revise the plan or
4.2.2. If L˂S,use the lost sales option to revise the plan.
Step 5: Determine the distribution plan.
5.1. If 𝐷′ ≤ 𝑀 ∑𝐼𝑖=1𝑆𝐶𝑖, determine the distribution plan by varying only the transportation quantity while using the same path as the ideal plan.
5.2. If 𝐷′ > 𝑀 ∑𝐼𝑖=1𝑆𝐶𝑖, determine the distribution plan by varying only the transportation quantity while using the same path as that obtained from the proposed algorithm for 𝐷′ > 𝑀 ∑𝐼 𝑆𝐶𝑖
𝑖=1 .
Step 6: Record the results and determine the different costs. Step 7: Stop.
4.2. Proposed heuristic for multiple disruptions
In this section, the heuristic that was first developed to manage a single disruption is extended to manage multiple production disruptions on a real-time basis. When a disruption occurs, a revised plan can be generated by solving the mathematical model using the proposed heuristic for a single disruption. Then, if another disruption occurs, the plan should be revised again to consider the effects of both disruptions. This can be done by simply updating some of the parameters in the same mathematical model to represent the changed scenario; for example, the newly disrupted plant, start time of the disruption, disruption duration, quantity produced before starting the revised plan and demand to be filled in the revised plan. The objective function and constraints are also up- dated for the changed situation. Therefore, the heuristic for a single disruption can still be used but must be slightly modified for the changed situation to be capable of dealing with a series of disruptions on a real-time basis. In the proposed approach, the heuristic must be run every time a disruption occurs to re-optimize the revised plan whenever there are disruptions in the system. For a series of disruptions, the production quantity loss after the sth disruption can be determined using following equations:
𝐼𝑓: 𝑃𝑛
𝐶𝑃𝑛 > 𝑡𝑛+ 𝑇𝑑𝑛
𝐷′= 𝐷′
𝑠−1− ( ∑ ∑ 𝑃′𝑖𝑚 𝐼
𝑖=1 𝑙
𝑚=1
− 𝑙 ∑ 𝑃𝑖 𝐼
𝑖=1
) + 𝐶𝑃𝑛× 𝑇𝑑𝑛− 𝑚𝑖𝑛 {∑ 𝑆𝐶𝑖 𝐼
𝑖=1
. ∑ 𝐶𝑃𝑖× (1 − 𝑡𝑛− 𝑇𝑑𝑛) 𝐼
𝑖=1
}
𝐼𝑓: 𝑃𝑛
𝐶𝑃𝑛 < 𝑡𝑛+ 𝑇𝑑𝑛
𝐷′= 𝐷′
𝑠−1− ( ∑ ∑ 𝑃′𝑖𝑚 𝐼
𝑖=1 𝑙
𝑚=1
− 𝑙 ∑ 𝑃𝑖 𝐼
𝑖=1
) + 𝐶𝑃𝑛× (
𝑃𝑛
𝐶𝑃𝑛− 𝑡𝑛) − 𝑚𝑖𝑛 {∑ 𝑆𝐶𝑖 𝐼
𝑖=1
. ∑ 𝐶𝑃𝑖× (1 − 𝑡𝑛− 𝑇𝑑𝑛) 𝐼
𝑖=1
}
Here, l is the new disrupted period since the previous disruption. The main steps in the proposed heuristic for a series of disruptions on a real-time basis can be presented as follows.
Step 1: Input all the information about production and distribution under ideal conditions. Step 2: Determine the optimal plan under ideal conditions.
Step 3: Input the disruption scenario (disrupted plant, disrupted period since the previous disruption, disruption start time (tn) and disruption duration (Tdn)).
Step 4: Update the loss of production quantity using Eqs. (37) and (38).
Step 5: Revise the production plan for the corresponding disruption using the proposed heuristic developed in Section 4.2.
Step 6: Record and update the optimal production and distribution plan from Step 5 after the disruption occurs. Step 7: If there is any other disruption, go to Step 3.
Step 8: Stop.
4.3. Experimentation and analysis of results
In order to investigate the effectiveness of the research initiative in achieving results in real-world conditions, available information used from automobile parts supply chain. In this example, 5 pieces of product from two companies in the industry are used as follows.
Table 2. Products data for two companies
Product description Sales price
(Rials) Product description
Sales price (Rials) 1 Peugeot 405 lower Ball joint 149.000 4 Peugeot 206 left control arm 955.000
2 Peugeot 405 left Ball joint 182.000 5 Peugeot 206 right control arm 955.000
3 Peugeot 405 right Ball joint 182.000
All the presented information is about the components of the Peugeot 206 and 405 and other data needed to solve the problem are generated hypothetically. Table 3 shows the values of the problem parameters.
Table 3. Problem parameters
interval Parameter
interval parameter
[500.1000] OCj
[1000.2000] 𝐶𝑃̃𝑔𝑖
[5000.10000] SCgi
[3000.5000] 𝐶𝐷̃𝑔𝑗
[0.1] tn
[1000.2000] 𝐷̃𝑔𝑘
[0.1] Tdn
[500.800] H1gi
[50.800] L
[200.500] H2gj
[500.800] B
[150.300] H3gk
[500.800] S
[80.110] T1gij
[2.5] M
[50.120] T2gjk
Table 4 presents cases with different random combinations of a disrupted plant, disruption start times and disruption durations. Although disruptions can happen continuously within a production cycle, it presents ten disruptions as a sample representation. The production and distribution plans were revised immediately after each disruption occurred in the system.
Table 4. A case problem for a series of disruptions.
Disruption number Disrupted plant
Disrupted period since previous
disruption
Disruption start time
Disruption duration
1 1 - 0.02 0.20
2 2 1 0.21 0.09
3 2 1 0.31 0.10
4 1 2 0.42 0.16
5 2 3 0.58 0.10
6 1 2 0.68 0.05
7 1 2 0.74 0.05
8 1 1 0.80 0.08
9 2 4 0.90 0.02
10 1 3 0.93 0.05
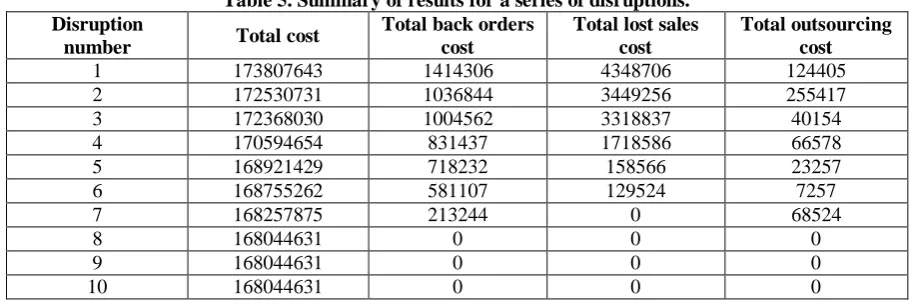
After solving the problem with the proposed algorithm, the results are presented in Table 5, which includes the total cost, the cost of back orders, the cost of lost sales and the cost of outsourcing. It was observed that the system utilized the spare capacity, lost sales and outsourcing options for the first six disruptions for revising the plan, and it was capable of revising the plan by using only the back orders and outsourcing option for the 7th disruption. After the 7th disruption, the system was capable to recover by utilizing the spare capacity of the other plant so no back orders, lost sales or outsourcing are presented in the recovery plan then.
Table 5. Summary of results for a series of disruptions. Disruption
number Total cost
Total back orders cost
Total lost sales cost
Total outsourcing cost
1 173807643 1414306 4348706 124405
2 172530731 1036844 3449256 255417
3 172368030 1004562 3318837 40154
4 170594654 831437 1718586 66578
5 168921429 718232 158566 23257
6 168755262 581107 129524 7257
7 168257875 213244 0 68524
8 168044631 0 0 0
9 168044631 0 0 0
10 168044631 0 0 0
5. Analysis of the model solution results
Ten disruptions are considered at different times in the two plants. Each of these disruptions causes problems in each of the manufacturer's factories. After solving the problem with the aid of the proposed quotation, it is observed that until the disruption of number 7, the cost of selling lost is unpaired. In fact, the presence of the disruption causes the problem in the line produced, and some products appear in the form of a deferred order, outsourcing or lost sales. But in the seventh disruption, the remainder is not a sale, and there are only deferred orders and outsourcing costs. Otherwise, the production system is able to respond to all requests, but some consider them as outsourced orders, and some are outsourced. In disruptions 8 to 10, all remaining orders, lost sales, and outsourced costs are zero and there is only the cost of product production. In fact, the algorithm is able to neutralize the effect of disruptions and reduce the cost of the system.
same in the two schemes. But gradually, with increasing duration of disruption, system costs in factory 1 are greater than factory 2. But in the last disruptions, costs are again equal.
Figure 1. Total cost vs disruption duration
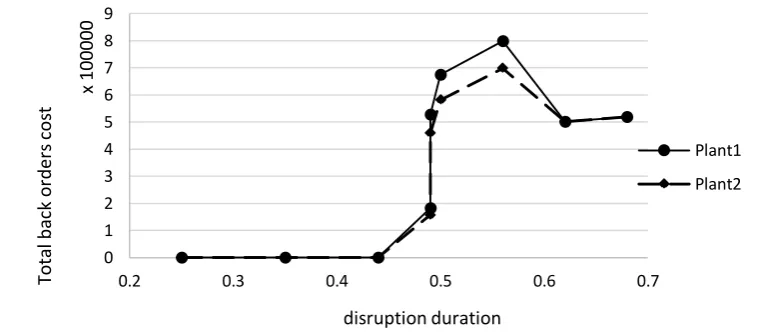
In Fig.2, the graph shows the total back orders cost for disruptions duration. But the important point in this chart is the close-up of the cost of back orders in the two factories. This only slightly increased in 0.5 and 0.56 disruptions, but at the other level they still have little distance. This indicates the efficiency level of proposed algorithm in creating a balance in controlling back orders costs in the two factories.
Figure 2. Total back orders cost vs disruption duration
In Fig.3, the lost sales costs are shown for disruptions durations. In this chart, same as Fig.1, the lost sales costs in the two factories are very close to each other and presents the existence of a proper control of costs levels at different disruptions.
80 90 100 110 120 130 140 150 160 170
0.2 0.3 0.4 0.5 0.6 0.7
To
ta
l c
o
st
Mi
lli
o
ns
disruption duration
Plant1
Plant2
0 1 2 3 4 5 6 7 8 9
0.2 0.3 0.4 0.5 0.6 0.7
To
ta
l ba
ck
o
rder
s
co
st
x
100000
disruption duration
Plant1
Figure 3. Total lost sales cost vs disruption duration
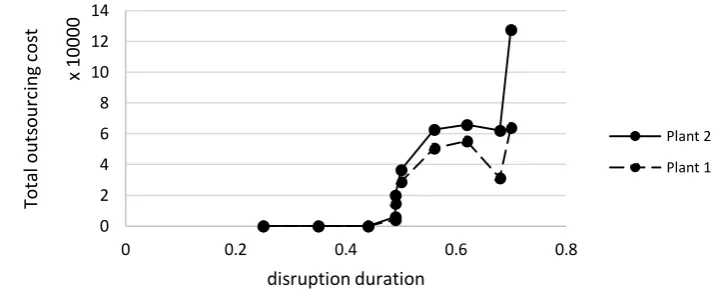
In Fig.4, outsourcing costs are shown at various levels of the disruption. In this diagram, the outsourcing costs in the two factories is very close to each other, this indicates the efficiency of proposed algorithm in creating a balance in controlling outsourcing costs in the two factories. Of course, at disruption that start at a longer time interval, outsourcing costs differ at the two factories.
Figure 4. Total outsourcing cost vs disruption duration
In order to illustrate the effect of applying the proposed method to reduce the effect of disruptions, we solved the problem in two ways: the existence and absence of a proposed method and the level of costs have been compared. In fact, it can be shown that in the event of disruptions, their prediction and attempts to deal with them can make it easier to reduce system costs. The following diagrams are formed.
As it can be seen in Fig.5, if the proposed method is used to control the disruptions, all the total back orders cost of the system decreases. This increase is quite predictable, since any disruption always causes some of the system performance on meeting the demand to be eliminated and forced to take actions such as back orders.
0 0.5 1 1.5 2 2.5 3 3.5
0 0.1 0.2 0.3 0.4 0.5 0.6 0.7 0.8
To
ta
l l
o
st
sal
es
c
o
st
Mi
lli
o
ns
disruption duration
Plant1
Plant2
0 2 4 6 8 10 12 14
0 0.2 0.4 0.6 0.8
To
ta
l o
uts
o
ur
ci
ng
c
o
st
x
10000
disruption duration
Plant 2
Figure 5. Total back orders cost: research results vs normal results
In Fig.6, it can be seen if the proposed method is not used to control the disruptions, the total lost sales cost of the system increases. This increase is quite predictable, since any disruption always causes some of the system performance on meeting the demand to be eliminated and forced to take actions such as lost sales.
In Fig.7, it can be seen if the proposed method is used to control the disruptions, the outsourcing cost of the system decreases. This increase is quite predictable, since any disruption always causes some of the system performance on meeting the demand to be eliminated and forced to take actions such as outsourcing.
0 2000000 4000000 6000000 8000000 10000000
1 2 3 4 5 6 7 8 9 10
T
o
ta
l
lo
st
s
a
le
s
co
st
By research proposed method Without research proposed method
Figure 6. Total lost sales cost: research results vs normal results 0
500000 1000000 1500000 2000000 2500000 3000000
1 2 3 4 5 6 7 8 9 10
T
o
ta
l
b
a
ck
o
rde
rs
c
o
st
Figure 7. Total outsourcing cost: research results vs normal results
6. Conclusions
Developing a quantitative approach for managing any changes in data and for creating a predictive and reactive mitigation solution in a multiproduct supply chain was main objective of this paper. In the case of any data changes that were known in advance, the supply chain plan was revised according to them. Also, this paper developed a quantitative reactive mitigation plan for managing sudden production disruptions that were not known and cannot be predicted. The supply chain plan was revised for a limited interval into the future, just after happening a disruption. The objective is to minimize the effect of the disruption and to return the system to its ideal plan as soon as possible. For this purpose, this research developed an impressive heuristic to obtain the reactive plan. Also an extended heuristic was developed for managing a series of disruptions, because they are common in real-life supply chain practice. Several numerical examples were presented to analyze the results and usefulness of the models. As the developed approaches have great practical implications, so it can be said that the proposed quantitative and heuristic approaches offer a potentially useful quantitative means of helping decision makers arrive at prompt and accurate decisions regarding both predictive and reactive mitigation plans. Organizations can immediately revise their plans (a) for any data changes, (b) for any future prediction of demand changes, and/or (c) after the occurrences of any single and/or series of sudden production disruptions in the organizations. Moreover, this paper presented an innovative method for solving the minimization of the total cost of the whole supply chain. Three-level supply chain consists of three manufacturing plants, four distributors and five retailers whose products are strategic car spare parts. The results showed that, using proposed model in considering the chain as a whole unit and minimizing the cost of the chain, the chain profit would be increased and the chain survival would be guaranteed. It is suggested that the model presented in this study can be used to optimize the cost of supply chain in different industries. In particular, because of dealing with spare parts for automobiles in this study, model usage has become more tangible for decision makers in the supply chain of auto spare parts, as well as experts in the planning departments of auto parts production factories. However, the application of the model is not limited to this area of the industry and is applicable to all three-level supply chains by applying the necessary inputs. Companies operating in this competitive industry should understand the necessity of product production based on the actual demand of customers. The advancements in technology, the changing market conditions, and the competition of competitors change the buyer's minds fast, and rational action to improve the position of the product is needed more than ever. Because, customers tend to buy the products that offer them more value at a lower price. Any competitor who can provide more value to customers at a lower price can bring more market share. Hence, it is imperative that each member minimizes costs by updating models and patterns because
0 100000 200000 300000 400000 500000
1 2 3 4 5 6 7 8 9 10
T
o
ta
l
o
ut
so
ur
ci
n
g
co
st
today's increasingly complex forms of production and sales cannot be followed by traditional patterns.
The following approaches can be proposed for the future studies:
The proposed approaches can be extended by considering sudden disruptions in supply, distribution and delivery.
Expansion of the model for example the number of supply chain levels can be increased. Addressing the demand uncertainty and the supply of returned products in a multi-product integrated logistics network.
Consideration of green supply chain (addressing environmental issues) is also proposed.
References
Aust, G., and Buscher, U., (2012). "Vertical cooperative advertising and pricing decisions in a manufacturer–retailer supply chain: A game theoretic approach", European Journal of Operational Research, pp. 473-482.
Azad, N., Saharidis, G., Davoudpour, H., Maleky, H., and Yektamaram, S., (2013). "Strategies for protecting supply chain networks against facility and transportation disruptions : an improved Benders", Annals of Operations Research, Vol. 210, No. 1, pp. 125–163.
Fakhrzad, M., and Alidoosti, Z., (2018). "A realistic perishability inventory management for location-inventory-routing problem based on Genetic Algorithm", Journal of Industrial Engineering and Management Studies, Vol. 5, No. 1, pp. 106-121.
Giannakis, M., (2011). "Management of service supply chains with a service-oriented reference model: the case of management consulting", Supply Chain Management: An International Journal, Vol. 16, No. 5, pp. 346-361.
Giri, B. C., and Sharma, S., (2014). "Manufacturer’s pricing strategy in a two-level supply chain with competing retailers and advertising cost dependent demand", Economic Modelling, pp. 102-111.
ISNA. (2017). https://www.isna.ir/news/96022013352/. Tehran: isna.
Jimenez, M., Arenas, M., Bilbao, A., and Rodriguez, M. V., (2007). "Linear programming with fuzzy parameters: An interactive method resolution", Eur. J. Oper. Res., Vol. 177, pp. 1599–1609.
Johari, M., Hosseini-Motlagh, S. M., and Nematollahi, M. R., (2016). "Coordinating pricing and periodic review replenishment decisions in a two-echelon supply chain using quantity discount contract", Journal of Industrial Engineering and Management Studies, Vol. 3, No. 2, pp. 58-87.
Kanchan, D., (2018). "Integrating lean systems in the design of a sustainable supply chain model", International Journal of Production Economics, pp. 177-190.
Liang, G., and Renbin, X., (2017). "Outer synchronization and parameter identification approach to the resilient recovery of supply network with uncertainty", Physica A: Statistical Mechanics and its Applications, pp. 407-421.
Maestrini, V., Luzzini, D., Maccarrone, P., and Caniato, F., (2017). "Supply chain performance measurement systems: A systematic review and research agenda", International Journal of Production Economics, pp. 299-315.
Paul, S. K., Sarker, R., and Essam, D., (2017). "A quantitative model for disruption mitigation in a supply chain", European Journal of Operational Research, pp. 881-895.
Peng, p., snyder, L. V., Lim, A., and Liu, z., (2011). "Reliable logistics networks design with facility disruptions", Transportation Research Part B: Methodological, Vol. 45, No.8, pp. 1190–1211.
Rezayi, A., (2012). Forecating product demand using backup vector regression (Case study: Irana tile). Dissertation for obtaining a Master's Degree; Semnan University.
Shishebori, D., and Yousefi Babadi, A., (2015). "Dynamic supply chain network design for the supply of blood in disasters: A robust model with real world application", Transportation Research Part E: Logistics and Transportation Review, Vol. 70, pp. 225–244.
Tamplin, M. L., (2017). Integrating predictive models and sensors to manage food stability in supply chains. Food Microbiology, In Press, Corrected Proof.
Veronica , P. C., (2013). "A framework to facilitate interoperability in supply chains", International Journal of Computer Integrated Manufacturing, pp. 67-68.
Zhi, C., Baofeng, H., Yuan, L., and Xiande, Z., (2015). "The impact of organizational culture on supply chain integration: a contingency and configuration approach", Supply Chain Management: An International Journal, pp. 24-41.
This article can be cited: Alavikia, S.A., TaghaviFard, M.T., Amiri, M., and Azimi, P.,
(2019). "A quantitative model for optimization and disruption mitigation in a supply chain (Auto parts case study)", Journal of Industrial Engineering and Management Studies, Vol. 6, No. 1, pp. 111-129.