IJMF
Online ISSN: 2383-0042
Iranian Journal of Materials Forming
Journal Homepage: http://ijmf.shirazu.ac.ir
Plastic Deformation Modeling of Foam-Filled Tubes with Multi-Layer
Foams During Compression Loading
S. M. H. Mirbagheri∗, M. Salehi and A. Jafari Ramiani
School of Metallurgy and Materials Engineering, Amirkabir University of Technology University, Tehran, Iran
A R T I C L E I N F O
A B S T R A C T
Article history:
Received 12 April 2019 R evi s ed 12 October 2019 Accepted 13 October 2019
The purpose of this paper is to investigate the work hardening behavior and energy absorption characteristic of metallic foams and functionally graded foam filled tubes, including single-, double- and triple-layer foams. Closed-cell A356 alloy and pure zinc foams are fabricated by casting method. The results illustrate that the metallic foams show partially brittle compressive deformation associated with cell walls’ bending and tearing. A nonlinear asymptotic model,
𝜎𝜎=𝜎𝜎0(1− 𝜀𝜀)−𝜌𝜌𝐹𝐹/𝜌𝜌𝑆𝑆, is proposed to represent the hardening behavior of metallic foams and
graded foam filled tubes as a function of relative density. The development of a complementary model,𝜎𝜎=𝜎𝜎0𝜀𝜀sin(𝑛𝑛𝑛𝑛𝜀𝜀) +𝜎𝜎0(1− 𝜀𝜀)−𝜌𝜌𝐹𝐹/𝜌𝜌𝑆𝑆, leads to a more accurate estimation of crushing response considering the stress oscillations, particularly for the A356 foam with high degrees of oscillation and multi-layered structures containing distinct plateau regions. Therefore, the present model is fairly consistent with the experimental results. Greater density and strength of the zinc foam compared to those of the A356 foam cause the highest total energy absorption of 581 J in the zinc foam filled tube and the highest specific energy absorption of 459.2 J/(g/cm3) in the A356 foam filled tube. The presence of zinc foam results in the decrease of specific energy absorption. However, it plays a dominant role in adjusting the crash features of graded structures. The compressive properties of multi-layered structures can be controlled by varying the number and material of the layers at constant geometric features.
© Shiraz University, Shiraz, Iran, 2019 Keywords:
Metallic foam
Multi-layered foam filled tube Plastic deformation
Energy absorption Strain hardening
1. Introduction
Nowadays, the interest in lightweight materials has been increasing due to the demands of transportation industry [1]. In recent decades, metallic foams, particularly aluminum alloy foams, with an outstanding combination of mechanical and physical properties, have been developed as a new class of functional materials to limit the effect of crashes [1, 2]. Enhanced energy absorption and high specific stiffness have made aluminum foams far more attractive compared to the traditional ones such as dense metals [2, 3]. Generally, closed-cell foams show three regimes of deformation in the compression test. The most important one is the plateau regime, wherein the stress remains nearly constant by increasing the plastic
∗ Corresponding author
E-mail address: [email protected](S. M. H. Mirbagheri)
deformation; thereby, considerable energy is dissipated. Nevertheless, metallic foams reveal a rapid rise in the stress with the minimum increment of deformation in the densification region, and the strain at which this occurs is referred to as densification strain (εD). Applications of aluminum foams in many fields call for further insights into the aspect of energy absorption [2, 4, 5]. Moreover, zinc alloy foams are inexpensive, flexible, and exhibit excellent mechanical and damping properties at room temperature. Also, the melting point and strength of zinc alloys are lower than those of aluminum alloys [5-8]. The melt foaming process is one of the most common and economical methods for the fabrication of metallic foams [1, 9, 10].
The common use of thin walled components as the most popular form of crashworthy energy absorbents is
IJMF Iranian Journal of Materials Forming
Shiraz University O n lin e ISSN: 2383-0042 Published by: Shiraz Un iversity , Sh iraz, Iran
Vo l. 6 No . 2 October 2019
due to their specific features, including superior performance under dynamic loading, high efficiency and simplicity of manufacturing and installation. Tubular components such as foam filled square tubes have received noticeable attention in the automobile industry [11-13]. Foam filled structures are often used in mechanical engineering applications as they are cost effective and improve the crashworthiness of vehicles without increasing their weight [2]. The energy absorption of foam filled components is found to be highly dependent on the foam’s density and number of pores per inch (ppi). However, filling a thin walled tube, with a high density foam, may lead to a lower specific energy absorption (SEA) compared with the empty tube [11-15].
There is also the chance of controlling the SEA of metallic foams at desired locations by changing the pore structure or type of foam material to obtain a functionally graded foam (FGF). Recently, attempts have been made to fabricate FGFs mainly by varying the pore size and density distribution of the metallic foams. It is desirable that when these FGFs are subjected to compression, first, weaker regions with higher porosity start to deform, and then stronger regions with lower porosity begin to deform. The sequential deformation and plateau stress of graded foams can be controlled at the desired location. It is considered that the lack of reports on the compression properties of FGFs is due to the difficulty of controlling the pore structure in the single foam, particularly in the closed-cell aluminum foam. Therefore, the FGFs, which consist of multi-layers of metallic foams with different properties are expected to exhibit higher functionality than ordinary uniform foams. It has been found that the compressive deformation of these FGFs starts from the foam with lower plateau stress, followed by the foam with higher plateau stress [16-18].
Although some research works are dedicated to modeling the work hardening behavior of metallic foams, a lot of complexity and unknown parameters have still remained. The Hollomon model is not well-fitted with the strain hardening behavior of porous materials such as metallic foams [19]. Therefore, the aim
of this paper is to establish a model for representing the uniform and the oscillation hardening behavior of metallic foams and foam filled tubes under compression loading. To this end, the closed-cell A356 aluminum alloy and pure zinc foams are fabricated and used as core materials for the preparation of single- and multi-layered foam filled tubes. Quasi-static compression tests are carried out on the metallic foams and graded foam filled tubes. Then, an asymptotic hardening model is developed based on the density and strength of porous structures. Also, a comparative study on the crashworthiness is conducted in terms of total energy absorption (Ea) and SEA.
2. Experimental Procedure
Closed-cell metallic foams were manufactured by casting route, as shown schematically in Fig. 1 [21]. The pure zinc and A356 aluminum alloy were melted at 500 °C and 750 °C, respectively. The viscosity of melts was modified by adding 2 wt% of calcium granules at a constant stirring speed of 500 rpm. 1.2 wt% of titanium hydride (TiH2) powder was added as
a foaming agent into the melts at a stirring speed of 1700 rpm. Then, the zinc and A356 alloy melts were poured into cubic steel molds and put into an electrical furnace to allow foam formation at holding temperatures of 600 °C and 700 °C, respectively. Since the decomposition of TiH2 occurs more slowly
in the pure zinc with a lower melting point, longer duration of 12 minutes was selected for its foaming process compared to the A356 alloy with the foaming duration of 3 minutes.
Fig. 1. A schematic of casting route for preparing the
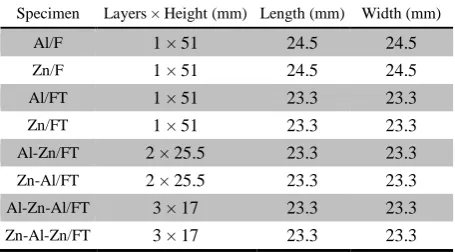
Square aluminum extrusions with a thickness of 0.65 mm and outer cross section of 24.5 × 24.5 mm were cut into 51 mm-height tubes. Then, the test specimens were prepared by fitting the foam fillers of different arrangements into the tubes, as shown in Fig. 2. The energy absorbing elements, including the metallic foams, and also, single-, double- and triple-layered foam filled tubes, were coded as shown in Table 1 by using the letters F, T, Al and Zn for addressing foam, tube, A356 aluminum alloy and zinc, respectively. For example, Al-Zn/FT is the tube filled with two layers of A356 and zinc foams, respectively from top to the bottom.
(a) AI/FT A356 foam Square tube
(b) Zn-Al/FT (c) Zn-Al-Zn/FT
Fig. 2. Arrangement of foam layers in (a) single-layered
A356 alloy, (b) double-layered zinc-A356 alloy, and (c) triple-layered zinc-A356 alloy-zinc foam filled tubes Table. 1. Dimensions of foam layers in the energy absorbing
elements.
Specimen Layers × Height (mm) Length (mm) Width (mm)
Al/F 1 × 51 24.5 24.5
Zn/F 1 × 51 24.5 24.5
Al/FT 1 × 51 23.3 23.3
Zn/FT 1 × 51 23.3 23.3
Al-Zn/FT 2 × 25.5 23.3 23.3
Zn-Al/FT 2 × 25.5 23.3 23.3
Al-Zn-Al/FT 3 × 17 23.3 23.3
Zn-Al-Zn/FT 3 × 17 23.3 23.3
Uniaxial quasi-static compression tests were conducted at room temperature in a standard universal testing machine (Instron-8502) with a load capacity of 25 kN. A nominal strain rate of 2 × 10‒3 s‒1 was adopted throughout the tests, and the
final crushing displacement was set to approximately 40 mm. The force-displacement data were recorded and plotted by connecting a data acquisition system to the compression testing equipment. The deformation modes of samples were photographed throughout the crushing process, as shown in Fig. 3 for the Zn-Al/FT. The experimental results were employed to develop a mathematical model for predicting the plastic deformation of porous structures. The macrostructure of closed-cell foams and crushed foam filled tubes was observed. Finally, the microstructure of crushed foams in the polished longitudinal sections was investigated by using FESEM.
(a) %10 (b) %17
(c) %35 (d) %45
(e) %58 (f) %65
Fig. 3. Sequential images of the crushing process for the
3. Results and Discussion
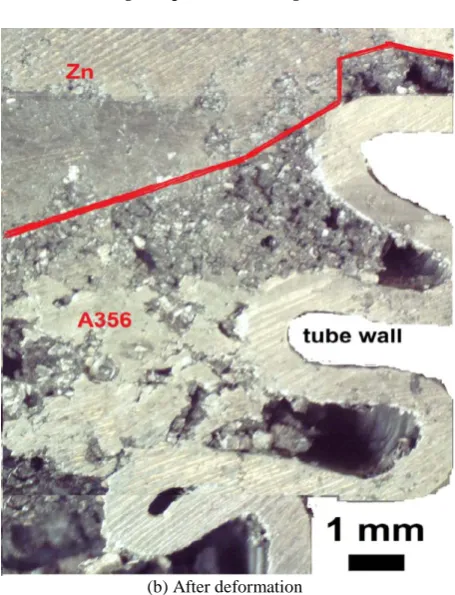
The structure of closed-cell foams consists of solid bubble walls and plateau borders (junctions of two or three bubbles). The macrostructure of Zn-Al/FT before and after the compression test is shown in Figs. 4(a) and 4(b), respectively. According to Fig. 4(a), the A356 foam contains larger size bubbles and thinner cell walls compared to the zinc foam. When the compressive load is applied, bending and fracture of cell edges occur in each foam layer, as seen in Fig. 4(b). Also, the red line in Fig. 4(b) indicates the location of the interface between the crushed zinc and A356 foams. It is generally accepted that the compressive failure of ductile foams is controlled by the cell-edges buckling and cell walls bending, and the compressive failure of brittle foams is governed by the cell edges fracturing and cell walls tearing [1, 5, 8, 20]. Therefore, both the A356 and zinc foams reveal partially brittle mechanisms in the compression test.
Zinc A356 alloy (a) Before deformation
(b) After deformation
Fig. 4. Macrographs of the zinc-A356 alloy foam filled tube
(a) before, and (b) after the compression test.
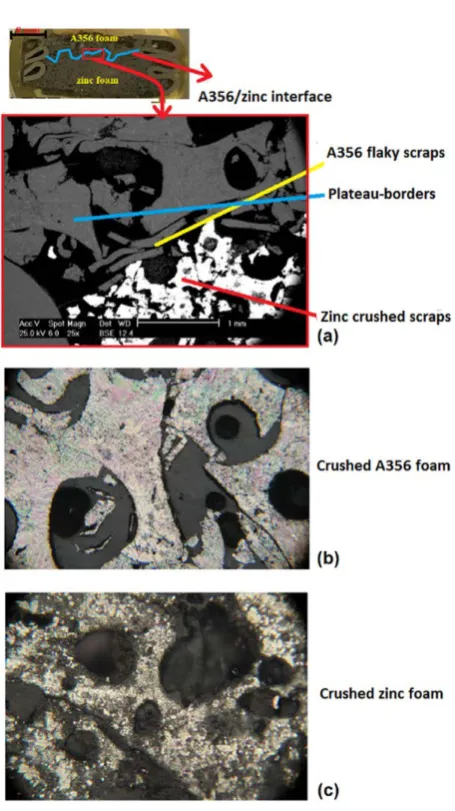
Fig. 5. Microstructure of the A356-zinc foam filled tube after being compressed up to the densification strain, (a) SEM
image of A356/zinc interface, (b) optical image of the A356 foam layer near the interface, and (c) optical image of the
zinc foam layer near the interface.
In order to investigate the plastic deformation behavior of metallic foams and graded foam filled tubes, as energy absorbing components, the force-displacement and stress-strain curves are plotted under compression loading. In fact, the strain hardening behavior of metallic foams is generally different from that of dense metals. Upon the compression, dense metals do not undergo any changes in volume, mass and density in the plastic stage and follow the power law function (𝜎𝜎=𝑘𝑘𝜀𝜀𝑛𝑛). However, the Hollomon model cannot fit the compressive data of metallic foams since considerable changes occur in their volume during the plastic collapse [21-23]. Therefore, a nonlinear asymptotic model (mIR model) is developed based on the foam apparent density (ρF) and solid
material density (ρS) to approximate the strain hardening behavior of metallic foams, assuming that their density increases toward the density of bulk metals during the uniaxial compaction. As a result, the following relationships are achieved by applying the virtual work principle and energy method to the compression test of metallic foams [19, 24-25]:
(𝑙𝑙0− 𝑙𝑙+𝑑𝑑𝑙𝑙)∗ 𝑑𝑑𝑑𝑑 ∗ 𝜌𝜌𝑠𝑠− 𝑑𝑑𝑑𝑑 ∗ 𝑑𝑑𝑙𝑙 ∗ 𝜌𝜌𝑠𝑠=𝑑𝑑 ∗ 𝑑𝑑𝑙𝑙 ∗ 𝜌𝜌𝐹𝐹,
and
(𝑙𝑙0− 𝑙𝑙+𝑑𝑑𝑙𝑙)∗ 𝑑𝑑𝑑𝑑 ∗ 𝜌𝜌𝑠𝑠− 𝑑𝑑 ∗ 𝑑𝑑𝑙𝑙 ∗ 𝜌𝜌𝐹𝐹=𝑑𝑑𝑑𝑑 ∗ 𝑑𝑑𝑙𝑙 ∗ 𝜌𝜌𝑠𝑠
and
(𝑙𝑙0− 𝑙𝑙)∗ 𝑑𝑑𝑑𝑑 ∗ 𝜌𝜌𝑠𝑠=𝑑𝑑𝑑𝑑 ∗ 𝑑𝑑𝑙𝑙 ∗ 𝜌𝜌𝑠𝑠− 𝑑𝑑𝑑𝑑 ∗ 𝑑𝑑𝑙𝑙 ∗ 𝜌𝜌𝑠𝑠+ 𝑑𝑑 ∗
𝑑𝑑𝑙𝑙 ∗ 𝜌𝜌𝐹𝐹= 𝑑𝑑 ∗ 𝑑𝑑𝑙𝑙 ∗ 𝜌𝜌𝐹𝐹
and
(𝑙𝑙0− 𝑙𝑙)∗ 𝑑𝑑𝑑𝑑 ∗ 𝜌𝜌𝑠𝑠=𝑑𝑑 ∗ 𝑑𝑑𝑙𝑙 ∗ 𝜌𝜌𝐹𝐹
and
(𝑙𝑙0− 𝑙𝑙)∗ 𝑑𝑑𝑑𝑑=𝑑𝑑 ∗ 𝑑𝑑𝑙𝑙𝜌𝜌𝜌𝜌𝐹𝐹𝑠𝑠 (1)
Where lo is the initial length of metallic foams. On the other hand, the parameters φ (compressibility factor) and εl (local strain) are defined as follows:
𝜑𝜑=𝜌𝜌𝑠𝑠−𝜌𝜌𝐹𝐹
𝜌𝜌𝑠𝑠 (2) 𝑑𝑑𝜀𝜀𝑙𝑙=𝑑𝑑𝑙𝑙𝑙𝑙0, and 𝜀𝜀𝑙𝑙=𝑙𝑙𝑙𝑙0 (3)
Then, the following relationship is obtained by substituting Eq. (2) for Eq. (1):
𝑑𝑑𝐹𝐹 𝐹𝐹 =
𝑑𝑑𝑙𝑙
(𝑙𝑙0−𝑙𝑙)(1− 𝜑𝜑) =
𝑑𝑑𝑙𝑙/𝑙𝑙0
(1−𝑙𝑙/𝑙𝑙0). (1− 𝜑𝜑) (4)
Also, by substituting for Eq. (3), Eq. (4) is found as follows:
𝑑𝑑𝐹𝐹 𝐹𝐹 =
𝑑𝑑𝑑𝑑𝑙𝑙
(1−𝑑𝑑𝑙𝑙)(1− 𝜑𝜑)
𝑑𝑑𝑙𝑙𝑛𝑛(𝑑𝑑) = (1− 𝜑𝜑) 𝑑𝑑𝑙𝑙𝑛𝑛(1− 𝜀𝜀𝑙𝑙) (5)
Consequently, the mIR model is identified as the
integral part of Eq. (5) from the beginning of the plastic region up to the complete densification, according to Eq. (6):
∫ 𝑑𝑑𝑙𝑙𝑛𝑛𝐹𝐹𝐹𝐹 (𝑑𝑑)
0 =∫ (1− 𝜑𝜑).𝑑𝑑𝑙𝑙𝑛𝑛(1− 𝜀𝜀𝑙𝑙)
𝑑𝑑𝑙𝑙
𝑙𝑙𝑛𝑛 �𝐹𝐹𝐹𝐹
0�= (1− 𝜑𝜑).𝑙𝑙𝑛𝑛(1− 𝜀𝜀𝑙𝑙)→ 𝑙𝑙𝑛𝑛 �𝐹𝐹/𝐴𝐴0
𝐹𝐹0/𝐴𝐴0�=𝑙𝑙𝑛𝑛(1− 𝜀𝜀𝑙𝑙)
(1−𝜑𝜑)→
σ=𝜎𝜎0(1− 𝜀𝜀)−𝜌𝜌𝐹𝐹/𝜌𝜌𝑆𝑆 (6)
Where σ0 (crushing onset strength) and ρF/ρs (relative density) represent the strain hardening coefficient (k) and exponent (m), respectively. Regarding nearly similar trends in the crushing response of metallic foams and foam filled tubes [11-15], the present model fits the stress-strain data of graded structures. For this purpose, the equivalent density of layered structures is calculated using the following equations:
𝜌𝜌
𝐸𝐸𝐹𝐹=
∑ 𝜌𝜌𝐹𝐹𝐹𝐹𝑉𝑉𝐹𝐹+𝜌𝜌𝑡𝑡𝑉𝑉𝑡𝑡𝑁𝑁 𝐹𝐹=1
𝑉𝑉𝑡𝑡 (7)
𝜌𝜌
𝐸𝐸𝐸𝐸=
∑ 𝜌𝜌𝑆𝑆𝐹𝐹𝑉𝑉𝐹𝐹+𝜌𝜌𝑡𝑡𝑉𝑉𝑡𝑡𝑁𝑁 𝐹𝐹=1
𝑉𝑉𝑡𝑡 (8)
Where N is the number of foam layers and Vi is the volume of each layer; ρFi and ρSi are the foam density and solid material density of each layer, respectively. Moreover, ρt and Vt are the density and volume of the aluminum tube. Table 2 summarizes the important characteristics of energy absorbents to conduct the hardening model.
Table 2. Characteristics of energy absorbing elements. Sample σ0 (MPa) ρf (g/cm3) ρs (g/cm3) Ppi (in-1)
Al/F 1 0.54 2.70 8-10
Zn/F 5 2.80 7.10 20-22
Al/FT 14 0.76 2.38 -
Zn/FT 27 2.77 6.59 -
Al-Zn/FT 18 1.76 4.63 -
Zn-Al/FT 15 1.7 4.65 -
Al-Zn-Al/FT 20 1.43 3.99 -
Zn-Al-Zn/FT 30 2.10 5.30 -
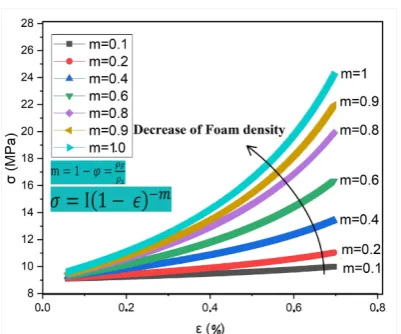
It should be noted that the proposed hardening model has an asymptotic nature and convergence toward a unit value, as shown schematically in Fig. 6 for a metallic foam. In fact, for an element with a thickness of dl, the density is ρF at the initiation of plastic deformation.
Then, the deformation proceeds progressively, and the density reaches ρs at the completion of densification. Consequently, the plastic stress increases exponentially and tends toward an asymptote line based on this modeling approach. In order to make a better clarification of the influence of ρF/ρs on the crushing response of porous structures, the model-based estimation of stress-strain curves is presented in Fig. 7 for various values of exponent m. For instance, 𝑚𝑚= 1 indicates the maximum density condition, in which the material acts as a dense metal.
Fig. 6. Schematic of hardening deformation behavior in a
metallic foam based on the mIR model.
Fig. 7. The model-based stress-strain curves for various
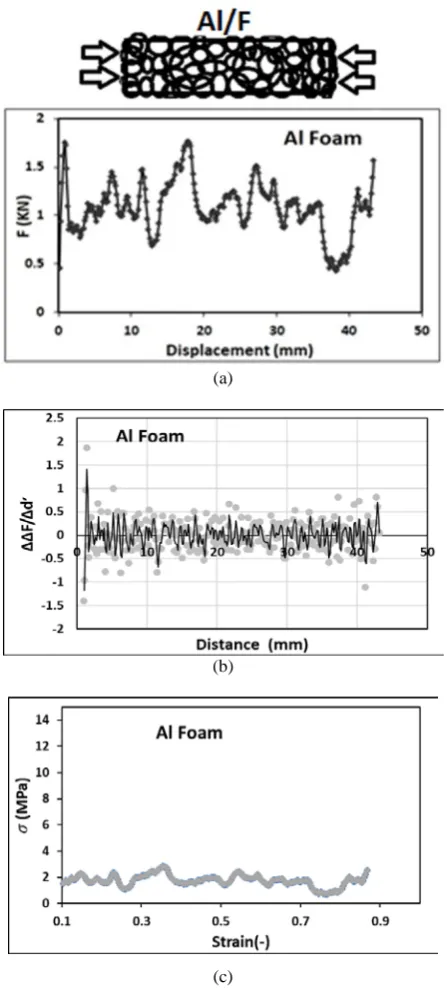
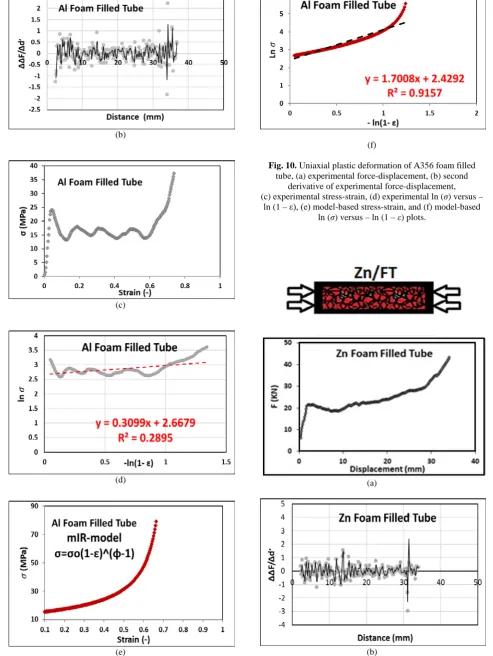
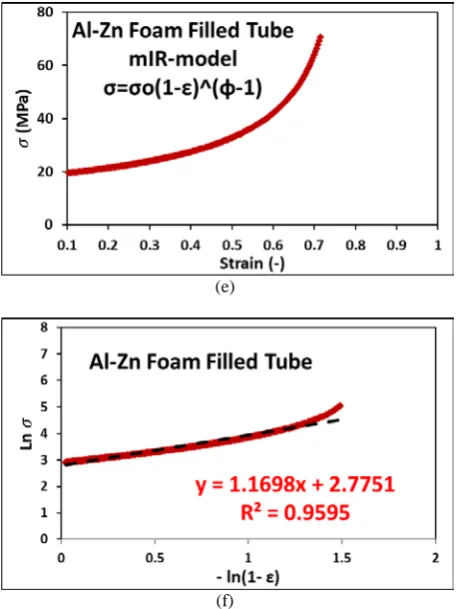
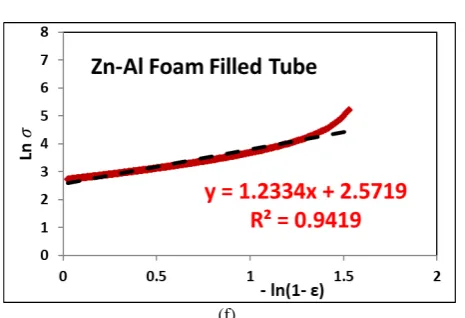
According to the experimental force-displacement curves and parameters presented in Table 2 for the energy absorbents, the stress versus the strain and ln (σ) versus ‒ ln (1 ‒ ε) are plotted in the plastic region for both experimental and modeling approaches. Meanwhile, second derivatives of the force-displacement plots are calculated to comprehend the variations of strain hardening rate. Then, the deformation behavior is characterized by the aforementioned plots, as shown in Figs. 8 up to 15 for Al/F, Zn/F, Al/FT, Zn/FT, Al-Zn/FT, Zn-Al/FT, Al-Zn-Al/FT and Zn-Al-Zn/FT, respectively. The force-displacement plots and their second derivatives are illustrated in images (a) and (b), respectively. Images (c) and (e) exhibit the stress-strain plots for the experimental and modeling approaches, respectively. Further, the parameter R2 in images (d) and (f) represents the coefficient of the determination of the lines fitting the logarithmic plots for the experimental results and mathematical models, respectively.
The compressive force-displacement and stress-strain plots of metallic foams and foam filled tubes can be divided into three regions, namely the elastic, plateau and densification regions, as shown in images (a) and (c) of Figs. 8 up to 11, respectively. The deformation mechanism at the linear elastic stage is the elastic bending of the cell struts and cell walls. The elastic region is followed by yielding and plastic hardening to the initial peak force, which corresponds to the collapse of the weakest cells, and then, by a severe drop in the force, to the plastic plateau stage. At this region, the cells densify, and slight stress fluctuations appear by increasing the displacement over a wide range. Finally, a rapid rise happens in the force with the minimum increment of displacement at the densification stage because the cell walls contact each other. In addition, it can be observed that the presence of the foam filler leads to significantly higher force levels compared with the foam alone, which can be attributed to the interactive effect between the tube wall and the foam filler [2, 5, 8, 12-14].
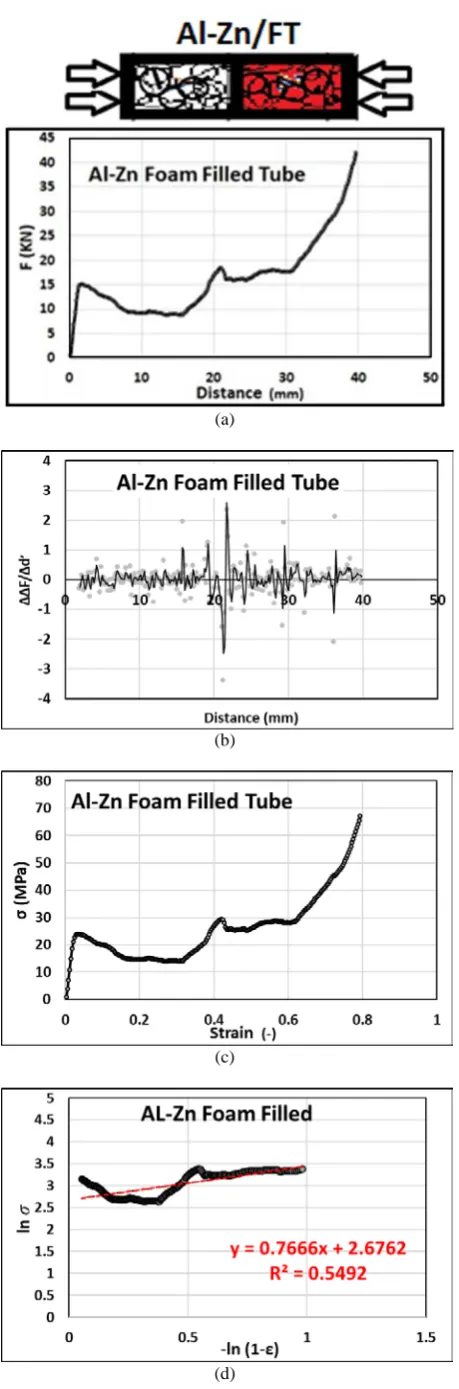
According to images (a) and (c) in Figs. 12 and 13, the force-displacement and stress-strain plots of double-layered foam filled tubes include two distinct plateau
regions implying the plastic deformation of each foam layer. In other words, first the elastic and plateau regions of low density A356 foam layer appear, then the collapse of high density zinc foam layer starts, as also shown in Fig. 3 for Zn-Al/FT. The same trend can be observed in the crushing curves of Al-Zn-Al/FT, as seen in Fig. 14. The first plateau region corresponds to the crushing of two A356 foam layers, and the second plateau region represents the plastic deformation of middle zinc foam layer. Besides, the multi-layered foam filled tubes reveal apparent peaks in their second derivative curves, which indicates the end of the plastic deformation of each foam layer. In the case of Zn-Al/FT, at first, the applied compressive force cannot be absorbed by the high strength zinc foam layer which is in contact with the movable jaw, thereby being mostly transfered to the A356 foam layer. However, in the case of Al-Zn/FT, first, the crushing force is absorbed by the A356 foam layer which is in contact with the movable jaw. Then, it proceeds to the zinc foam layer [16-18].
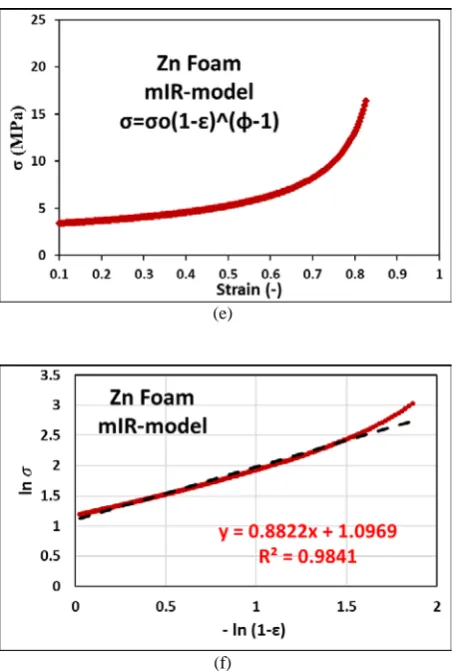
Table 3 presents the strain hardening logarithmic equations for the experimental results and mathematical models with their corresponding R2 values. According to Table 3 and (d) images in Figs. 8 up to 15, there is a linear relationship between the experimental ln (σ) and ‒ ln (1 ‒ε) with mean R2 value of 0.75, except for Al/F (R2 = 0.1319) and Al/FT (R2 = 0.2895). By increasing ln (1 ‒ε), the model-based ln (σ) also increases linearly, and high mean R2 value of 0.92 is obtained, as seen in Table 3 and (f) images in Figs. 8 up to 15. The model validation can be deduced from close coefficients of the logarithmic equations in the experimental and modeling approaches, irrespective of Al/F and Al/FT. In order to evaluate the accuracy of the model better, the σExp. is
plotted against the σModel for the energy absorbents, as
indicate its more brittle behavior compared with the zinc foam due to the more crushing of the brittle dual-phase structure in the cell walls, and also, the nonuniform distribution of the coarse bubbles [1, 5, 8, 20]. Moreover, the stepwise increment of stress and distinct plateau regions in the crushing curves of multi-layered foam filled tubes may be responsible for the inaccurate model of Al-Zn-Al/FT. In fact, with the increase in the density, the metallic foams are less susceptible to bending, and the same hardening behavior as in the dense metal can be expected.
(a)
(b)
(c)
(d)
(e)
(f)
Fig. 8. Uniaxial Plastic deformation behavior of A356 foam,
(a) experimental force-displacement, (b) second derivative of experimental force-displacement, (c) experimental stress-strain, (d) experimental ln (σ) versus – ln (1 – ε),
(a)
(b)
(c)
(d)
(e)
(f)
Fig. 9. Uniaxial plastic deformation of zinc foam, (a)
experimental force-displacement, (b) second derivative of experimental force-displacement, (c) experimental stress-strain, (d) experimental ln (σ) versus – ln (1 – ε), (e) model
-based stress-strain, and (f) model--based ln (σ) versus – ln (1 – ε) plots
(b)
(c)
(d)
(e)
(f)
Fig. 10. Uniaxial plastic deformation of A356 foam filled
tube, (a) experimental force-displacement, (b) second derivative of experimental force-displacement, (c) experimental stress-strain, (d) experimental ln (σ) versus –
ln (1 – ε), (e) model-based stress-strain, and (f) model-based ln (σ) versus – ln (1 – ε) plots.
(a)
(c)
(d)
(e)
(f)
Fig. 11. Uniaxial plastic deformation of zinc foam filled tube,
(a) experimental force-displacement, (b) second derivative of experimental force-displacement, (c) experimental
stress-strain, (d) experimental ln (σ) versus – ln (1 – ε), (e) model-based stress-strain, and (f) model-based ln (σ)
versus – ln (1 – ε) plots.
(a)
(b)
(c)
(e)
(f)
Fig. 12. Uniaxial plastic deformation of A356-zinc foam
filled tube, (a) experimental force-displacement, (b) second derivative of experimental force-displacement, (c) experimental stress-strain, (d) experimental ln (σ) versus – ln
(1 – ε), (e) model-based stress-strain, and (f) model-based ln (σ) versus – ln (1 – ε) plots.
(a)
(b)
(c)
(d)
(f)
Fig. 13. Uniaxial plastic deformation of zinc-A356 foam
filled tube, (a) experimental force-displacement, (b) second derivative of experimental force-displacement, (c) experimental stress-strain, (d) experimental ln (σ) versus – ln
(1 – ε), (e) model-based stress-strain, and (f) model-based ln (σ) versus – ln (1 – ε) plots.
(a)
(b)
(c)
(d)
(e)
(f)
Fig. 14. Uniaxial plastic deformation of A356-zinc-A356
foam filled tube, (a) experimental force-displacement, (b) second derivative of experimental force-displacement, (c) experimental stress-strain, (d) experimental ln (σ) versus – ln
(a)
(b)
(c)
(d)
(e)
(f)
Fig. 15. Uniaxial plastic deformation of zinc-A356-zinc foam
filled tube, (a) experimental force-displacement, (b) second derivative of experimental force-displacement, (c) experimental stress-strain, (d) experimental ln (σ) versus –
ln (1 – ε), (e) model-based stress-strain, and (f) model-based ln (σ) versus – ln (1 – ε) plots.
Table 3. Strain hardening logarithmic equations for the experimental results and mathematical models Sample Experimental Results Mathematical Models
Equations R2 Equations R2
A356/F ln (1–ln (𝜎𝜎) = +0.1965 ε) + 0.6434 0.1319 ln (1–ln (𝜎𝜎) = –1.2018 ε) + 0.1763 0.9847
Z/F ln (1–ln (𝜎𝜎) = –0.6454 ε) + 1.3028 0.7253 ln (1–ln (𝜎𝜎) = –0.8822 ε) + 1.3688 0.9841
A356/FT ln (1–ln (𝜎𝜎) = –0.3099 ε) + 2.6679 0.2895 ln (1–ln (𝜎𝜎) = –1.7008 ε) + 2.4292 0.9157
Z/FT ln (𝜎𝜎) = –0.6806
ln (1–ε) + 3.3385 0.9452
ln (𝜎𝜎) = –1.626
ln (1–ε) + 3.0951 0.899
A356-Z/FT ln (𝜎𝜎) = –0.7666
ln (1–ε) + 2.6762 0.5492
ln (𝜎𝜎) = –1.1698
ln (1–ε) + 2.7751 0.9595
Z-A356/FT ln (𝜎𝜎) = –0.8788
ln (1–ε) + 2.4965 0.5751
ln (𝜎𝜎) = –1.2899
ln (1–ε) + 2.5484 0.8738
A356-Z-A356/FT
ln (𝜎𝜎) = –1.0329
ln (1–ε) + 2.5621 0.9011
ln (𝜎𝜎) = –1.4980
ln (1–ε) + 2.8012 0.9028
Z-A356-Z/FT
ln (𝜎𝜎) = –1.8336
ln (1–ε) + 2.8279 0.7828
ln (𝜎𝜎) = –2.2251
(a)
(b)
(c)
(d)
(e)
(f)
(g)
(h)
Fig. 16.σExp versus σModel based on the mIR model for (a)
A356 foam, (b) zinc foam, (c) A356 foam filled tube, (d) zinc foam filled tube, (e) A356-zinc foam filled tube, (f) zinc-A356 foam filled tube, (g) A356-zinc-A356 foam
In order to take the influence of oscillations on the strain hardening behavior of metallic foams and foam filled tubes into account, a complementary model is developed by adding a sine function to Eq. (6) as follows:
𝜎𝜎
=
𝜎𝜎
0𝜀𝜀
sin(
𝑛𝑛𝑛𝑛𝜀𝜀
) +
𝜎𝜎
0(1
− 𝜀𝜀
)
−𝜌𝜌𝐹𝐹/ 𝜌𝜌𝑆𝑆 (9)Where n is the coefficient indicating the number of oscillations. The complementary model-based stress-strain plots of Zn/F and Al/F are presented in Fig. 17(a) and (b), respectively. In addition, the crushing response of some graded structures, including Al/FT, Zn-Al/FT and Al-Zn-Al with less accurate models, are estimated by applying Eq. (9) to their compressive data. Fig. 18 shows the comparison of the stress-strain plots and stress values between the experiment and the complementary model for metallic foams and mentioned graded structures. It can be observed in the stress-strain plots that the complementary model is in accordance with the experimental results. Furthermore, a linear relationship (y = x) between the σModel and σExp with high R2 values
confirms the high accuracy of the complementary model for metallic foams and multi-layered foam filled tubes. Therefore, the plastic deformation of metallic foams and foam filled tubes can be estimated better by the complementary model. To conclude, the oscillation model can be considered as a good substitution for the uniform model (mIR model) to represent the strain hardening behavior of metallic foams and graded structures as a function of ρF/ρS. However, the present model still needs to be further improvement due to the complex plastic deformation of foam filled tubes.
(a)
(b)
Fig. 17. Comparison of the stress-strain plots between the
experiment and complementary model for zinc foam, and (b) A356 foam.
(a)
(b)
(d)
(e)
(f)
Fig. 18. Comparison of the stress-strain plots and stress
values between the experiment and complementary model for (a, b) Zn foam, (c, d) Zn-Al foam filled tube, (e, f) Al-Zn-Al
foam filled tube.
Energy absorption characteristic is an important technological property of the foams and foam filled structures. In this study, Ea and SEA are considered as the most prominent aspects of the evaluation in the energy absorbents. Ea is identified as the total kinetic energy absorbed during the compression test prior to the
onset of densification. Therefore, Ea can be calculated by
integrating the area under the force-displacement curve up to the densification length (lD) as follows [2,10]:
𝐸𝐸𝑎𝑎=∫ 𝑑𝑑0𝑙𝑙𝐷𝐷 (𝑥𝑥)𝑑𝑑𝑥𝑥 (10)
where lD is measured by the efficiency (η) definition, which is the ratio between the absorbed energy of the real material and ideal absorbent. η (l) is calculated for all points on the force-displacement curve using the following equation [1, 2, 8, 10]:
𝜂𝜂(𝑙𝑙) =∫ 𝐹𝐹0𝑙𝑙𝐷𝐷 (𝑥𝑥)𝑑𝑑𝑥𝑥
max
0≤𝑥𝑥≤𝑙𝑙𝐹𝐹×𝑙𝑙
(11)
Then, the efficiency is plotted against displacement by employing Eq. (11) on the force-displacement plots, as shown in Fig. 19(a), (b) and (c) for Zn/FT, Al-Zn/FT and Al-Zn-Al/FT, respectively. Finally, the intersection of the force-displacement and efficiency-displacement plots is defined as lD.
Fig. 19. Force-displacement and efficiency-displacement
Figure 20 shows the Ea of energy absorbing elements calculated based on Eq. [10] and measured lD values. Moreover, the SEA parameter, which provides a criterion for the comparison of energy absorbents with different masses or densities, can be calculated as follows [11,13]:
𝑆𝑆𝐸𝐸𝐴𝐴=∫ 𝐹𝐹0𝑙𝑙𝐷𝐷 (𝑥𝑥)𝑑𝑑𝑥𝑥
𝜌𝜌 (12) where ρ is ρF for metallic foams and ρEF for graded foam filled tubes. The SEA of energy absorbents calculated based on Eq. (12) are reported in Fig. 21. Zn/FT reveals the maximum Ea (581 J) due to the highest density and strength of the zinc foam compared to the A356 foam or layered filler materials considering the same dimensions and geometry of the tube. The SEA is affected by both Ea and ρ of the structure. The SEA of energy absorbents deteriorates with a significant increase in the foam density. Therefore, the low density A356 foam shows more SEA than the high density zinc foam (87J/(g/cm3) versus 40.7 J/(g/cm3)), and the
maximum SEA is achieved in Al/FT (459.2 J/(g/cm3)).
In the case of double-layered foam filled tubes, the calculated Ea and SEA of Al-Zn/FT (408 J – 231.8 J/(g/cm3)) and Zn-Al/FT (388 J – 220.5 J/(g/cm3)) are
between the corresponding values of Al/FT (349 J – 459.2 J/(g/cm3)) and Zn/FT (581 J – 209.7 J/(g/cm3)). In
fact, the Ea and SEA of single- and multi-layered foam filled tubes are mainly controlled by the density of the constituting foam layers, and the existence of more portions of A356 foam results in smaller Ea and greater SEA. However, a little discrepancy is observed in the triple-layered foam filled tubes. It means that almost small Ea and SEA are found in Al-Zn-Al/FT (266 J – 186 J/(g/cm3)) and Zn-Al-Zn/FT (192 J – 91.4 J/(g/cm3)),
which is mainly associated with their small failure strain and εD in spite of nearly high collapse strength. Therefore, the double-layered structures exhibit superior SEA and crashworthiness over the single-layered zinc and triple-layered foam filled tubes. As a result, the compressive and energy absorption features of multi-layered foam filled tubes can be controlled by changing the number and material of foam layers in a certain geometric structure.
By comparison, Zn/FT shows the highest Ea (581 J), which is 66%, 46% and 154% higher than the mean Ea of single-layered A356, double-layered and triple-layered foam filled tubes, respectively. The highest SEA
(459.2 J/(g/cm3)) is obtained in Al/FT, which is 12%,
10% and 23% higher than the mean SEA of single-layered zinc, double-single-layered and triple-single-layered foam filled tubes, respectively. Consequently, the zinc foam plays a dominant role in adjusting the crash performance and the deformation behavior of graded structures. Although, the SEA decreases by increasing the volume fraction of zinc foam.
Fig. 20. Total energy absorption results of energy absorbents
from the compression tests.
Fig. 21. Specific energy absorption results of energy
absorbents from the compression tests.
4. Conclusions
filled tubes. Besides, the development of the complementary model, 𝜎𝜎=𝜎𝜎0𝜀𝜀sin(𝑛𝑛𝑛𝑛𝜀𝜀) +𝜎𝜎0(1− 𝜀𝜀)−𝜌𝜌𝐹𝐹/𝜌𝜌𝑆𝑆, leads to a more accurate estimation of crushing response considering the stress oscillations, particularly for the A356 foam with high degrees of oscillation and multi-layered structures containing distinct plateau regions. Therefore, the present model is in accordance with the experimental results. The higher density and strength of the zinc foam in contrast with the A356 foam result in the highest total energy absorption of the zinc foam filled tube (581 J) and the highest specific energy absorption of the A356 foam filled tube (459.2 J/(g/cm3). The
compressive properties of multi-layered structures can be controlled by changing the number and the material of the foam layers at constant geometric features. The zinc foam plays a dominant role in adjusting the crash behavior of graded structures, but the use of A356 foam provides superior specific energy absorption.
Acknowledgmts
This work was supported by the Metal Foam Group of Amirkabir University (MFGAU) through Grant No. 110-mir-13951022. The authors are grateful to Rahyaft Advanced Sciences and Technologies Co for their support in casting metal foams.
5. References
[1] M. G. Nava, A. Cruz-Ramirez, M. A. S. Rosales, V. H.
Gutirrez-Perez, A. Sanchez-Martinez: J. Alloys Compd
698 (2017) 1009-1017.
[2] D. K. Rajak, L. A. Kumaraswamidhas, S. Das, S. Senthil
Kumaran: J. Alloys Compd 656 (2016) 218-225.
[3] M. A. Islam, A.D. Brown, P. J. Hazell, M. A. Kader, J.
P. Escobedo, M. Saadatfar, S. Xu, D. Ruan, M. Turner:
J. Alloys Compd 114 (2018) 111-122.
[4] X. Liu, J. Zhang, Q. Fang, H. Wu, Y. Zhang: Int. J.
Impact Eng 110 (2016) 382-394.
[5] A. Heydari Astaraie, H. R. Shahverdi, S. H. Elahi: Trans.
Nonferrous Met. Soc. China 24 (2014) 162-169.
[6] L. Pan, Y. Yang, M. U. Ahsan, D.D. Luong, N. Gupta,
A. Kumar, Predeep K. Rohatgi: Mater. Sci. Eng., A 731
(2018) 413-422.
[7] Y. Sirong, L. Jiaan, L. Yanru, L. Yaohui: Mater. Sci.
Eng., A 457(2007) 325-328.
[8] D. P. Mondal, M.D. Goel, N. Badge, N. Jha, S. Sahu,
A.K. Barnwal: Mater. Des 57 (2014) 315-324.
[9] N. Wang, E. Maire, Y. Cheng, Y. Amani, Y. Li, J.
Adrien, X. Chen: Mater. Charact 138 (2018) 296-307.
[10] Manoj, D. M. Afzal Khan, D.P Mondal: Mater. Sci.
Eng., A 731 (2018) 324-330.
[11] A. G. Hanssen, M. Langseth, O.S. Hopperstad: Int. J.
Impact Eng 24 (2000) 347-383.
[12] A. Baroutaji, M. Sajjia, A-G. Olabi: Thin Walled Struct
118 (2017) 137-163.
[13] J. Bi, H. Fang, Q. Wang, X. Ren: Finite Elem. Anal. Des
46 (2010) 698-709.
[14] C. J. Zhang, Y. Feng, X.B. Zhang: Trans. Nonferrous
Met. Soc. China 20 (2010) 1380-1386.
[15] M. D. Goel: Thin Walled Struct 90 (2015) 1-11.
[16] Y. Hangai, K. Takahashi, T. Utsunomiya, S. Kitahara,
O. Kuwazuru, N. Yoshikawa: Mater. Sci. Eng., A 534
(2012) 716-719.
[17] Y. Hangai, T. Morita, T. Utsunomiya: Mater. Sci. Eng.,
A 696 (2017) 544-551.
[18] Y. Hangai, Y. Oba, S. Koyama, T. Utsunomiya: Metall.
Mater. Trans. A 42 (2011) 3585-3589.
[19] H. Bayani and S.M.H. Mirbagheri: Iran. J. Mater. Form
3 (2016) 38-54.
[20] J. Liu, S. Yu, X. Zhu, M. Wei. Y. Luo, Y. Liu: J. Alloys
Compd 476 (2009) 220-225.
[21] S. M. H. Mirbagheri, H. Vali, H. Soltani, Treatment of
Closed-Cell A356 + 4 wt.% Cu + 2 wt.% Ca Foam and
Its Effect on the Foam Mechanical Behavior, Journal of
Materials Engineering and Performanc 26 (2017) 14–
27.
[22] N. Movahedi1, S. M. H. Mirbagheri, and S. R. Hoseini,
Effect of Foaming Temperature on the Mechanical
Properties of Produced Closed-Cell A356Aluminum
Foams with Melting Method. Met. Mater. Int 20 (2014)
757-763.
[23] S. Mohammad Hossein Mirbagheri, Mohammad Javad
Khajehali, Effect of Fe additive on plastic deformation
for crush-boxes with closed-cell metal foams, Part II:
Al-Composite Foam-Filled brass tubes Compression
Response, Iran. J. Mater. Form 1 (2014) 23-31.
[24] W. F. Hosford, Fundamentals of Engineering Plasticity,
Cambridge University Press, London (2013).
[25] H. Bayani, S. M. H. Mirbagheri, Strain-hardening
during compression of closed-cell Al/Si/SiC + (TiB2 &
Mg) foam, Materials Charactization 113 (2016)
زﺎﺴﻟﺪﻣ
ي
ﻐﺗ
ﯿﯿ
مﺮﻓﺮ
ﺘﺳﻼﭘ
ﯿ
ﮏ
ﻪﻟﻮﻟ
ﺎﻫ
ي
هﺪﺷﺮﭘ
ﺎﺑ
مﻮﻓ
ﺰﻠﻓ
ي
ﺪﻨﭼ
ﻻ
ﯾ
ﻪ
ﻃ
ﯽ
راﺬﮔرﺎﺑ
ي
رﺎﺸﻓ
ي
ﯽﻧﺎﯿﻣار يﺮﻔﻌﺟ ﻦﯿﻣا و ﯽﺤﻟﺎﺻ ﺎﻨﯿﻣ ،يﺮﻗﺎﺑﺮﯿﻣ ﻦﯿﺴﺣﺪﻤﺤﻣ ﺪﯿﺳ
هﺎﮕﺸﻧاد ،يژرﻮﻟﺎﺘﻣ و داﻮﻣ ﯽﺳﺪﻨﻬﻣ هﺪﮑﺸﻧاد ﯽﺘﻌﻨﺻ ﺮﯿﺒﮐﺮﯿﻣا ناﺮﻬﺗ ، ناﺮﻬﺗ ناﺮﯾا ، .هﺪــﯿﮑﭼ
فﺪﻫ
زا
ﺶﻫوﮋﭘ
ﺮﺿﺎﺣ
ﺳرﺮﺑ
ﯽ
رﺎﺘﻓر
ﺗ
ﻐ
ﯿﯿ
ﺮ
مﺮﻓ
ﺘﺳﻼﭘ
ﯿ
ﮏ
و
بﺬﺟ
ژﺮﻧا
ي
ﻪﻟﻮﻟ
ﺎﻫ
ي
ﺮﭘ
هﺪﺷ
ﺎﺑ
مﻮﻓ
ﺎﻫ
ي
ﺰﻠﻓ
ي
لﻮﻠﺳ
ﻪﺘﺴﺑ
،ﮏﺗ
ود
و
ﻪﺳ
ﻻ
ﯾﻪ
ﺖﺳا
.
مﻮﻓ
ﺎﻫ
ي
ﺰﻠﻓ
ي
زا
ﻟآ
ﯿ
ژﺎ
ﻣﻮﻟآ
ﯿﻨ
ﯿ
ﻢ
A356و
ﺰﻠﻓ
ور
ي
ﺺﻟﺎﺧ
ﺪﻨﺘﺴﻫ
ﻪﮐ
ﻪﺑ
شور
ر
ﯾ
ﻪﺘﺨ
ﺮﮔ
ي
ﻬﺗ
ﯿﻪ
هﺪﺷ
دﻮﺑ
.
ﺎﺘﻧ
ﯾ
ﺞ
نﺎﺸﻧ
ﻣ
ﯽ
ﺪﻫد
مﻮﻓ
ﺎﻫ
ي
ﻪﮐ
رﺎﺘﻓر
ﻏ
ﯿ
دﺮﺗﺮ
ﻃ
ﯽ
ﻐﺗ
ﯿﯿ
ﺮ
مﺮﻓ
ﺘﺳﻼﭘ
ﯿ
ﮏ
،ﺪﻧراد
ﻨﺤﻨﻣ
ﯽ
ﺶﻨﺗ
-ﺶﻧﺮﮐ
نآ
ﺎﻫ
زا
ﯾ
ﮏ
عﻮﻧ
ﺎﺗ
ﺑﻊ
ﺎﻤﻧ
ﯽﯾ
و
ﺐﻧﺎﺠﻣ
راد
ﺑ
ﻪ
ترﻮﺻ
𝜎𝜎=𝜎𝜎0(1− 𝜀𝜀)−𝜌𝜌𝐹𝐹/𝜌𝜌𝑆𝑆,
ﭘ
ﯿ
وﺮ
ي
ﻣ
ﯽ
ﺪﻨﮐ
.
ﺎﻤﻧ
ِي
رﺎﮐ
ﺘﺨﺳ
ﯽ
اﯾ
ﻦ
لﺪﻣ
ﻊﺑﺎﺗ
ﻐﺗ
ﯿﯿ
تاﺮ
ﻟﺎﮕﭼ
ﯽ
ﺒﺴﻧ
ﯽ
مﻮﻓ
ﺰﻠﻓ
ي
ﻪﺑ
ﺰﻠﻓ
لﺎﮕﭼ
ﺖﺳا
.
ﺎﻣا
مﻮﻓ
ﺎﻫ
ي
ﮏﺗ
ﻻ
ﯾﻪ
ﯾﺎ
ﺪﻨﭼ
ﻻ
ﯾﻪ
ا
ي
ﻪﮐ
اراد
ي
تﺎﻧﺎﺳﻮﻧ
ﻃ
ﯽ
ﻐﺗ
ﯿﯿ
ﺮ
مﺮﻓ
ﺘﺳﻼﭘ
ﯿ
ﮏ
ﺪﻨﺘﺴﻫ
زا
لﺪﻣ
ﺪﺟ
ﯾﺪ
ﻪﮐ
اراد
ي
ﻊﺑﺎﺗ
ﺳ
ﯿ
ﺳﻮﻨ
ﯽ
ﺖﺳا
ﺑ
ﻪ
ترﻮﺻ
𝜎𝜎=𝜎𝜎0𝜀𝜀sin(𝑛𝑛𝑛𝑛𝜀𝜀) +𝜎𝜎0(1− 𝜀𝜀)−𝜌𝜌𝐹𝐹/𝜌𝜌𝑆𝑆,