A
A
S
S
T
T
A
A
T
T
I
I
S
S
T
T
I
I
C
C
A
A
L
L
S
S
U
U
R
R
V
V
E
E
Y
Y
U
U
P
P
O
O
N
N
T
T
H
H
E
E
S
S
I
I
M
M
I
I
L
L
A
A
R
R
I
I
T
T
I
I
E
E
S
S
O
O
F
F
S
S
T
T
U
U
D
D
E
E
N
N
T
T
S
S
'
'
E
E
V
V
A
A
L
L
U
U
A
A
T
T
I
I
O
O
N
N
O
O
F
F
T
T
H
H
E
E
E
E
D
D
U
U
C
C
A
A
T
T
I
I
O
O
N
N
A
A
L
L
P
P
R
R
O
O
C
C
E
E
S
S
S
S
T
T
i
i
b
b
e
e
r
r
i
i
u
u
-
-
M
M
a
a
r
r
i
i
u
u
s
s
K
K
a
a
r
r
n
n
y
y
a
a
n
n
s
s
z
z
k
k
y
y
,
,
C
C
o
o
r
r
i
i
n
n
a
a
M
M
u
u
ş
ş
u
u
r
r
o
o
i
i
“Tibiscus” University of Timişoara, Romania
Corresponding author: Tiberiu-Marius Karnyanszky, [email protected]
ABSTRACT: The expert system implemented at the “Tibiscus” University of Timisoara, Romania is applied for almost ten years to ensure the quality assessment of the educational process, made by the students at our university using an online web-based application. Our portal allows the evaluation by students, the interpretation of the results and the study of the evolution of the results. We’re using statistical indicators as the average, the mean squared deviations, the class values, the correlations and others. The results of the statistical analysis of the current evaluation are afterwards used on departments to improve the educational methods. However, a statistical survey upon the evolution of the students’ responses throughout their academic course has never been done, so in this paper we present a study on similarities responses as students filed in years of study, to be concluded on academic management measures that it has taken to improve the methods and techniques of teaching and examination.
KEYWORDS: Fisher test, Student test, students' satisfaction, education assessment.
1. INTRODUCTION
Previously ([KM14]), we presented a survey upon the evolution of the B.Sc. students’ satisfaction upon the educational process. As presented in the paper, students’ expectations are fulfilled: more than ¾ of the students are satisfied/very satisfied on the offered conditions: between 2011 and 2014, 78 to 80% of the answers are “good” and “very good. We could also determine that the students’ expectations improve continuously during their academic route: in the same period, 78 to 89% of the answers were “good” and “very good”. The differences between the studying years are low; we concluded that the results are harmonious and reflect a median trend of the students’ opinion.
In [KM15] we also concluded that M.Sc. students’ expectations are fulfilled: more than 75% of the students are satisfied (by answering “good” or “very good”) about the studying conditions: between 2011 and 2015, 85-91% of the freshman answered “good” and “very good”; 88-92% of the 2nd
year students answered “good” and “very good”.
Also, the students’ expectations improved during their academic route: the “good” / ”very good” answers increased from 90 to 93% between 2011 and 2015. In this survey, we tried to follow the evolution of the responses during the standard 3-year B.Sc. studying term, namely to determine if the evolution of students’ answers follows the same trend.
2. MATERIAL AND METHOD
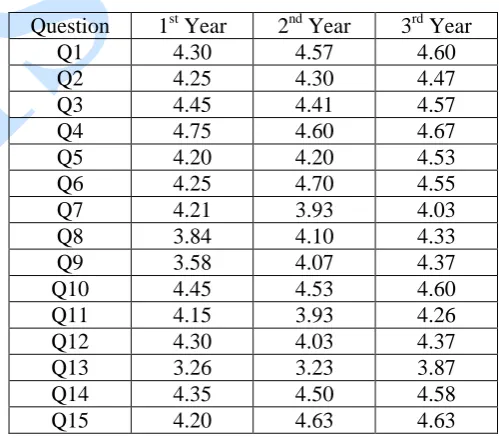
We analyzed the evolution of the means of the student’s answers from the freshman year (2011/2012) to last year (2013/2014), as presented in Table 1 and Figures 1-15.
Question 1st Year 2nd Year 3rd Year
Q1 4.30 4.57 4.60
Q2 4.25 4.30 4.47
Q3 4.45 4.41 4.57
Q4 4.75 4.60 4.67
Q5 4.20 4.20 4.53
Q6 4.25 4.70 4.55
Q7 4.21 3.93 4.03
Q8 3.84 4.10 4.33
Q9 3.58 4.07 4.37
Q10 4.45 4.53 4.60
Q11 4.15 3.93 4.26
Q12 4.30 4.03 4.37
Q13 3.26 3.23 3.87
Q14 4.35 4.50 4.58
Q15 4.20 4.63 4.63
After reviewing, question by questions, the answers of the students, we concluded that the evolution, meaning the improvement (or not) of the students’ satisfaction regarding the educational process, follows 3 patterns:
Anale. Seria Informatică. Vol. XIV fasc. 2 – 2016
Annals. Computer Science Series. 14th Tome 2nd Fasc. – 2016 124
Figure 1: Evolution of Q1 answers
Figure 2: Evolution of Q2 answers
Figure 3: Evolution of Q3 answers
Figure 4: Evolution of Q4 answers
Figure 5: Evolution of Q5 answers
Figure 6: Evolution of Q6 answers
Figure 7: Evolution of Q7 answers
Figure 8: Evolution of Q8 answers
Figure 9: Evolution of Q9 answers
Figure 10: Evolution of Q10 answers
Figure 11: Evolution of Q11 answers
Figure 12: Evolution of Q12 answers
4 4.2 4.4 4.6 4.8
2011 2012 2013
Q1
3.8 4 4.2 4.4 4.6
2011 2012 2013
Q2
4.3 4.4 4.5 4.6
2011 2012 2013
Q3
4.5 4.6 4.7 4.8
2011 2012 2013
Q4
4 4.1 4.2 4.3 4.4 4.5
2011 2012 2013
Q5
4 4.2 4.4 4.6 4.8
2011 2012 2013
Q6
3.6 3.8 4 4.2 4.4
2011 2012 2013
Q7
3.4 3.6 3.8 4 4.2 4.4
2011 2012 2013
Q8
0 2 4 6
2011 2012 2013
Q9
4.3 4.4 4.5 4.6 4.7
2011 2012 2013
Q10
3.6 3.8 4 4.2 4.4
2011 2012 2013
Q11
3.8 4 4.2 4.4
2011 2012 2013
Figure 13: Evolution of Q13 answers
Figure 14: Evolution of Q14 answers
Figure 15: Evolution of Q15 answers
2) Some of the answers show a minimum in the 2nd year but go up at a higher average in the last year: questions Q3, Q11, Q12, Q13; 3) Some of the answers show a minimum in
the 2nd year but go up at a lower average in the last year: questions Q4 and Q7.
The main conclusion about the evolution of answers is that the general trend shows the continuous growth of students’ satisfaction upon the educational process powered by the faculty.
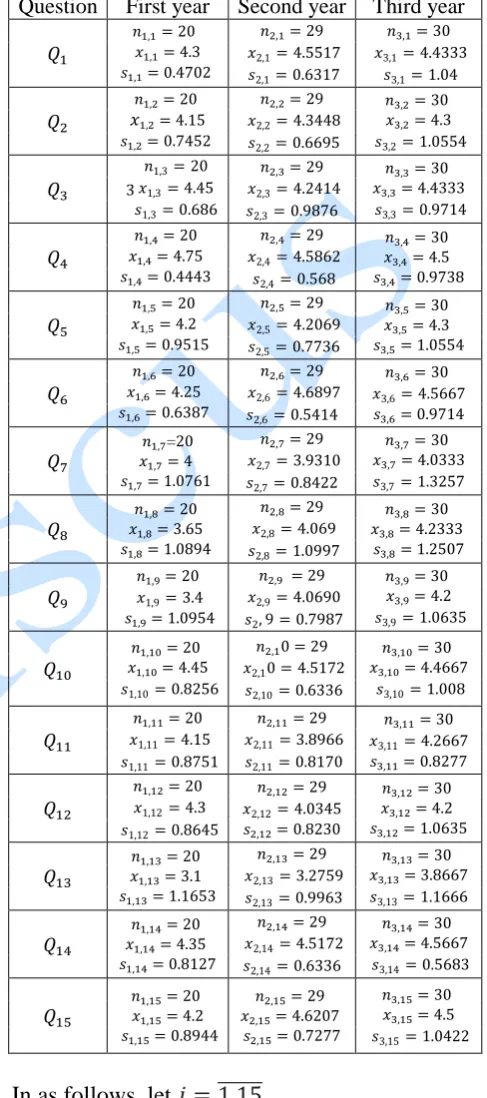
However, this conclusion bases only on the evolution of the medium value of the student’s answers. To obtain a better (statistical) appraisal on the changes between the responses of students in the first year with those in 2nd year and the changes between the responses of students in the 2nd year with those in 3rd year, we apply several times (for each question), a test to compare the averages of two populations ([SP09]). Here, a population is represented by all students of a year. Because the population variances, namely , , , , are unknown and the three sample size (for each question) are less or equal to 30, we first apply a Fisher test to determinate if they are equal or not, and then we apply a Student test with a confidence level of test of . In order to apply this test, we need to compute the average, the standard deviation and the sample size for each
question and each year in part. The results are given in Table 2 bellow.
Table 2. The sample size, the mean and the standard deviation for each question and each year in part
Question First year Second year Third year
=
In as follows, let
We establish the statistical hypothesis of the
Fisher test that will be verified:
or
: The null
hypothesis under which the variances of the
two populations are equal.
or
:
The
alternative hypothesis under which the
2.53 3.5 4
2011 2012 2013
Q13 4.2 4.3 4.4 4.5 4.6
2011 2012 2013
Q14 3.8 4 4.2 4.4 4.6 4.8
2011 2012 2013
Anale. Seria Informatică. Vol. XIV fasc. 2 – 2016
Annals. Computer Science Series. 14th Tome 2nd Fasc. – 2016 126
variances of the two populations are not
equal.
Then, using the formula
such that
F
c≥1
(or
) we find out the computed value of
the Fisher test.
From the statistical tables relating Fisher
distribution fo
r a confidence level of 95% (α=0.05),we determine the critical value of the Fisher test. The results of the Fisher test are given in Table 2 (bellow).
Table 3. The results of Fisher test
Question Computed value Critical value Conclusions
or
Computed value Critical value Conclusions
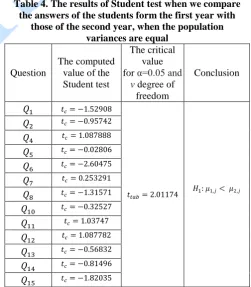
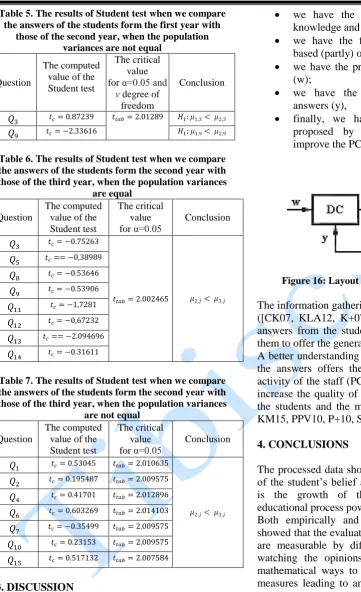
Now we can apply the Student test. First, we formulate the null hypothesis under which the averages of the two populations are equal ( or ) and the alternative hypothesis under which the averages of the first population is less then the average of the second one ( or ). The computed value of the Student test, when the population variances are equal (Table 4, Table 6), uses the following formulas:
The computed value of the Student test, when the population variances are not equal (Table 5, Table 7), uses the formulas:
Table 4. The results of Student test when we compare the answers of the students form the first year with
those of the second year, when the population variances are equal
Question
The computed value of the Student test
The critical value for α=0.05 and
vdegree of freedom
Conclusion
Table 5. The results of Student test when we compare the answers of the students form the first year with
those of the second year, when the population variances are not equal
Question
The computed value of the Student test
The critical value for α=0.05 and
vdegree of freedom
Conclusion
Table 6. The results of Student test when we compare the answers of the students form the second year with those of the third year, when the population variances
are equal
Question
The computed value of the Student test
The critical value for α=0.05
Conclusion
Table 7. The results of Student test when we compare the answers of the students form the second year with those of the third year, when the population variances
are not equal
Question
The computed value of the Student test
The critical value for α=0.05
Conclusion
3. DISCUSSION
We assumed that a standard system of evaluation and quality assurance follows the operating rules of a standard management system (see Figure 16):
we have the educational process (PC) we need to improve;
we have the quality management system which tracks the PC working (DC);
we have the inputs of the system (v): students and teachers;
we have the results of the process (z): knowledge and abilities;
we have the feedback of the process (r) based (partly) on student’s evaluation;
we have the principles of quality assurance (w);
we have the interpretation of student’s answers (y),
finally, we have the concrete measures proposed by the faculty leadership to improve the PC functionality (u).
Figure 16: Layout of a management system
The information gathering bases on an expert system ([CK07, KLA12, K+07, TCS08]) that collects the answers from the students ([Fur12]) and processes them to offer the general trends of the respondents. A better understanding and a better interpretation of the answers offers the best ways to improve the activity of the staff (PC in above figure) in order to increase the quality of the knowledge transferred to the students and the methods of teaching ([KM14, KM15, PPV10, P+10, Sko10]).
4. CONCLUSIONS
The processed data shows that the general tendency of the student’s belief about the quality of teaching is the growth of their satisfaction upon the educational process powered by the faculty.
Both empirically and by statistical methods we showed that the evaluation and the quality assurance are measurable by different means (in this case, watching the opinions of students) so there are mathematical ways to follow and to translate into measures leading to an increase in performance of teaching.
REFERENCES
[CK07] O. Crista, T. M. Karnyanszky – Application for Evaluation of the Professional Competencies of the
Teaching Staff, Anale. Seria
Anale. Seria Informatică. Vol. XIII fasc. 2 – 2015
Annals. Computer Science Series. 13th Tome 2nd Fasc. – 2015 128
[Fur12] R. Füreder – Quality Assurance through Internal Program Evaluation,
E” Era & Higher Education,
Proceedings of the 7th International Conference Quality Management in Higher Education, Austrian Computer Society, Viena, 2012, pp. 273-280.
[KM14] T. M. Karnyanszky, C. Muşuroi – A Statistical Survey upon the Evolution of the Students’ Satisfaction Regarding the Educational Process, Anale. Seria Informatica, vol. XII, fasc. 2, pp. 71-77, 2014.
[KM15] T. M. Karnyanszky, C. Muşuroi – A Statistical Survey upon the M.Sc. Students’ Satisfaction Regarding the Educational Process, Anale. Seria Informatica, vol. XIII, fasc. 2, pp. 80-87, 2015.
[KLA12] T. M. Karnyanszky, L. D. Lacrămă, S. A. Apostol – Computer Aided Assessment of Students’ Satisfaction Regarding the Educational Process, E” Era & Higher Education, Proceedings of the 7th International Conference Quality Management in Higher Education, Austrian Computer Society, Viena, 2012, pp. 39-48.
[K+07] T. M. Karnyanszky, L. D. Lacrămă, L. Luca, I. Iacob – Teacher’s Evaluation - a Component of Quality
Assessment System, Anale. Seria
Informatica, vol. VI, pp. 107-112, 2007.
[K+10] T. Karnyanszky, A. Fortiş, O. Crista, D. Lacrămă – Computer Aided Management of the Teaching Staff Assessment, Proceedings of the 6th International Seminar on Quality Management in Higher Education, Book 1, pp. 87-90, 2010.
[PPV10] A. Purcarea, I. Purcarea, S. Visan – The Analysis of the Quality Assurance System at the Faculty of Commerce within Bucharest Academy of Economic Studies, in the View of the Quality Culture, Proceedings of the 6th International Seminar on Quality Management in Higher Education, Book 1, pp. 303-306, 2010.
[P+10] S.F. Popescu, C. Stroe, E. Militaru, D. Radu – Assessment of the Quality of
Educational Services in Higher
Education through the Survey of Students’ Perceptions, Proceedings of the 6th International Seminar on Quality Management in Higher Education, Book 2, pp. 211-214, 2010.
[Sko10] M. M. Skok – Values of Teachers and
Students and Quality of Higher
Education, Proceedings of the 6th International Seminar on Quality Management in Higher Education, Book 1, pp. 339-342, 2010.
[SP09] O. Saierli, L Pater – Statistică.
Aplicaţii economice, Ed. Eubeea,
Timişoara, 2009, ISBN: 978-973-673-168-6.