www.ann-geophys.net/29/181/2011/ doi:10.5194/angeo-29-181-2011
© Author(s) 2011. CC Attribution 3.0 License.
Annales
Geophysicae
Communica
tes
Thermospheric vorticity at high geomagnetic latitudes from
CHAMP data and its IMF dependence
M. F¨orster1, S. E. Haaland2,3, and E. Doornbos4
1GFZ German Research Centre for Geosciences, Helmholtz Centre Potsdam, Germany 2Max-Planck-Institut f¨ur Sonnensystemforschung, Katlenburg-Lindau, Germany 3Department of Physics and Technology, University of Bergen, Norway
4Delft Institute for Earth Observation and Space Systems (DEOS), Delft, The Netherlands
Received: 9 September 2010 – Revised: 11 January 2011 – Accepted: 18 January 2011 – Published: 21 January 2011
Abstract. Neutral thermospheric wind pattern at high lati-tudes obtained from cross-track acceleration measurements of the CHAMP satellite above both polar regions are used to deduce statistical neutral wind vorticity distributions and were analyzed in their dependence on the Interplanetary Magnetic Field (IMF). The average pattern confirms the large duskside anticyclonic vortex seen in the average wind pattern and reveals a cyclonic vorticity on the dawnside, which is al-most equal in magnitude to the duskside minimum. The outer shape of the vorticity pattern agrees approximately with the outer boundary of region-1 currents in the well-known ave-rage current distributions of Iijima and Potemra (1976). The IMF dependence of the vorticity pattern resembles the char-acteristic FAC and ionospheric plasma drift pattern known from various statistical studies obtained under the same sort-ing conditions.
Keywords. Ionosphere (Ionosphere-atmosphere inter-actions) – Magnetospheric physics (Magnetosphere-ionosphere interactions) – Meteorology and atmospheric dynamics (Thermospheric dynamics)
1 Introduction
It has long been known that the high-latitude thermospheric wind is governed by solar wind conditions, in particular by direction and strength of the IMF (Rees and Fuller-Rowell, 1989; Killeen et al., 1995). It is generally accepted that this coupling occurs by means of ion drag between iono-spheric ions set in motion by solar wind induced magneto-spheric convection and thermomagneto-spheric neutrals. In the clas-sical magnetosphere-ionosphere-thermosphere (M-I-T) cou-pling theory (reviewed, e.g., by Cowley, 2000), the iono-sphere/thermosphere end is treated as a height-integrated
Correspondence to: M. F¨orster
boundary of the magnetosphere, where field-aligned cur-rent (FAC) systems mediate stress and energy with the magnetosphere-magnetosheath current generation system.
On the other hand, the thermospheric winds move the con-ducting ionized layers across the geomagnetic field lines, re-sulting in a neutral wind dynamo effect that contributes to the overall electrodynamics of the coupled system (Blanc and Richmond, 1980). At the same time, the relative motion between neutrals and ionized particles will cause frictional (or Joule) heating (Killeen et al., 1984; Vasyliunas and Song, 2005), which complement thermal drivers caused by solar EUV heating and energetic particle precipitation. The cou-pled M-I-T system will adjust the various driving processes to result in the plasma convection and thermospheric wind pattern, which we observe. One way to address questions to the complex dynamics of the coupling is nowadays more and more the use of first-principle global numerical models as, e.g., in the studies of Lu et al. (1995); Peymirat et al. (2002); Ridley et al. (2003).
Siscoe and Siebert (2006) and Vasyliunas (2007) have recently pinpointed an indirect mechanism involving the region-1 FAC system and the geomagnetic dipole which in-creases the drag on the thermosphere nearly an order of mag-nitude over the direct drag mechanism. Vasyliunas (2007) compares this Lorentz force mechanism as an analog to me-chanical leveraging and calls it the meme-chanical advantage of the magnetosphere in the M-I-T system. TheJ×B force acting against the solar wind at the high-altitude end of the region-1 current loop is transmitted to the Earth as aJ×B force acting on the thermosphere (Siscoe, 2006).
collisionless magnetosphere to the highly collisional iono-sphere/thermosphere system. They showed, amongst other things, that the acceleration of the neutral wind is fastest at F-region heights, where, in the absence of purely neutral stresses, plasma and neutral flows can become equal in tens of minutes to hours.
Newly developed sensitive triaxial accelerometers on-board satellites like that of the recent CHAMP mission of-fer relatively precise in-situ measurements of thermospheric mass density and cross-track wind along the orbit. The com-prehensive CHAMP data set and the novel methodology of its data analysis as elaborated in Sect. 2 allow detailed stud-ies of the high-latitude thermospheric wind behaviour at F-region height like those of the DE-2 mission about two so-lar cycles earlier (Killeen and Roble, 1988; Killeen et al., 1995; Thayer and Killeen, 1991). The novelty of our study, based on well-founded statistics, consists in the first system-atic analysis of the thermospheric vorticity in polar regions of both hemispheres in dependence on the IMF orientation, which is presented in Sect. 3. We provide a short discussion of our findings in the final Sect. 4 and conclude this first, preliminary communication with a short r´esum´e.
2 Data
The CHAllenging Minisatellite Payload (CHAMP), which is managed by the GFZ German Center of Geosciences in Potsdam, was launched in summer 2000 into a near-circular near-polar orbit at∼460 km with an inclination of∼87.3◦. During the years of interest for this study, 2002 and 2003, its orbital altitude had decayed to about 400 km.
One key scientific instrument onboard CHAMP is the tri-axial accelerometer. It is located at the spacecraft’s center of mass and effectively samples the in situ acceleration with an accuracy of∼3×10⁻⁹m s−2(Doornbos et al., 2010). From the air drag observations, thermospheric mass density and cross-track neutral wind data have been obtained using a sim-plified methodology as described by Liu et al. (2006). This method neglects lift and sideways forces on the spacecraft or requires that these forces are modeled and removed from the acceleration beforehand, as it was done later by Sutton et al. (2007), who named it a “dual-axis method”.
Using these early cross-track wind estimations, statistical patterns of the high-latitude thermospheric wind for the year 2003 and its dependence on IMF orientation were already obtained by F¨orster et al. (2008). They showed the IMF de-pendence on a qualitative level only by means of wind vector array patterns and revealed the systematic cross-polar wind amplitude variation with IMF By andBz. Due to the
sim-plified method used, the estimated wind magnitudes were larger by about 40% on average in this previous study, al-though based on the same primary accelerometer data set. The overall average of the wind magnitude at geomagnetic
latides>80◦ was∼500 m s−1(cf. F¨orster et al., 2008, Ta-bles 1 and 2) versus∼360 m s−1for the present study.
This study uses a newly calibrated CHAMP data set, which resulted from a recent study, funded by the ESA’s General Studies Program, where an improved methodology of neutral wind determination was implemented. The new method employs a sophisticated iterative algorithm for deter-mining density and the crosswind component simultaneously from multiaxis accelerometer measurements. It makes use of detailed numerical models of the spaceraft’s surface interac-tion with various radiainterac-tion sources and aerodynamic forces (Doornbos et al., 2010).
The IMF values at the frontside magnetopause are deduced from time shifted data of the Advanced Composition Ex-plorer (ACE) spacecraft, using the phase front propagation technique (Weimer et al., 2003) in a slightly modified ver-sion, that is based on constrained minimum variance analy-ses of the IMF (Haaland et al., 2006). The procedure of sort-ing for specified IMF directions (clock angle sectors) and the bias value filtering of solar wind data for stable IMF condi-tions has been described in the companion papers of Haa-land et al. (2007) and F¨orster et al. (2007). Here, we use the same methodology with the same bias value (≥0.96) thresh-old as for these magnetospheric Cluster/EDI plasma convec-tion studies and as in the preceding high-latitude wind anal-ysis of F¨orster et al. (2008).
Likewise, we used magnetic coordinates because of the strong geomagnetic control of the high-latitude thermo-sphere dynamics, which has been shown since the early satel-lite observations of thermospheric neutral wind as, e.g., by Hays et al. (1984). The pre-processed accelerometer data at 10-s intervals were binned into a concentric grid of magnetic local time (MLT) versus magnetic latitude with characteristic squarish bin sizes of∼5×10⁴km2(2◦width in latitude).
CHAMP’s precession rate allows a full data coverage of all MLTs within about 131 days. Global patterns of the high-latitude neutral wind are therefore always statistical in nature, with minimum time intervals of about three months and some interference between MLT and seasonal variations. The 2-year interval 2002–2003 of this study has been se-lected to ensure good coverage over the seasons and for each IMF sector. The moderate to high solar activity condi-tions ensured high drag acceleracondi-tions on CHAMP, resulting in more accurate wind estimates than at lower solar activity in later years (Doornbos et al., 2010).
3 Thermospheric vorticity
CHAMP 01 Jan 2002 - 31 Dec 2003 South Hemisphere
> 500 points
> 750 points > 1000 points
> 1250 points
> 1500 points
> 1750 points
> 2000 points
80 70 60
00 MLT
06 12
18
400 m/s
-0.6 -0.4 -0.2 0.0 0.2 0.4 0.6
vorticity (mHz) min/max: -0.5251 0.4138 (mHz)
80 70 60
00 MLT
06 12
[image:3.604.56.278.66.518.2]18
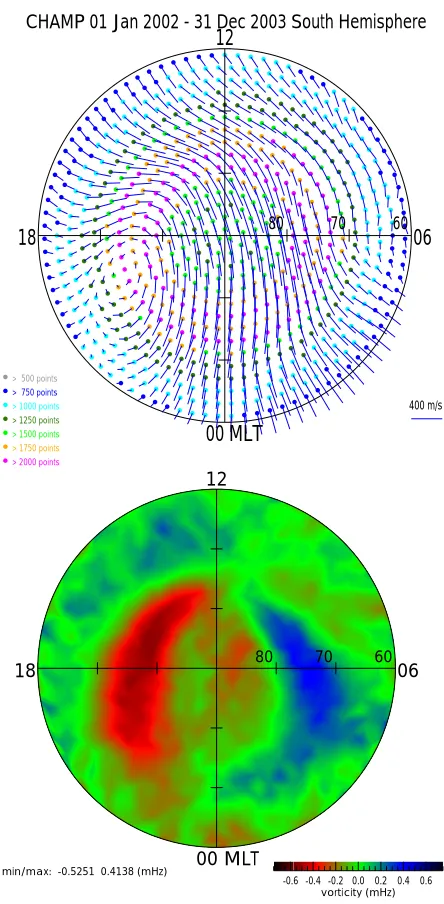
Fig. 1. Average statistic thermospheric wind pattern at∼400 km
height over the South polar hemisphere obtained from CHAMP ac-celerometer data of the whole years 2002 and 2003. The MLT ver-sus magnetic latitude dials have an outer boundary of 60◦. The neutral wind direction and magnitude are shown in the upper panel by small vectors with the origin in the dots at the bin’s position. The bottom panel shows the vorticity pattern of the horizontal wind vec-tors. Negative values (red) indicate a clockwise, positive (blue) a counterclockwise circulation according to the colour bar at the bot-tom. Minimum and maximum values are indicated there as well.
[image:3.604.318.533.69.293.2]which has been deduced from this circulation pattern by ap-plying Stoke’s theorem to each bin, similar to the study of Sofko et al. (1995). It approximates the vorticityω across each bin’s surface with the integrated flow along the closed path at its boundary to the neighbouring grid cells. Unlike the almost oppositely directed, namely magnetic field-aligned
Fig. 2. Same thermospheric vorticity pattern as in Fig. 1, bottom
panel, overlayed with the well-known summary of average distribu-tion and flow direcdistribu-tion of large-scale field-aligned currents, taken from the paper of Iijima and Potemra (1976, Fig. 6).
plasma flow vorticity of Sofko et al. (1995) or Chisham et al. (2009), we define the horizontal wind vorticity with re-spect to the radial or locally upward direction similar to, e.g., Thayer and Killeen (1991) with positive values (blue) rep-resenting cyclonic (counter-clockwise) rotation and negative (red) for anticyclonic (clockwise) rotation.
The high-latitute neutral wind vorticity pattern in Fig. 1 shows the well-known large duskside anticyclonic rotation with a minimum value of −0.53 mHz. The dawnside cy-clonic vorticity is slightly smaller (about 20%) in magnitude for the overall average with a maximum value of 0.41 mHz and follows in shape the other semi-circle of the auroral belt. The two symmetric crescent-shaped vorticity areas are slightly turned clockwise with respect to the noon-midnight meridian and a comparison with the wind vector pattern in the upper panel shows their different quality. The duskside vorticity is due to shear motion forming the large dusk vor-tex, while the dawnside vorticity represents a slight curva-ture on the large background wind circulation. The Northern Hemisphere vorticity pattern (not shown) is similar in shape, but slightly more intense with minimum/maximum values of
−0.75 mHz and 0.67 mHz for the dusk and dawn vorticity, respectively.
Sector 0 : Bz+
min/max: -0.6076 0.3888 (mHz) 80 70 60
Sector 1 : Bz+/By+
min/max: -0.6950 0.5033 (mHz) 80 70 60
Sector 2 : By+
min/max: -0.7213 0.5116 (mHz) 80 70 60
Sector 3 : Bz-/By+
min/max: -0.8019 0.5535 (mHz) 80 70 60
Sector 4 :
Bz-min/max: -0.7246 0.6709 (mHz) 80 70 60
Sector 5 :
Bz-/By-min/max: -0.7584 0.7582 (mHz) 80 70 60
Sector 6 :
By-min/max: -0.7343 0.4344 (mHz) 80 70 60
Sector 7 :
Bz+/By-min/max: -0.7399 0.5078 (mHz) 80 70 60
CHAMP accelerometer
South Polar Region
2002 / 2003
[image:4.604.142.470.68.423.2]-0.6 -0.4 -0.2 0.0 0.2 0.4 0.6
vorticity (mHz)
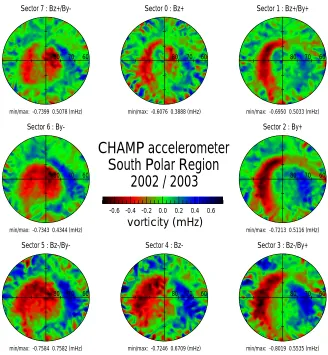
Fig. 3. Average thermospheric vorticity patterns, sorted for 8 distinct sectors of IMF orientation. Each sector comprises 45◦of IMF clock
angle range centered around the direction indicated on top of each panel. The data are for the same time interval, presented in the same magnetic latitude/MLT coordinates and colour scale as in Fig. 1, bottom panel. Minimum and maximum values for the latitude range>70◦ are indicated below each dial.
including the gaps of the Harang discontinuity region near and prior to midnight as well as a prenoon interval within the cusp region.
Figure 3 specifies the vorticity patterns in dependence on IMF orientation. The eight sectors represent average neu-tral wind vorticities for separate IMF ranges, each 45◦wide, around IMF directions indicated on top of each dial. The ave-rage magnitude increases withBzturning southward and be-comes largest forBz−(sector 4), while the vorticity
magni-tudes are smallest and least in latitudinal extent forBz+
(sec-tor 0), where even an indication of a four-cell structure at high dayside latitudes can be noticed.
A large round vorticity cell on the duskside forms for By− (sectors 5–7), while it is “crescent-shaped” under
By+ conditions (sectors 1–3), where the dawnside cell
oc-cupies a larger “round-shaped” region. The magnitude of the dawn and dusk side vorticity peaks are about the same for sectors 4 and 5, i.e. for southward IMF and towardBy−,
while the duskside vorticity magnitude exceeds the dawnside positive vorticity values everywhere else. The patterns are
mirror-symmetric with respect to IMFBy for the Northern
Hemisphere (not shown), where the average magnitudes are generally larger.
The small-scale heterogeneous structures at lower lati-tutes, primarily on the dayside (<70◦ magnetic latitude), are obviously artefacts of the data sampling. They ap-pear because MLT variations interfere with seasonal varia-tions and short-term storm intervals impress with “disturbed” winds (in magnitude and direction) during limited MLT in-tervals. Nevertheless, the vorticity patterns in dependence on IMF orientation dominate at higher latitudes and resemble the characteristic FAC (cf., e.g., Weimer, 2001; Papitashvili et al., 2002) and/or plasma drift patterns (Ruohoniemi and Greenwald, 2005; Haaland et al., 2007).
4 Discussion and conclusion
data of the CHAMP satellite. It shows the strong dependence of the thermospheric wind at F-region heights (∼400 km) on the IMF conditions. These patterns confirm previous find-ings based on early satellite data in the 1980s (e.g., Killeen and Roble, 1988; Killeen et al., 1995), but can now rest upon a much broader statistical base due to the good coverage of the CHAMP data. This allowed for the first time a systematic analysis of the solar wind and IMF dependences with respect to the thermospheric vorticity pattern at high geomagnetic latitudes.
The vorticity map of the average velocity pattern (Fig. 1) compares quite well to the pattern deduced from DE-2 mea-surements in the winter months November through Jan-uary of 1981–1983 with comparable solar activity condi-tions (Thayer and Killeen, 1991). The magnitudes for their quiet (Kp≤3) case are close to our values at the Southern Hemisphere, while our northern values are slightly above their active geomagnetic condition’s case at Northern Hemi-sphere winter. Averaging over seasonal effects, we have ob-servational evidence for hemispheric differences which are most likely due to the different geographic-geomagnetic off-set (F¨orster et al., 2008), or even due to different patterns of geomagnetic flux densities.
It was noted already in earlier studies, that the anticy-clonic dusk side vortex of the average thermospheric circu-lation is almost invariably stronger than the cyclonic vortex associated with the dawn side ion convection cell (Killeen and Roble, 1988). These observations were accompanied by comprehensive theoretical-numerical studies (e.g. Rees and Fuller-Rowell, 1989), which ascribe this difference to the ef-fects of the Coriolis and centrifugal forces, which tend to maintain the dusk side anticyclonic vorticity. Indications for hemispheric differences of the average vorticity magnitude, however, which are presented independend of seasonal ef-fects, are shown here to our knowledge for the first time.
The variation of the vorticity pattern with IMFByandBz
(Fig. 3) strongly resembles the corresponding pattern of the plasma drift (e.g., Ruohoniemi and Greenwald, 2005; Haa-land et al., 2007) and FACs (e.g. Weimer, 2001; Papitashvili et al., 2002). Additional to the strong changes of extent, shape and position of the dusk and dawn side circulation cells with the IMF orientation, there is also a systematic variation in the ratio of their maximum amplitudes within the cells. The peak values vary stronger for the cyclonic dawn cell than for the anticyclonic dusk cell and they are nearly equal for Bz−/By−(sectors 4–5) at the Southern Hemisphere (being
approximately mirror symmetric with respect to IMF Byat
the Northern). This comes along with the largest cross-polar thermospheric wind amplitudes over the central polar cap for this IMF orientation, as shown by F¨orster et al. (2008). But more extended analyses of the dependences and comparisons of the plasma convection, FAC, and neutral wind pattern in dependence on solar wind and IMF conditions are beyond the scope of the present paper. Detailed studies are in progress and will be published in a more comprehensive paper.
Statistical patterns of high-latitude magnetic field-aligned plasma vorticity with the same sorting for 8 sectors of IMF orientation have been deduced recently also from Super-DARN measurements (Chisham et al., 2009). They show the close affinity to corresponding FAC pattern, despite of smaller variations due to seasonal (ionospheric conductance) effects. Chisham and Freeman (2010) investigated in a sub-sequent study the probability density function of ionospheric vorticity measurements and showed that it is best modelled by the q-exponential distribution across most of the polar ionosphere, except in the dayside region 1 current region, where the Weibull distribution provides the best model. They interpret this as an indication for the relative importance of different physical mechanisms affecting the ionospheric vorticity in the various regions with a dominance of con-vective (barotropic) effects within the dayside region 1 and baroclinic vorticity elsewhere (Chisham and Freeman, 2010). The clear-cut neutral wind vorticity regions and their obvious IMF dependence indicate a strong relevance of the neutral wind for this ionospheric vorticity behaviour.
For a deeper understanding of the M-I-T system, adequate numerical models are indispensable due to the complexity and nonlinearity of its coupling processes. This concerns first of all global, time-dependent first-principal MHD mo-dels like, e.g., that of Lu et al. (1995); Ridley et al. (2003), but also the recently developed three fluid theory and mod-elling are very promising (Song et al., 2009).
The long data series of the new generation polar-orbiting LEO satellites with accelerometers onboard like CHAMP, GRACE and the forthcoming Swarm mission will allow much more detailled studies of the high-latitude thermo-sphere dynamics and its complex interaction with magneto-spheric configurations under varying solar wind conditions.
Acknowledgements. Work at GFZ German Research Centre for
Geosciences Potsdam (M. F.) was supported by Deutsche Forschungsgemeinschaft (DFG). Research at the University of Bergen (S.E.H.) was supported by the Norwegian Research Coun-cil. We thank the ACE SWEPAM and MAG instrument teams and the ACE Science Center for providing the ACE data. The CHAMP mission is sponsored by the Space Agency of the German Aerospace Center (DLR) through funds of the Federal Ministry of Economics and Technology, following a decision of the German Federal Parliament (grant code 50EE0944). The data retrieval and operation of the CHAMP satellite by the German Space Operations Center (GSOC) of DLR is acknowledged.
Topical Editor C. Jacobi thanks M. Freeman for his help in eval-uating this paper.
References
Blanc, M. and Richmond, A. D.: The ionospheric disturbance dy-namo, J. Geophys. Res., 85, 1669–1686, 1980.
Chisham, G., Freeman, M. P., Abel, G. A., Bristow, W. A., Mar-chaudon, A., Ruohoniemi, J. M., and Sofko, G. J.: Spatial distri-bution of average vorticity in the high-latitude ionosphere and its variation with interplanetary magnetic field direction and season, J. Geophys. Res., 114, A09301, doi:10.1029/2009JA014263, 2009.
Cowley, S. W. H.: Magnetosphere–Ionosphere Interactions: A Tu-torial Review, in: Magnetospheric Current Systems, edited by: Ohtani, S.-I., Fujii, R., Hesse, M., and Lysak, R. L., vol. 118 of Geophysical Monograph, pp. 91–106, American Geophysical Union, 2000.
Doornbos, E., van den IJssel, J., L¨uhr, H., F¨orster, M., and Kop-penwallner, G.: Neutral density and crosswind determination from arbitrarily oriented multi-axis accelerometers on satellites, J. Spacecraft Rockets, 47, 580–589, doi:10.2514/1.48114, 2010. F¨orster, M., Paschmann, G., Haaland, S. E., Quinn, J. M., Tor-bert, R. B., Vaith, H., and Kletzing, C. A.: High-latitude plasma convection from Cluster EDI: variances and solar wind corre-lations, Ann. Geophys., 25, 1691–1707, doi:10.5194/angeo-25-1691-2007, 2007.
F¨orster, M., Rentz, S., K¨ohler, W., Liu, H., and Haaland, S. E.: IMF dependence of high-latitude thermospheric wind pattern de-rived from CHAMP cross-track measurements, Ann. Geophys., 26, 1581–1595, doi:10.5194/angeo-26-1581-2008, 2008. Haaland, S. E., Paschmann, G., and Sonnerup, B. U. ¨O.: Comment
on “A new interpretation of Weimer et al.’s solar wind propaga-tion delay technique” by Bargatze et al., J. Geophys. Res., 111, A06102, doi:10.1029/2005JA011376, 2006.
Haaland, S. E., Paschmann, G., F¨orster, M., Quinn, J. M., Torbert, R. B., McIlwain, C. E., Vaith, H., Puhl-Quinn, P. A., and Klet-zing, C. A.: High-latitude plasma convection from Cluster EDI measurements: method and IMF-dependence, Ann. Geophys., 25, 239–253, doi:10.5194/angeo-25-239-2007, 2007.
Hays, P. B., Killeen, T. L., Spencer, N. W., Wharton, L. E., Roble, R. G., Emery, B. A., Fuller-Rowell, T. J., Rees, D., Frank, L. A., and Craven, J. D.: Observations of the dynamics of the polar thermosphere, J. Geophys. Res., 89, 5597–5612, 1984.
Iijima, T. and Potemra, T. A.: Field–aligned currents in the day-side cusp observed by TRIAD, J. Geophys. Res., 81, 5971–5979, 1976.
Killeen, T. L. and Roble, R. G.: Thermosphere Dynamics: Con-tributions from the First 5 Years of the Dynamics Explorer Pro-gram, Rev. Geophys., 26, 329–367, 1988.
Killeen, T. L., Hays, P. B., Carignan, G. R., Heelis, R. A., Hanson, R. A., Spencer, N. W., and Brace, L. H.: Ion-neutral coupling in the high-latitude F region: Evaluation of ion heating terms from Dynamics Explorer 2, J. Geophys. Res., 89, 7495–7508, 1984. Killeen, T. L., Won, Y.-I., Niciejewski, R. J., and Burns, A. G.:
Upper thermosphere winds and temperatures in the geomagnetic polar cap: Solar cycle, geomagnetic activity, and interplane-tary magnetic field dependencies, J. Geophys. Res., 100, 21327– 21342, 1995.
Liu, H., L¨uhr, H., Watanabe, S., K¨ohler, W., Henize, V., and Visser, P.: Zonal winds in the equatorial upper thermosphere: Decomposing the solar flux, geomagnetic activity, and seasonal dependencies, J. Geophys. Res., 111, A07307, doi:10.1029/ 2005JA011415, 2006.
Lu, G., Richmond, A., Emery, B., and Roble, R.: Magnetosphere-Ionosphere-Thermosphere coupling: Effect of neutral winds on
energy transfer and field-aligned current, J. Geophys. Res., 100, 19643–19659, 1995.
Papitashvili, V. O., Christiansen, F., and Neubert, T.: A new model of field-aligned currents derived from high-precision satellite magnetic field data, Geophys. Res. Lett., 29, 1683, doi:10.1029/ 2001GL014207, 2002.
Peymirat, C., Richmond, A. D., and Roble, R. G.: Neutral wind influence on the electrodynamic coupling between the iono-sphere and the magnetoiono-sphere, J. Geophys. Res., 107, 1006, doi: 10.1029/2001JA900106, 2002.
Rees, D. and Fuller-Rowell, T. J.: The response of the thermosphere and ionosphere to magnetospheric forcing, Phil. Trans. R. Soc. London, A328, 139–171, 1989.
Ridley, A. J., Richmond, A. D., Gombosi, T. I., De Zeeuw, D. L., and Clauer, C. R.: Ionospheric control of the magnetospheric configuration: Thermospheric neutral winds, J. Geophys. Res., 108, 1328, doi:10.1029/2002JA009464, 2003.
Ruohoniemi, J. M. and Greenwald, R. A.: Dependencies of high-latitude plasma convection: Consideration of interplane-tary magnetic field, seasonal, and universal time factors in sta-tistical patterns, J. Geophys. Res., 110, A09204, doi:10.1029/ 2004JA010815, 2005.
Siscoe, G. L.: Global force balance of region 1 current system, J. Atmos. Sol.-Terr. Phys., 68, 2119–2126, 2006.
Siscoe, G. L. and Siebert, K. D.: Bimodal nature of solar wind-ionosphere-thermosphere coupling, J. Atmos. Sol.-Terr. Phys., 68, 911–920, 2006.
Sofko, G. J., Greenwald, R. A., and Bristow, W. A.: Direct determi-nation of large-scale magnetospheric field-aligned currents with SuperDARN, Geophys. Res. Lett., 22, 2041–2044, 1995. Song, P., Vasyliunas, V. M., and Zhou, X.-Z.:
Magnetosphere-ionosphere/thermosphere coupling: Self-consistent solutions for a one-dimensional stratified ionosphere in three-fluid theory, J. Geophys. Res., 114, A08213, doi:10.1029/2008JA013629, 2009. Sutton, E. K., Nerem, R. S., and Forbes, J. M.: Density and winds in the thermosphere deduced from accelerometer data, J. Spacecraft Rockets, 44, 2007.
Thayer, J. P. and Killeen, T. L.: Vorticity and divergence in the highlatitude upper thermosphere, Geophys. Res. Lett., 18, 701– 704, 1991.
Vasyli¯unas, V. M.: The mechanical advantage of the mag-netosphere: solar-wind-related forces in the magnetosphere-ionosphere-Earth system, Ann. Geophys., 25, 255–269, doi:10.5194/angeo-25-255-2007, 2007.
Vasyliunas, V. M. and Song, P.: Meaning of ionospheric Joule heating, J. Geophys. Res., 110, A02301, doi:10.1029/ 2004JA010615, 2005.
Weimer, D. R.: Maps of ionospheric field–aligned currents as a function of the interplanetary magnetic field derived from Dy-namics Explorer 2 data, J. Geophys. Res., 106, 12889–12902, 2001.