Vol. 46 - No. 2 - Fall 2014, pp. 1- 10
٭Corresponding Author, Email: [email protected]
A Sub-Optimal Look-Up Table Based on Fuzzy System to
Enhance the Reliability of Coriolis Mass Flow Meter
Mohammad Amin Tajeddini
1and Ali Kamali E
2*.
1-PHD student of Electrical Engineering, Tehran University, Tehran, Iran.
2-Assistant Professor of Mechanical Engineering, Amirkabir University of Technology, Tehran, Iran.
ABSTRACT
Coriolis mass flow meters are one of the most accurate tools to measure the mass flow in the industry.
However, two-phase mode (gas-liquid) may cause severe operating difficulties as well as decreasing
certitude in measurement. This paper presents a method based on fuzzy systems to correct the error and
improve the reliability of these sensors in the presence of two-phase model fluid. Definite available flow
meter parameters are given to designed fuzzy system as inputs, and error is estimated as its output. In the
proposed method, to decrease the number of rules, data are clustered using K-means clustering algorithm.
The ability of this method in error correction is shown by testing it on real experimental data and compared
with the least square method.
KEYWORDS
1.INTRODUCTION
Coriolis mass flow meters have considerable application in industries. However, the accuracy of these instruments decreases in the presence of two-phase fluid (gas-liquid).
A fluid mixed of liquid and gas is called two-phase fluid. In the presence of two-phase flow, the turbulence generated through the flow meter tubes may lead to mass
difference and the resulting measurement error.
Consequently, it decreases the corresponding reliability. Because of the noticeable role of such fluids in industrial processes, a lot of methods have been used to achieve more accurate measured values[1, 2]. For example in the noise analyzing method, the mass flow is measured by comparing the received signals from accelerometer in two-phase with the signals of single-phase mode [3].
Another method is flow regime identification
methodology with neural networks and two phase flow models [4]. In this method the impedance of two-phase fluid is simulated in bubbly, slug, churn and annular modes then applied to a neural network. The network output shows the system mode and behavior. The Radionuclide method uses radioisotopes to measure the fluid velocity directly [5]. Disadvantage of this method includes limited access to radioisotopes, necessary safety
considerations and high technological costs. A
Combinational method for measuring fluid volume mixed with oil and water is presented in [6] which uses two different groups of sensors: The first one includes capacitive, inductive and ultrasonic sensors for the water ratio measurement; and the second group includes venture and pressure difference sensors for volume measurement and also two pressure sensors for error compensation of venture sensors. Internal sensor parameters dependency is one of the disadvantages of this method. In the True mass flow meter method, a turbine flow meter with complex mechanical design is used for measuring two-phase fluid flow directly. High pressure drop through pipeline and vulnerability to corrosive fluid are disadvantages of this method. A detail on the operation of these flow-meters can be found in [7].
Due to the oscillation of flow tubes in single-phase fluid, all components of the measuring device accelerate simultaneously. Flow meters’ accuracy depends on the simultaneous acceleration of gas bubbles and liquid. However, measurement error occurs because of high-volume of gas and low fluid viscosity. Two aforementioned factors make bubbles unable to accelerate with fluid and they make error [7]. Some of studies
conducted on the enhancement of the reliability of Coriolis mass flow meters are reviewed here in this paper.
The efforts to present an accurate model of error in two-phase mode have not been successful, so a lot of experimental works on Coriolis mass flow meters in two-phase mode have been limited to the gas fraction between 6% and 9%, and it has been assumed that the flow meters do not work properly at higher gas fractions [8]. In [7], a Feed Forward Neural Network has been used to correct the error of these sensors. In [9], a neuro-fuzzy model is used to correct the error in the presence of two-phase fluid. Complex architecture of the Neural Network is one of the main flaws of these methods.
The effective mass model is exploited by some other researchers [10]. In this model, the behavior of two-phase fluid at small void fraction is explained on the basis of the effective mass of a bubble in a liquid. If two factors (liquid and bubble) are affected by acceleration, the bubble’s movement in fluid will decrease the stability of the system. It is worth noting that the real response of flow meters is really different from this model [10].
The research entitled sensor validation, in which Coriolis mass flow meters are one of the evaluation tools, has been done to evaluate the original limitation, error models in measuring device and their effects on measurement. Sensor validation by using fault detection and digital technology leads to some optimization in design [11]. Another method in error correction that was expressed in reference [12] corrects the error of Coriolis mass flow meters in two-phase mode by creating an identification system in order to alarm when two-phase condition happens. In this situation, increasing the pressure of the system to dissolve gas bubble can reduce the error. Applying this method is also limited as noted in [13].
In [14], a fuzzy method based on data clustering has been proposed to enhance the reliability of the measuring device, but no optimization method has been used to create the fuzzy rules. Furthermore, no comparison between actual data and the output of the proposed approach has been done [15].
to design the Fuzzy system and the corresponding error of the flow meter is estimated as an output. Low cost, fast response, and simplicity are considered as advantages of this software method in comparison to the other mentioned methods.
The rest of the paper is organized as follows: In section 2, a designed fuzzy system is expressed clearly, the experimental results are gathered in section 3, and the paper is concluded in section 4.
2.FUZZY SYSTEM NASED ON INPUT-OUTPUT DATA
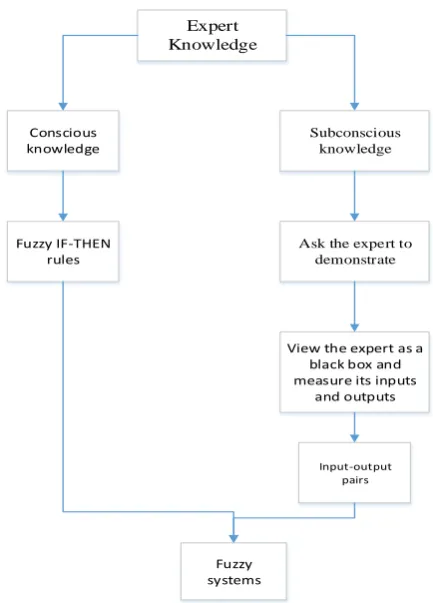
human knowledge about a particular engineering problem may be classified into two categories: conscious knowledge and subconscious knowledge. By conscious knowledge we mean the knowledge that can be explicitly expressed in words, and by subconscious knowledge we refer to the situations where the human experts know what to do but cannot express exactly in words how to do it. For example, the experienced truck drivers know how to drive the truck in very difficult situations (they have subconscious knowledge), but it is difficult for them to express their actions in precise words. Even if they can express the actions in words, the description is usually incomplete and insufficient for accomplishing the task. For conscious knowledge, we can simply ask the human experts to express it in terms of fuzzy IF-THEN rules and put them into fuzzy systems. For subconscious knowledge, what we can do is to ask the human experts to demonstrate, that is, to show what they do in some typical situations. When the expert is demonstrating, we view him/her as a black box and measure the inputs and the outputs; that is, we can collect a set of input-output data pairs. In this way, the subconscious knowledge is transformed into a set of input-output pairs; see Fig. 1. Therefore, a problem of fundamental importance is to construct fuzzy systems from input-output pairs.
3.DESIGNED FUZZY SYSTEM FOR ERROR
CORRECTION IN CORIOLIS MASS FLOW METES
In Coriolis mass flow meters , in order to oscillate the parallel tubes with 180° phase difference, one driving coils are usually used. A vertical force called Coriolis force is exerted to both tubes while the fluid is passing through the simultaneous-oscillating tubes. Coriolis force, acting oppositely in inlet and outlet of tubes causes partial shape conversion in tubes. This diversion is measured by magnetic sensors placed in inlet and outlet of tubes. The measured phase difference is related to mass flow rate in tubes. Resonant frequency is also related to the fluid
density, so this parameter is used to measure the fluid density [16].
Coriolis mass flow meters, which operate with the accuracy of 0.1% in single-phase mode [8], consist of four main parts: parallel tubes, coil driver, magnetic sensors and indicator that are shown in Fig. 2.
Expert Knowledge
Subconscious knowledge
Conscious knowledge
Ask the expert to demonstrate
View the expert as a black box and measure its inputs
and outputs
Input-output pairs
Fuzzy IF-THEN rules
Fuzzy systems
Fig. 1.Converting expert knowledge into fuzzy system
Fuzzy systems, based on if-then rules, can easily convert the linguistic variables to the mathematical formulas [17]. The ability of these systems in modeling and prediction, make them suitable for error correction
Fig. 2. Coriolis mass flow meter’s components.
Following this section, the main parts of the proposed fuzzy system include; input and output, fuzzifier and defuzifier, and rule base are expressed, respectively.
A.Inputs And Output Of The Fuzzy System
It is assumed that the process is performed at the constant temperature. Three accessible parameters of Coriolis mass flow meter are defined as inputs of the Fuzzy system. Brief explanations of these inputs are expressed as follows.
Damping
In Coriolis flow meters, oscillations of tubes are maintained by using a positive feedback. As a result of the feedback, the current supplied to the driver is provided by multiplying a drive gain by sensor signal. Sensor signal indicates phase and frequency of flow tube oscillation. Damping parameter can be defined as (1).
D a
A
I D
V
(1)
where Dathe damping is factor; ID is the current supplied to the driver, and VA is the sensor signal.
Drop in density
Void fraction is widely used as a metric of two-phase flow meters. However, in practice and out of the laboratory, it is rarely possible to achieve void fraction. Since void fraction is directly related to the fluid density, changes in density can be used instead of it. Therefore, drop in density as input to the system is a proportional and nonlinear indicator of void fraction.
Apparent mass flow rate (kg) s
The true mass flow rate, in case of two-phase flow, is not available, but the observed (faulty) flow rate can be considered as input parameter to this Fuzzy system. The Fuzzy system output is the error of Coriolis mass flow meter
Resonant frequency can have effect on the fluid density in Coriolis mass flow meters. On the other hand, this frequency depends on flow tube size via density calibration coefficients and on temperature via deviation from the calibration temperature. The density in Coriolis mass flow meters can be defined as (2).
1 2
3 4
2
DC T DC
DC DC T f
(2)
where is the density; are the density calibration coefficients; is the resonant frequency and is the deviation from the calibration temperature.
A. Fuzzifier And Defuzzifier
Singleton fuzzifier is selected for the system and its membership function is defined as:
*
1 ( )
0 A
x x
x
otherwise
(3)
Where
x
* is the crisp input.Center average defuzifier is defined as:
*
1, 2,...,
l l
l
w y
Y l m
w
(4)
is placed on the output where
y
lis the center of eachoutput membership function and
w
l is its weight.There are two main approaches to design a Fuzzy system [18]. The first approach is considering certain Fuzzy structures for fuzzifier, defuzifier, and membership functions with variable parameters which are determined by applying input-output data to the system. Another approach is writing rules according to the input-output data and then determining the structure of Fuzzy system.
In this paper, the second approach is used to design the Fuzzy system. By considering singleton fuzzifier, center average defuzifier and the product implication function, the short form of the Fuzzy system can be written as [19]:
1 1
1 1
( )
( )
( )
i
i
n M
r r
i A
r i
n M
r i A r i
y x
f x
x
(5)
where r is the number of rules (r1, 2,...,M),
y
ris the center of output membership function provided byintersection between Fuzzy sets and i( ) r
i A x
is the defined
membership function of
x
i in the rth rule.Damping
Drop in density
Apparent mass flow rate
Fuzzifier
Fuzzy Database
Defazzifier
Corrected mass flow rate
×
+
Mamdani Inference Engine
Fuzzy Rulebase
Error
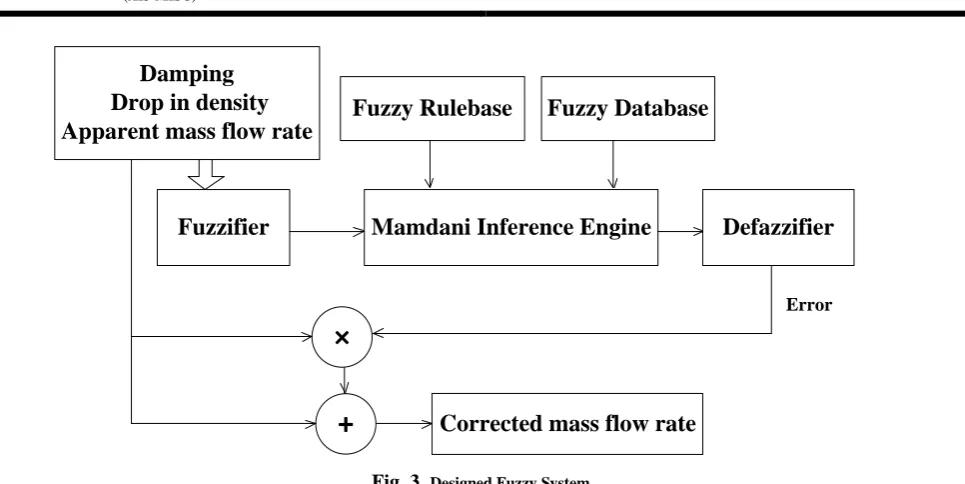
Fig. 3.Designed Fuzzy System.
B. Clustering And Designing The Rule Base
In this chapter, we view the number of rules in the fuzzy system as a design parameter and determine it based on the input-output pairs. The basic idea is to group the input-output pairs into clusters and use one rule for one cluster; that is, the number of rules equals the number of clusters. We first construct a fuzzy system that is optimal in the sense that it can match all the input output pairs to arbitrary accuracy; this optimal fuzzy system is useful if the number of input-output pairs is small.
Clustering is used as a partitioning tool for input-output data sets in order to make clusters of members with the similar features. K-means clustering method is selected among various clustering methods in this paper [22],[23]. The convergence of k-means clustering method depends on initial values for cluster centers. In this paper, initial cluster centers have been determined by subtractive algorithm in order to solve this problem.
In subtractive clustering algorithm we first separate the training data into groups according to their respective class labels; subtractive clustering is then applied to each group of data individually to extract the rules for identifying each class of data. The subtractive clustering method works as follows [24-26].
Consider a group of n data points
{ ,
x x
1 2,
x
3,...
x
n}
for a specific class, wherex
i is a vector in the featurespace. Without loss of generality, we assume that the feature space is normalized so that all data are bounded by a unit hypercube. We consider each data point as a
potential cluster center and define a measure of the
potential of data point
x
i to serve as a cluster center.Thus, the measure of the potential of a data point is a function of its distances to all other data points. A data point with many neighboring data points will have a high
potential value. The constant ru is effectively a normalized radius defining a neighborhood; data points outside this radius have little influence on the potential. After the potential of every data point has been computed, we select the data point with the highest potential as the first cluster center.
In clustering algorithm, accessible data points, normalized in a hypercube, are nominated to be cluster centers. First, the cost function is defined as Eq. (6) [27, 28].
2
1 2
exp( )
( ) 2
n i j
i
j a
x x
D
r
(6)
where positive constant
r
a shows the neighborhood zone;i
x
is an input data andx
j is a nominated cluster center.Putting different input data in (6), data with maximum
value of
D
i (equal toD
i*) is selected as the first cluster2 * * 1 2 2 1 2 exp( ) ( ) 2
exp( ) 1, 2,...,
( ) 2
n i j
i
j a
n i j
j a x x D r x x i n r
(7)
* iD
is the maximum value of cost function andx
i* isthe input data with the maximum value of cost function.
The cluster radius
r
a is set about 0.5. The cost function isupdated according to the following equation using *
1
c i
x
x
andD
c1
D
i*for the rest of the algorithm:2 1 1 2 exp( ) ( ) 2 i c
i new i c
b
x x
D D D
r
(8)
b
r
is usually greater thanr
a, in order to preventadjacent centers to be selected in the algorithm (usually
1.5
b a
r
r
).The same as first iteration, the algorithm continues with a new cost function to find other cluster centers. After data clustering, using k-means algorithm with initial centers provided by subtractive algorithm, the rules must be written for each cluster. Look-up table method is used to prepare the rules in this paper. In Look-up table, N input-output data pairs exist like:
0 0
0
0 1 1 2 2
( , ) 1, 2,..., ;
[ ]
[ , ]*[ , ]* *[ , ] R
p p
p
y y
p n
n n
x y p N
y V R
x U i
N
Fuzzy sets j( 1, 2, , )i i
A j N are defined
determinately in each[ i, i], completeness of Fuzzy sets
must be guaranteed.
[ , ] ; ( 0)
i
j j
i i i i A i
x A x
Membership values in p( 1, 2,..., )
oi
x i n and
y
op mustbe determined for each input-output pair (x0p,y0p) with
regard to antecedent Fuzzy sets Aij (j1, 2,...,Ni) and
consequent Fuzzy sets Bl(l1, 2,...,Ny). To construct
the rule base, each rule is written based on the center of the clusters. A forward selection method is used to select
the membership function [29]. Among
N
i membershipfunctions defined for x ii ( 1, 2,...), a membership function is selected for the first cluster center and the performance is evaluated by optimizing the associated
parameters. Then, the membership function that minimizes the error is selected. For the second cluster, the
center of the membership function between
(
N
i
1)
,which minimizes the error, is selected. This procedure can be performed until all the clusters assigned to the corresponding membership function [30].
Therefore, a rule attributed to
(
x
0p,
y
0p)
is provided:If
x
1 is * 1j
A
and
x
2 is * 2j
A
and so on till
x
n is *j n
A
, then y is
B
l*. If contradictory rules (rules with the same ‘if’ part and different ‘then’ part) appear in rule base, a strength degree is assigned to each rule according to Eq. (12); then the rule with the maximum degree is chosen.* l*
0 0
1 i(x ) (y )
n j p p
rule i A i B
D
(9)
Rule base is arranged based on three kinds of rules: consistent rules (without contradiction with other rules), rules with maximum degree among contradictory rules and linguistic rules based on conscious or expert science [31]. The proposed Fuzzy system has been designed to estimate the error in Coriolis flow meters in the presence of two-phase liquid after receiving available flow meter parameters. The error is used to correct the measured flow as Eq. (10);
* ( ) 100 i c i f error
f f
(10)
c
f
: Corrected mass flow rate;i
f
: Apparent mass flow rate;The ability of mentioned method is evaluated on experimental data in the next section
4.EVALUATION EXPERIMENTAL DATA BY DESIGNED
FUZZY SYSTEM
different values of input vector and error is recorded each time.
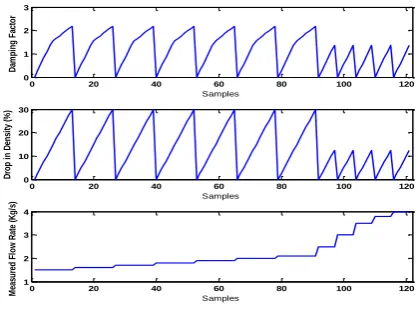
Three inputs considered for Fuzzy system, are damping, drop in density and apparent mass flow rate.
input
damping
x
drop in density
Measured mass flow
The experimental data used as input of the Fuzzy system are shown in Fig. 4.
Fig. 4. Experimental Data.
In this paper, the number of Gaussian membership functions is chosen by trial and error, and finally 21 complete and even Gaussian membership functions are defined for each input dimension and also output (error) as shown in Fig. 5.
Normalized input-output data pairs in the range of [0,1] and initial cluster centers, obtained from subtractive algorithm, are exerted to K-means algorithm to provide 14 cluster centers that K is obtained by trial and error. Cluster
centers are used as input-output data pairs
0 0
(
p,
p),
1, 2,...,14
x
y
p
to write rules in look-up tablethat shown in Table 1. For instance, for the first cluster center, the membership function that has the minimum error is selected. By considering this rule, second rule is written based on the membership function that has minimum error for the second cluster center. This trend is repeated for other centers. So the created fuzzy rule base is sub-optimal.
Training data, required for the design of Fuzzy system, are different values of Coriolis error corresponding to different values of input vector. The input-output data pairs are provided to train the Fuzzy system.
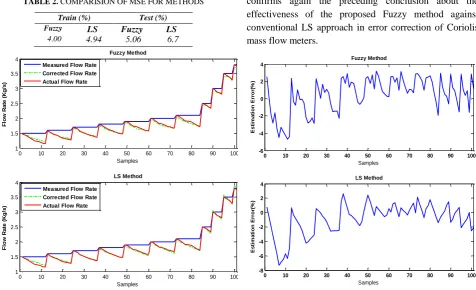
The designed system is expected to estimate the error of Coriolis flow meter and to show the accurate mass flow as its result. Fig.6 compares the results of the proposed method with Least Square Method (LS) as a simple straightforward for the train data [30].
In LS method, we assume that error has the linear relation with inputs that can be defined as Eq. (11).
1 2 3
input 0e x
(11)
By calculating
i, we obtain:[ 2.979 1.448 2.256 0.470]T
Fig. 7 depicted the outputs of fuzzy and LS method for the test data. It is obvious that the LS method has not an acceptable result for the test data. This can be explained by noting to the fact that the parameters of the LS method are highly dependent on the trained data.
Table 2 verified the ability of the proposed method in enhancement of the reliability by comparing the designed Fuzzy system and LS method in the Mean Square Error (MSE) index.
Fig. 5.Membership functions for inputs and output.
0 20 40 60 80 100 120
0 1 2 3
Samples
D
am
p
in
g
F
ac
to
r
0 20 40 60 80 100 120
0 10 20 30
Samples
D
ro
p
i
n
D
en
si
ty
(
%
)
0 20 40 60 80 100 120
1 2 3 4
Samples
M
ea
su
re
d
F
lo
w
R
at
e
(K
g
/s
TABLE 1. RULE BASE
N. Number of Membership Function
Rule Damping
factor
Drop in density (%)
Flow rate Error
1 04 01 01 18
2 04 06 03 15
3 03 20 18 02
4 01 15 12 04
5 03 10 06 10
6 03 15 15 01
7 10 02 01 18
8 03 15 15 05
9 03 14 12 06
10 03 14 11 10
11 10 10 05 15
12 17 10 05 15
13 17 03 05 15
14 01 10 05 09
TABLE 2. COMPARISION OF MSE FOR METHODS
Train (%) Test (%)
Fuzzy LS Fuzzy LS 4.00 4.94 5.06 6.7
Fig. 6.Flow Rate for the train data.
Fig. 7. Flow Rate for the test data.
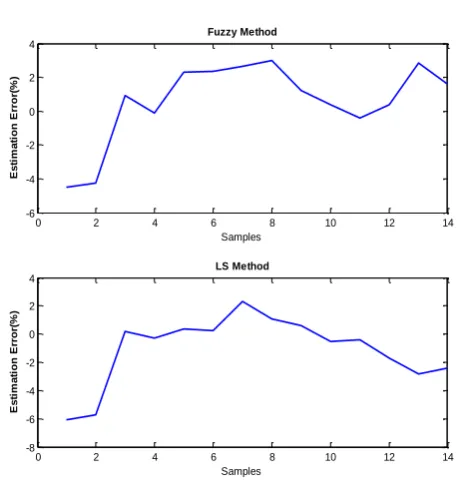
Fig. 8 shows the estimation error for both methods. It is obvious that the proposed fuzzy system decreases the error to 5% and improves the reliability of these sensors. Compared to the Fuzzy method, the LS approach only decreases the output error of the mass flow meter to 7.5%. A similar trend for the estimated error of the mass flow meter on the test data can be viewed in the Fig. 9, which confirms again the preceding conclusion about the effectiveness of the proposed Fuzzy method against conventional LS approach in error correction of Coriolis mass flow meters.
Fig. 8. Estimation Error for train data.
0 10 20 30 40 50 60 70 80 90 100
1 1.5 2 2.5 3 3.5 4 Samples F lo w R a te ( K g /s ) Fuzzy Method
0 10 20 30 40 50 60 70 80 90 100
1 1.5 2 2.5 3 3.5 4 Samples F lo w R a te ( K g /s ) LS Method
Measured Flow Rate Corrected Flow Rate Actual Flow Rate Measured Flow Rate Corrected Flow Rate Actual Flow Rate
0 2 4 6 8 10 12 14
1 1.5 2 2.5 3 3.5 4 Samples F lo w R a te (K g /s ) Fuzzy Method
0 2 4 6 8 10 12 14
1 2 3 4 5 Samples F lo w R a te (K g /s ) LS Method
Measured Flow Rate Corrected Flow Rate Actual Flow Rate Measured Flow Rate Corrected Flow Rate Actual Flow Rate
0 10 20 30 40 50 60 70 80 90 100
-6 -4 -2 0 2 4 Samples E s ti m a ti o n E rr o r( % ) Fuzzy Method
0 10 20 30 40 50 60 70 80 90 100
Fig. 9. Estimation Error for test data.
5.CONCLUSION
Coriolis mass flow meters are widely used in industry because of their high accuracy and benefits. Instead of
using expensive hardware devices, it is more
advantageous to use low cost software-based methods to enhance the reliability in presence of two-phase fluid. The proposed Fuzzy method not only decreases the error of Coriolis mass flow meter to negligible extent, but also its cost is very low. The ability of the proposed method to improve the reliability of flow measurement is obvious in analogy with other software methods. Here, we have demonstrated the effectiveness of the illustrated method against the conventional LS approach. The results show that the proposed method has a lower error compared to the common LS method.
REFERENCES
[1] R. C. Baker, "Coriolis flowmeters: industrial practice and published information," Flow Measurement and Instrumentation, vol. 5, pp. 229-246, 1994.
[2] G. Oddie and J. R. A. Pearson, "Flow-rate measurement in two-phase flow," Annu. Rev. Fluid Mech., vol. 36, pp. 149-172, 2004.
[3] R. P. Evans, J. G. Keller, A. Stephens, and J. Blotter, "Two-phase mass flow measurement using noise analysis," Idaho National Laboratory (INL)1999.
[4] Y. Mi, M. Ishii, and L. Tsoukalas, "Flow regime identification methodology with neural networks and two-phase flow models," Nuclear Engineering and Design, vol. 204, pp. 87-100, 2001.
[5] J. Reimann, H. John, and U. Müller,
"Measurements of two-phase mass flow rate: a comparison of different techniques," International Journal of Multiphase Flow, vol. 8, pp. 33-46, 1982.
[6] M. Meribout, N. Z. Rawahi, A. M.
Al-Naamany, A. Al-Bimani, K. Al Busaidi, and A. Meribout, "An Accurate Machine for Real-Time Two-Phase Flowmetering in a Laboratory-Scale Flow Loop," Instrumentation and Measurement, IEEE Transactions on, vol. 58, pp. 2686-2696, 2009.
[7] R. Liu, M. Fuent, M. Henry, and M. Duta, "A neural network to correct mass flow errors caused by two-phase flow in a digital coriolis mass
flowmeter," Flow Measurement and
Instrumentation, vol. 12, pp. 53-63, 2001.
[8] A. Skea and A. Hall, "Effects of gas leaks in oil
flow on single-phase flowmeters," Flow
Measurement and Instrumentation, vol. 10, pp. 145-150, 1999.
[9] V. A. Lari and F. Shabaninia, "Error correction of a coriolis mass flow meter in two-phase flow measurment using Neuro-Fuzzy," in Artificial Intelligence and Signal Processing (AISP), 2012 16th CSI International Symposium on, 2012, pp. 611-616.
[10] M. Henry, D. Clarke, N. Archer, J. Bowles, M. Leahy, R. Liu, et al., "A self-validating digital Coriolis mass-flow meter: an overview," Control engineering practice, vol. 8, pp. 487-506, 2000.
[11] Z. Feng, Q. Wang, and K. Shida, "A review of self-validating sensor technology," Sensor Review, vol. 27, pp. 48-56, 2007.
[12] M. N. Khamis, A. A. Nojaim, and M. A.
Al-Marhoun, "Performance evaluation of coriolis mass flowmeters," Journal of energy resources technology, vol. 124, pp. 90-94, 2002.
[13] M. N. Khamis, A. A. Nojaim, and M. A.
Al-Marhoun, "Performance evaluation of coriolis mass flowmeters," Journal of energy resources technology, vol. 124, p. 90, 2002.
[14] B. Safarinejadian, M. A. Tajeddini, and L.
Mahmoodi, "A New Fuzzy Based Method for Error Correction of Coriolis Mass Flow Meter in Presence of Two-phase Fluid."
[15] J. Zarei, M. A. Tajeddini, and H. R. Karimi, "Vibration analysis for bearing fault detection and classification using an intelligent filter," Mechatronics, vol. 24, pp. 151-157, 2014.
[16] M. Anklin, W. Drahm, and A. Rieder, "Coriolis mass flowmeters: Overview of the current state of the art and latest research," Flow Measurement and Instrumentation, vol. 17, pp. 317-323, 2006.
0 2 4 6 8 10 12 14
-6 -4 -2 0 2 4
Samples
E
s
ti
m
a
ti
o
n
E
rr
o
r(
%
)
Fuzzy Method
0 2 4 6 8 10 12 14
-8 -6 -4 -2 0 2 4
Samples
E
s
ti
m
a
ti
o
n
E
rr
o
r(
%
)
[17] L. A. Zadeh, "Fuzzy sets," Information and control, vol. 8, pp. 338-353, 1965.
[18] L.-X. Wang, A Course in Fuzzy Systems: Prentice-Hall press, USA, 1999.
[19] M. Tang, H. W. Yang, W. D. Hu, and W. X. Yu, "Construction of Mamdani type probabilistic fuzzy system," Systems Engineering and Electronics, vol. 34, pp. 323-327, 2012.
[20] L. X. Wang and J. M. Mendel, "Generating fuzzy rules by learning from examples," Systems, Man and Cybernetics, IEEE Transactions on, vol. 22, pp. 1414-1427, 1992.
[21] L. X. Wang and J. M. Mendel, "Fuzzy basis functions, universal approximation, and orthogonal least-squares learning," Neural Networks, IEEE Transactions on, vol. 3, pp. 807-814, 1992.
[22] A. K. Jain, "Data clustering: 50 years beyond K-means," Pattern Recognition Letters, vol. 31, pp. 651-666, 2010.
[23] V. Patel and R. Mehta, "Data Clustering: Integrating Different Distance Measures with Modified k-Means Algorithm," 2012, pp. 691-700.
[24] S. Chiu, "Method and software for extracting fuzzy classification rules by subtractive clustering," in Fuzzy Information Processing Society, 1996. NAFIPS., 1996 Biennial Conference of the North American, 1996, pp. 461-465.
[25] N. R. Pal and D. Chakraborty, "Mountain and subtractive clustering method: improvements and generalizations," International Journal of Intelligent Systems, vol. 15, pp. 329-341, 2000.
[26] D.-W. Kim, K. Lee, D. Lee, and K. H. Lee, "A kernel-based subtractive clustering method," Pattern Recognition Letters, vol. 26, pp. 879-891, 2005.
[27] J. A. Hartigan, Clustering algorithms: John Wiley & Sons, Inc., 1975.
[28] A. K. Jain, M. N. Murty, and P. J. Flynn, "Data clustering: a review," ACM computing surveys (CSUR), vol. 31, pp. 264-323, 1999.
[29] K. Mao, "Fast orthogonal forward selection algorithm for feature subset selection," Neural Networks, IEEE Transactions on, vol. 13, pp. 1218-1224, 2002.
[30] O. Nelles, Nonlinear system identification: from classical approaches to neural networks and fuzzy models: Springer, 2001.