Rothamsted Repository Download
A - Papers appearing in refereed journals
Warren, R. G. and Johnston, A. E. 1961. Barnfield. Rothamsted
Experimental Station Report. pp. 227-247.
The publisher's version can be accessed at:
•
https://dx.doi.org/10.23637/ERADOC-1-37013
The output can be accessed at:
https://repository.rothamsted.ac.uk/item/8w643/barnfield
.
© Please contact [email protected] for copyright queries.
document has been scanned from original documents. If you find this document is not readible, or you suspect there are some problems, please let us know and we will correct that.
Report for 1961
Full Table of Content
Barnfield
R. G. Warren and A. E. Johnston
Barnfield, R. G. Warren and A. E. Johnston (1962) Report For 1961, pp 227 - 247 - DOI:
https://doi.org/10.23637/ERADOC-1-37013
BARNFIELD
R.
G. WennrN
and
A.
E.
JonusroN
Lawes and
Gilbert started
a manurial experiment on mangolds on Barnfieldin
1876, the same year they began to study the manur-ing of potatoes on what is nou, the ExhaustionLand.
Except for a few years rvhen the crops failed, mangolds have been grown onBam-field each year from 1876
to
1959.
From 1946to
1959 a part of eachplot,
the
samepart
each yeax, lvasso*n
with
sugarbeet.
Theresults up
to
1894 vr'ere summarisedby
Lar-es and GilbertI
in
1895,and
in
1902 Hall2 discussed the results indetail.
The next accountof
the experiment wasby
\Vatson and Russells'.'6.0'7in
five papersexamining the results
up
to
19!10.
Our account gives results since 1940, andin
additionto
the mean yields for mangoldsfrom
l94l
to1959 and sugar beet
from
1946to
1959, chemical analyses are given of crop and soil samples takenin
1958 and 1959.At
the time the experiment began mangolds rvere rvidel_vgrour.
Knowledge
on
its
culture and
manuring
rvasderived
from
theexperience
of
Iarmers andfrom field
experiments.
SaIt gave good increasesin
lield,
andlertilisen
such as sodiumnitrate
andpotas-sium
nitrate
were especiallyefiective.
The efiectof
phosphates on mangolds wassmall.
Lawes and Gilbert's chief objectin
studyingmangolds was to extend the range of crops in
their
investigations on the sources from which plants obtainednitrogen.
They had alreadydestroyed
the
belief
that
the
large leavesof
turnips,
swedes andsugar
beet could
absorb enoughammonia
from the
air
to
meettheir requirements.
Eventhe application
of
a "
starter"
dose oJnitrogen
(about
8lb.
N7'acreas
ammonium salts)
given
to
in-crease
leaf
areain
the
early
stagesof
the plant's
grosth
did
not
succeed.
The Mangold Experiment followed experiments
with
srvedes and sugar beet onthe
same site, andthe
manuring rvasmainly
acon-tinuation of
the schemesof
these earlierexperiments.
There wereeight long strips
of
land,
sideby
side, each aboutf6
acre, whichl'ere
given the following treatments:
( I)
FYM;
(2)FY\{,
P-from
1895
K
alsogiveu;
(3)unmanured-discarded
in
19O3 becauseit
was verynarrow;
(4) P,K,
Na,Mg;
(5)P;
(6) P,K;
(7) N, P,K-the
N
was a small dose,about
8lb.
N7'acre-from
1903this
strip
received P, Na,
Mg;
(8)unmanured.
This scheme didnot
providea satisfactory
test
of
P,
as nostrip
receivedK
onlv.
Because Mg was always accompaaiedby
Na
there wasno test
of
Mg, and thestrip
comparisonof
Na andK
was alsoafiected.
Across theStrip
treatments
there
were
fir'e
Seriestreatments,
no
nitrogen
(O),sodium
nitrate
(N),
ammonium sulphate(A),
ammonium sulphateand rape cake (AC) arid rape cake
(C).
In
lg4l
rape
cake wasunobtainable, and
in that
year and since castor bean meal was used.After
Strip 3 (unmanured) was discarded the Strip and Series scheme containedthirty-five
main plots, one pertreatment. In
thelayout
ROTHA]ISTED REPORT
FOR
I96I;[s.:
E
[3;
:i*!*
E
E +i
E4a&.:
E
'
q=crE:l
3
3
-:J;9L"6E - --_ -i
;;3.3E
3 e
E*
6di;3€ P I v:
t::gg
i
;
:s
ri-9!,
g s
ge:Ei!'i
s
H
i1
sEqis; H
H
E9;eBEE
n
E
Et
-irrl? : ii ,o
[iEE9
5
j
:a
Eg;5Eq:
s
tsEciEr:,:EoE iE
ni 1+e*o9 E r d
i
EEs{i
! gi"
?s
€E
E?€l
t.o7 z!s
#lA!ai;t
!l;
=qA, .=;C b< I*:
Ei#;:i!EE
E:E
!a -e-_-i: E tsoo
:ii=Hi#r5;E
-E
En?-9-t-!:
l3g Pi i d
-::J3 6{
Ei,".
---=E
!o
P?; :
Ez- s!
9AE
".t:< E. ..:z
>s;f
l:
giE
:
:.r
,;
E-E
-,r9I ds ei!1. .
;i{
E:
Eiai
i
.! - ^a dZZZ a
1E2
?6
\Epi
i;
EEc-Iq
I;EIE
sf
:--
::*l;gf{a;
EEi
s::ir#:El:
:5-E ;:iE5
.:";
$EE
!€:EEa,EE:;
iii
rffaarilEE
!Er
ii3;ieaEEE
E liE.j.6 i.9:i g* t: E
3*r
i3
3e;F
*3s=:
::
5::
F e5'_e:
g::
z 6,- E-r *8c.,:
;: i6:
'i;E'iE"=i':"E
(,;
a
g
AA 3 A AAA
. uuf
ao
ooui-i aa d a aa4
;.2282
222
,i
xr'
Br'
Sgv--
ii -
---Eq. + AAAAA
E.
oo B orroq)
6a
E
5666
zz
e
zzzz
OO
OOOO()
oo ooooo
zzzzz
oo
ooooo
zzzzz
bo
yl
:<
vxE
q.a
aaa&a
Atr
ATAAA
I
Sb
'-r
t
E-<t
a
's!-()
aaaad
>>>t>>
E Ir h fri lrrfg*!Y.V.
E
g g &E 5ttlttl 2 96
E
E€
BARNFIELD
j
.EI
iillt;
tsi3
i;.Ei
e
"E!:::E!:E-
-E
I:1
:
E
iii*iiE
g;i
i
IiF
*
i*
siiet*:if;::ii
:
iti,iffi5g:iEiitr
iE:E
,;ii*lii;i;;iianiix
aai;fftiiEiiiEiii?
ii;i.
ri#s
;iiEiiii:iil
;+€;iE
e
#.E;E
g;iiiiffiiii,ir,*:;
r : E; :i
a*
!=:Pi
Ei;=
e
3E
:A i;
3E9i
E?;,[
if
ii
E!
E;is
€5
:AE
$E
i:
:;
er's-:
ei
#Egii
'#
#i
qE
iEi
E:=E!
r
sEi
c;lE:
ii
ii!
i:,:i
i
;f€
;riii
E;
Ei:
iiiit.;
?ii
sirii
ii;
Ei;
SEHgei
.
t3*=:!;;i
;sE
i5:
Ii:"eiEi
i:rli==.i#
Fs
;Ei
aigii?frEE;:iEff#E
?i€
:E;f
ri:E
ggg:Bl;!!s
i:;;
#
j
:3
i
=io
"3el E=!!
eos..*=.igi
gt€i
.,
E+9
E
t3*
'i
Eae
'isg
o
.E
3E
3
*u
z
E.
g
EE:
,i,nE
.98
9.=!
E<5i,
:
Ee
;
P,46.
qai:
^Er.l
v
U9E ;
;:=-id
"
ooo(ro
+++++
I
<s
t-4
:
ta
a
.,t .
A E.: E66 66:
NN, E= at.lr6l.a.o.a..
a;
E : E3
F.= _
a
:
E!
.EecepE
e
E
t
^6JJ.IJJ
J
a6 F liro(oFr o L OO 0a.a @ @ o:230
ROTHA}ISTED REPORTFOR
106Tand
SeriesN
becauseof
a
depressionin
the land, known
as"
the valley".
Before proceeding
to
discuss the resultsof
the experiment, some features in the history of the site before the experiment need mention (fuller details ofthis
period and of the period of the experiment arein
TablesI
and2).
Although
the
MangoldExperiment
beganin
1876, many of the plots had received the same treatment since 186l ;
some had received the same manures since 1845, though the amounts
had often
varied.
Series O,A,
AC and C (no nitrogen, ammoniumsulphate
and
rape cake
with
and
without
ammonium sulphate)were started
in
the
turnip
experiment 1845,but
SeriesN
(sodiumnitrate)
camelater
in
the
swedeexperiment
1856-70.
To
makeroom
for
SeriesN,
Lawes andGilbert
shortenedthe
total width
ofSeries
A,
AC and C and tookin
landat
the upperpart
of the southstope
of
"
the va.lley".
Beforethis
the wholeof
"
the valley"
wasused
for
experimentsin
which various
manures, e.9.,guano
and phosphates, wereapplied.
There is indeed a record in one of Lawes' notebooksof
one material usedthat
may have been the forerunnerof
ammoniated superphosphate;it
was superphosphate"
partially
neutralised"
with
gas
l.iquor. Parts
of
Strip
8
(urrmanured) received phosphatein
1843-52.
The efiects on the chemical anall'sesof
the soil
of
someof
the
treatments given
beforethe
I\IangoldExperiment began rvere
still
detectablein
soil samples taken fromthe field
in
1958.YTELDS oF MANc,oLDs
Watson and Russell gave
the
mean yieldsof
mangoldsfor
trvo periods of the experiment, 1876-94 and 1904-40, because there weretreatmert
changesin
1903but
nonein
each of the periods selected.Table 3 gives
their
figures and thosefor
the last period,
l94I-59.
The outstanding feature of the table is the decreasein
the yields of nearlyall
plotsin
thelast
period comparedrvith
either thefirst
orsecond
period.
Except for the l,ields of the plots on Strips 2 and 7,where changes were made
in
1903 in the mineral manuring, there was good agreement between thetwo
earlier periocls, and theonly
con-sistent difierences were small
(l-2
tons roots//acre lessin
the secondperiod).
These difierences occurred rvhereno
K,
Na or farmyard
manure was supplied,
and
thev
thereforeprobably
reflect theex-haustion
of
soil potassium.
Although
the
dressingof
rape
cake supplied about30lb.
K/acre, this was not enough to prevent a similardecrease
in
the second period on those rape-cake plotsthat
receivedno fertiliser
K,
Na or farmyard
manure.
The difierences betrveenthe yields
of
the second andthird
period rvere muchgreater.
The yieldsof
rootsof the plots which
receivedonly
inorganic fertiliserwere
4.$
tons/acrelower
in
the last
period, even whereN,
P,
K;
N,
P,
Na;
and
N, P,
K,
Na
were applied,and on
the
farmyard manureplots they
were8
tons rootslacrelower.
No
lossof yield
occurred
nith
rape cake, aloneor
r-ith
ammonium sulphate only,but at
the
higher levelsof
leld
obtained whenP,
K;
P,
Na;
or
P,
K,
Na fertilisers were added rvith the rape cake, the decreasesror
the
third
period weresimilar
to
thosefor the
plotswhich
receivedBARNFIELD
3 .l-
=opeq:+p
-E
36.o1::=R
a
,.{ 1 .l
,oooo,o+.rr,
dY
3 Eo= FA..r:!o;d'
.o6'6
r.a
Ed-
=c.{499F!
:
-:
Ed,9=SSFX8
-.l^
yer=+er
E !X ooo{'ro,oFoqr)
,!
-t
"
i
Be
as:i**t
!
d-
c-{a9et..9.?
I
<.
Ed,
:I!3R8R.a
{!
S
e
3E
6=E1:Ri
E3
E-
"E
€ E:^ €i(.!'!oo,. !
S
z
e
tv
i9**3**
E(\E
s,6
co
\
3
J*
+se6e+Qs
, .i
E d,9:::: *X
El0!!:
I S
.l^
qrr+e.:e
t
' S !;|oF-Ncr6o ; .. E
*
EE
.l ,
..,oo,c-,ooo
r1F
<
EE
ts
'i6i:a$s
'6
:
Ea-
d
5^- <
^.9
- d o.aFo|.i$ F
.,:a
El
6i:::sE
Eisi
$
-L
.*-^---:
S
aB
:
c{ c., d,.ni:
S9
.l- ooooa,*a
Po
.:
tv.;!+.,'++id!
-h
z,
!e .!1.!.!:E€F Ji
E '::::::i
3cl
.
ao..
yI
v
'
';>.
'v
.$6a
>-*
ci
I
'v9raEE
F
o
- : ->> .
Ztu
g,g.'r.t'.aararots+i^r
232
ROTHAMSTED REPORT FOR T9OIThe lower r,telds in the last period of the experiment were
mainly
because responses
to P,
K
and Na fertilisers, andto
farmyard man-ure, were muchsmaller.
Farmyard manure decreased the respons€sto PK
fertilisers (N
fertilisers present)by
nearlythe
same amount in the secondard
third
periods,5|
tons l9O4--4O and 5 tonsl94l-59.
This
suggeststhat
the
activity of
the
PK
nutrients
in
Iarml'ard
manure remained constant, u'hile the
activity
of the samenutrients
in
the form
of
fertilisers was considerably lessin
the
last
period.The response
to
N,
however, $'asnot
less, indeed onthe
Iarmyard manurestrip (Strip
l) it
wastreater
in
l94l-59.
Tables4
and 5show the efiects o{ the
nutrients
added as fertilisers on yield for theperiods rvhen comparison is possible.
TABLE 4
Increase oJ
yiekl
oJ toolsb!
Nfeltiliserc
in
the absenre oJfarmyatd
manure(B
arufeld-tons lauel
86 lb. N/acre applied as
.{mEouiue sulphate
1876-94... t904-10...
t04r-59,..
Uium
trate1876-94... 190{=40...
l94r-59...
flinerals
P,
K
P,\a, \Ig
P, K, Na,llg
Tenrr
5Inercase oJ
yield
oJ loots byK,
Na and Mgin
absewe oJJatmyatd manure
(BarnfieU-tonsIaue)
86
-\SaPPlied'lbJacre
184sodium .{mmodum
Rape
X;:*f-*
nitrate
sulpbate
cake
sulphateK ... ..,
1876-04
-0.2
5.4
6.0
tl.o
t901-40 0.8
7-7
8.1
ll.2
r94l-59
0.6
4.3
4.6
0.6:(a
+
}Ig
... l9O4-40 2.4
9.3
I0.9
12.7l94l-59
0-7
+a
5.3
7.7X,
\a
+
1Ig 1876-94 2.6
7.2
8.7
13.91904-40 2.9
8.7
11.2
l?.Ct94t-50
2.7
5.4
6.0
9.8Tables 6 and 7 compare the efiects of
N
andPK
fertilisersrith
and
without
farmyard manure.The
total
effectof
Iarmyard
manure was much lessin
the
last period (Table8).
Applied aloneor
with
PK
fertilisers,it
increasedyield
by
only
half
asmuch
asin
the
precedingperiod,
a fall
in
response
of
7 tonsroots/acre.
Appliedwith
N
fertilisers, the meanefrect
of
farmyard
manure $'as increasedby
4
tons
in
the third
period,
comparedwith
1.5 tonsin
the
secondperiod.
Becausein
the
third
period the responseto
farmyard manure fell by more thans.2
10.8
9.6
I
l.l
l3.l
to.2
t0.2
t2.2
I1.3l0.o
to.l
13.0 14.8 I t.7 145
Tenrr
6I nctease of yield. oJ roots by N Jenilisers alone aud
in
ptescnceof
farmyard manure aad PKfedilisers
(B
anf.cll---lots
I au e)In pres€nce of
O
PK
FYft
FYIIT+
PK1904-
l94l-
1904-l94l- l90f
l94l-
19O,t-l94l-40 50 l94l-40 59 l94l-40 59 l94l-40
50RAR \FIE I D
18.2
16.84.3 10.8 9.6 4.6
5.26.6 t3.l lo.,
10.6
ll.l
6.9
13.8
12.3
56
9.0Effect oI .{mmonium sulphate Sodium nitrate
Rape
cate ...
...l90{-40 No
FLII
---FYII
Difierence...
l94l-59
No
FY]I
...FYII
Difierence ...
8.0
8.39.4
lO.47.8
9-4 2.67.8 5.3
Rape cake
and
am-monium sulphate
... r1.5
6.65.8 I1.0 9.5
t2-2TABT.E 7
Increosc in
5icld
of tootsb!
PKfenilisels
aloneanl
bt prescnce ofla/rn!o/d,
manure(Barnfieldlonslacre\
Ammonium
Sodium
Rapesulphate nilrate
cake6.3
9.3t.4
4.84.9
4.51.2
6.0t.7
2.a2-5
A-28.9 4.9 4.O 5.9 0.5 5.4
O
-{mEonium Sodiumsulphate
nitrate 86 lb.\
88lb. NRape cake
+
sulphate 14.6 4.2 8.3 t0.8 3.6 7-2
Rape cake
+
RaF
amEoDiumcaLe
sulphate98 lb.
N
l84lb. N11.7
16.79.9
ll.8
TABLE 8
Increase of
yield
of roots byJantyard
manurein
absencc and. p/eserce of olhEr fe/til:ise(Barnfdd---tonslacrc\
\
Fertilis.rsNo
min€rals
r9(N-40
14.4
16.4l94t-59 1.1
12.3PX
...
1904-4010.2
t2.4t94l-69 5.2
7.9Ammoniurn sulphate
f
PK
Sodium
nitrate
f
PK
did
the responseto
K
or Na, there was a changein
the relation be-tween the ]'ieldswith
farmyard manure and$'ith
fertilisers.
With-out rape cakein
thefirst
and second periods, farmyard manuretave
I
ton
roots/acre morethan
PK
fertilisers whenthe N Iertiliser
wasammonium
sulphate
(86lb.
N/acre),but
I
ton
less whenit
was sodiumnitrate.
In
the last periodboth
lorms ofN
(u'ith PK)
gavebetter yields than farmyard
manure.
The extra yields were:ti.4
I t.9
12.5
t0.2
7-19.4
6.3
4.693.T
ROTH.'1.}TSTED REPORTFOR
196IOther
than
the
difierences mentioned,the
general conclusionsabout
the
efiectsof
Iertilisers, rape cake andfarmyard
manure on the yields of mangoldsin
the Barnfield experiment aresubstantiall-r-the same
Ior
the three periods (Table3).
In
addition
to
the
mainStrip
and Series scheme, there weretwo
other treatments, one onplot
9
and the other on
halJof
plot
4N
(see footnotes7 and
ll,
Table
I).
Plot
9,
wherethe
treatment
rvas changedin
l9O3to
provide a
test
of
Pin
the
presenceof
K,
Na,
Mg, doesnot give
avalid
measure of the P response becauseol
residuesIrom
thetreat-ment during
f876-1902.
Plot
4Nb
has receivedno
sodium since 1903(for
full
treatments onplots
4Na and4Nb
see Tablel).
Asmean1,ields
on 4Na and
4Nb
are similar,
sodium as such seemsinessential
with
the existing manurial treatments.Kalamkars examined the variations
in
yieldIrom
1876to
1930,and separated the variations into three
kinds:
(1) steadydiminution
of
yield,
ascribableto
soil
deterioration;
(2) other
slow changes, ascribableto
factorsthat
vary
regularlyfrom,'ear
to
year;
(3) the residualvariation,
called the annualvariation,
ascribableto
factorswhich vary irregularly Irom year to year, including seasonal weather conditions, experimental errors, etc.
D€terioration
and slow changes accountedfor
onll'
very
small fractionsof
the
total
variation.
Sincethen,
however, responseto
K,
Na fertilisers andto
farmyard manure has become much smaller.The composition
of
farmyard
manuremay fluctuate from year to
1'ear,
but
longer-period changes are also possible, for example,from
1939to
l9rt6,
when concentratesfor
feeding animals *'ere scarce.The behaviour
of N
fertilisersin
the presence and absenceof
farm-vard
manurefor the
trvo
periods 1904.-40and
l94l-59
(Table 6)indicates
that
the
compositionof the
manuremay
have changed.The variations
in
responsesto
N
fertilisers are best determinedb!'
comparing y'ieldsin
the presenceof
PK
fertilisers andof farmyard
manure alone,
not
FYlll
+
PK,
asFYM
itself supplies much P andK.
During
l9O4-4O the responsesto
N fertilisers (omitting NaNOr,because
it
provides
an
additional
nutrient, Na)
were
I0'8
18'2 tons/'acrein
the
presenceof PK
fertilisers
but
only 4'6-5'8
tonsrvhen
farml'ard
manure \r'as present, a loss rvhich can beattributed
to
the efiect of the Nin
the farmyardmanure.
In
thethird
periodfarmyard
manure hadvery
little
efiect onthe
responsesto
the
N fertilisers exceptat
thevery
high levetof
N
(184lb.
N,/acrein
rape cakef
ammonium
sutphate).
These
results indicate
that
the Iarmyard manurein
thethird
period contained less availableN
on averagethan
in
the
preceding period, andthis is
rvhy responseto
farmyard
manure wassmaller.
Table6
also showsthat
even the"
richer"
fa.rmvard manuresin
the
second period hadlittle
efiecton the
responiesto N
fertilisers, provided
that
extra
PK
wassupplied.
In
pref ious accountsof
the
Barnfield Experiment
thefigures for the composition of farmyard manure were average values from the Rothamsted
Farm.
Table 9 contains the average contents oftotal
N, P andK
in
14 tons of farmvard manure at difierent timesin thc histor) of
the field.Since 1941, the
farmvard
manures contained less nitrogen than previously, confirming the deduction already made about those usedBARNFIELD
TABLE 9
Composilion of
farmya
tun*rcs
al RolhanstadPK
lb./14 tons
of
anure1850-60
186G80 I S00-lo
1930-40
...l94l-50
... t95t-50... 20()
35
t40... 200
35
195... 200
35
85... 200
45
205... t70
40
160... 100
25
140N
a.t
6.074
4.7a.a
4.,7.E
?.'7.b
8{).to.t
11.111.0
e.ebut
these changes werenot
reflectedin
the
influenceof
farmyard
manure
on
the
efiectsof
PK
fertilisers.
This
could be expected, because thePK
residues from earlier applications of richer manuresrvould remain
active
for a
longerperiod
than
residuesof
organicnitrogen.
Mineral nitrogen
is
producedslowly from old
organicresidues. A further
factor, recorded in Table 2, Note 15, may havecontributed
to
the
lower efiectivenessof
farmyard
manurein
thelast period of
the experiment. Up
to
1929the farmyard
manure was appliedin
March-Apri.l,but
since thenit
has been ploughedin
during
late
autumn
or
early
winter.
ComparisonsoI
winter
andspring
applicationsof
farmyard
manurein
other
experiments at Rothamsted show a small ga.inof
about
I
ton
of
potatoes/acrein
favour of the spring applications.
The
lelds
from Bamfield, however, provide no clue to the reasonor
reasonsfor
responsesto
K
andNa fertiliser
a.lso becoming less.The grades of the potassium sulphate and sodium chloride were
not
lower
at
the end of theexperiment;
nor was the time of applicationchanged.
YELDS
or
Sucen
Bscr
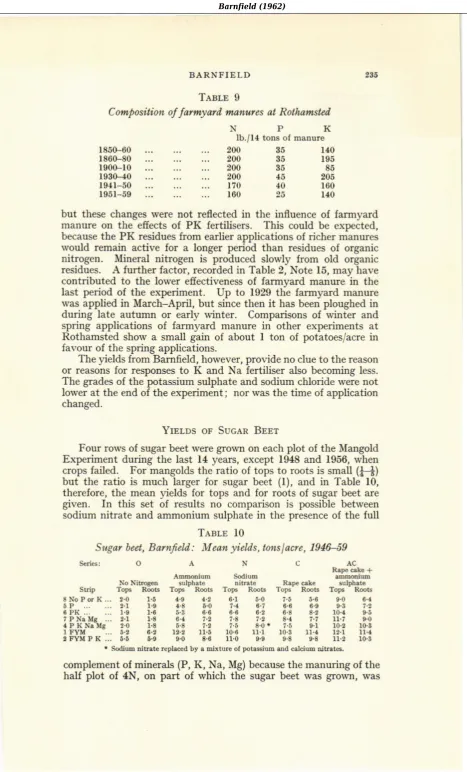
Four rows of sugar beet were Brorrr on each
plot
of the MangoldExperiment
during the
last
14 years, except 1948 and 1956, when cropsfailed.
For mangolds theratio
of topsto
roots is small(}{)
but
the ratio is
much larger
for
sugarbeet
(l),
andin
Table
10,therefore,
the
mean yieldsfor
tops andfor
rootsof
sugar beet aregiven.
In
this
set
of
resultsno
comparisonis
possible betweensodium
nitrate
and ammonium sulphatein
the presenceof
thefull
TABLEl0
Sugar beet,
Barnfcld.:
Mean yields, tottslacre, 19t1649Sirip
8NoP6K... !P ,..
a PK ...
?PN.X! ...
aPXNeXs I FYX ,FTMPK...
OA
Al'!,'uiu
No NitrcCa sqph.t ToF R@ts ToF R@ts
,.0 ,-1 t9 ,.1 !.0 5.' 5.6
cAc
RaF ...L +
R.pe c.f,e subh.t Top6 R@ts Top6 R@[:
i i 5.6 9.0 6.1
6.0 6.9 9.5 7.'
6.8 8.' 10.,4 9 5
6.a 7.7 11.7 9.0
7.5 9.1 t0.' 10.!
l0-5 11.4 12.1 ll.4 9.8 9.8 11.2 tO.3 t 5 ,4.9 1.2
1.9 r'8 5.0
1.6 5.3 6.4
1.8 5.4 1.2 t 8 5.8 7.2
6.2 1r-' ll.5
5 9 0.0 8.6
. SodiuE aiFate rep[.@d by a Ei:ture of Ftsi@ ud elci@ rilfAt6.
complement of minerals (P,
K,
Na, Mg) because the manuring ofthe
236
ROTHA]ISTED REPORTFOR
196Ichanged in
1903.
Sodium *'as replaced by calcium, and the nitrogenwas applied as calcium and potassium nitrates.
The general pattern
of
the efiects of the manurial treatments onthe yields
of
sugar beet \rassimilar to
thepattem
for the mangoldsin
the
third
period.
For
sugar-beet roots ammonium andnitrate
nitrogen
at
an equal rateof
N
(86 lb./acre) gave the same increase,5
tons/acre,in
the
presenceof PK or
P, Na fertilisers.
Higher levelsof
N
gave greaterincreases.
Potassium, as potassiumsul-phate, and sodium, as sodium chloride, each increased the -vield b1'
2 tonsT'acre where ammonium sulphate rvas used, but neither fertiliser
had an efiect
whenthe
nitrogen
rvas supplied as sodiumnitrate.
NPK
fertiljsers
containing 86lb.
N/acre as ammoniumor
nitrate
gave
l-2
tons more roots per acrethan
farmyard manure.The yields of sugar beet from the treatment farmyard manure
{
PK
fertilisers shorv a nerv feature forBamfield.
Where N fertilisersand farmyard manure were applied, adding
PK
fertilisers decreased(l-3
tons)the yield of
sugar beetbut not
of
mangolds.
Table
ll
gives
the
efrectsof
PK
fertilisers
in
the
presenceand
absence offarmyard
manure
for
sugar
beet
and
mangol&
(third
period).Efiects on plots rvhich received sodium
nitrate
areomitted
for
thereason stated lr'hen discussing Table 6.
TABLE
II
Efiect of PK Jerliliserc,
Barnlell:
Roots lonslaueIIr presence of
Rape cake
+
Rapecake
ammonium sulphateStrgar beet 1946-59
2.4
2.8
3.t-2.5
-1.0
-1.1
Mangolds l04l-59
5.0
6.0
10.81.5
2.A
3.6TABLE 12
Inc/eo-se of yieW of sugar beel
ard
mangolds by N fertilisercin
thc lresencc and absence of farmyard manurc arul PK
fertiks*s
B
arnf
ell
(roots tons I ao e)PK
rn prcsetrceof
PK+
FYIU!Ian- Suga! Ilan- Sutar trIan-
Sugar Efiectof
golds beet golds beet golds
beetAmftodum
sulphate 9.6
5.0
9.2
3.2
8.3
2.1Rapecake
...
... 12.3 6'5
9.0
5'2
94
39Rape cake
+
aEEoo-ium
sulphate ... 16.8 i.9
ll.0
5,2
l2'2
4'4 yangoldsl94l
59.
SuSar beet 1948-59.Without
Iarml-ard
manure,
the PK
fertilisers
increased thelields
of both
crops,but
only of
mangoldswith
farmyard
manure.The
increases were greater,and
the
decreases less,at
the
higherlevels
of
nitrogen.
FarmJ'ard manure has
behaved consistentlywith
sugar
beet and
mangoldsin
decreasingfor
each
crop
theresponses
to PK
fertilisers,but
with
sugar beetby
enoughto
de-AmmoniumEfiect of
PK
sulphateNo FYM
FYM...
No FYtrI
BARNFIELD
237crease
,ield.
This efiect must
not
be
attributed
solely
to
eithersource
of
P andK
(iertilisers or farmyard manure),but
to
thetotal
amountof
P andK
from the twosources.
At
the levels ofN
used, the total was excessive for sugar beet and near the level for maximumyield
for
mangotds.
The eflecton
sugar beetof PK
iertilisers
*
FYII
was thereforean
intensification
of
the
efiect
on
mangolds.This
difference betweenthe two
crops
is
also reflected
in
theresponses
to N fertfisers
(Tablel2).
Sugar beet responded much less to
N
fertilisers in the presence ofPK
fertiliserst
FYM
than
vith
either
alone, whereas mangolds gavesimilar
responses.Sugar percentages were determired
only
in
thelast six
crops ofbeet.
The meanfor
the experiment rvas 16.7, and the main effectsof
the mauurial treatments were:Changesinuperrcentage
\itrogen
fertilisers
-0.4
Potassium
sulphate
+0.3Sodium chloride
+
magneiumsulphate
...
+0.4NururNr
CoNrrNrs
oF THE CRoPSChemical analyses were
not
madeoI
the mangoldsIrom
1904to
I94O, arrd previous accounts
of
Barnfield dealtwith
ana-lyses madein
some years between 1876 and19O2.
Those publishedby
Lawesand
Gilbert did
not includeall
plots, andfirll
setsof
analyses, topsand roots
separately, werefirst
madein
the last
2
yearsof
theexperiment,
1958and
1959.
The
sugar beet were also analysed.Results
for the 2
yearsare
not
adequateto
representthe
periodI94l-59, but
they
doprovide
a goodindication of the
ma.intreat-ment difierences, because
treatment
efiects onyield
in
the
2 r'ears resembled those for the longer period.Although the concentrations of nutrients in plants are
important,
there
is
too
little
information about
mangolds(and many
other crops)for
the
results
to
be interpreted satisfactorily
in
terms
oflevels
of
deficiency, excessor toxicity.
The
discussionhere
ismainly on the efiects of the manurial treatments on the amounts Per
acre of each
nutrient in
the crops,vith
only
an occasional relerenceto
percentagesin
the
cropsand
to
the distribution
of
nutrients
between tops and roots.
Table
13 givesthe
yields
of dry
matter and
the
nitrogen
andphosphorus
contents
of
plants from
someof
the
main
manurial treatments.Although farml,ard
manure contained
nearly twice as
much nitrogen as eachof the
N
fertilisers,the
crop on thePlot
receivingFYM only
took up
little
morethan
half
asmuch
nitrogen as thecrop
receivingN fertilters.
This isdifierent from
the early 1'earsf876-1900, when the amounts
of N
takenup from
thetwo
sourcesoI N
werenearll'equal. In
the early
years andat
the
endof
the experiment more nitrogen was taken upby
mangolds from sodiumnitrate than Irom
ammoniumsulPhate; the extra
showed morein
r38
ROTIIAMSTED REPORTFOR
IO6IT^BLE
13Dry-mafrer
yidls
atd
N
atd
P corhttls oJ nangoWs and sugal bccl,Bantfuld
1958-59tsans
cwt./a6e
lb. element/acreDry
Eatter
\itroSen
PhosphorusSeries:ONAONAONA
Strip
r
FY}t ... ... x2
602
FYir,
P,K
... 3,1
594 P, K, Na,
1rg .,, l5
49 6 P,K
...
... 19
,rO7 P, :(a,
ut --. ... 14
13flangolds tops
+
rcotsSugar beet, tops
+
rootsr
FYII
...
... 51 80
772 FYIU, P,
K
... .14 12
704 P, K, Na,
Mg ... l5 63
546 P,
K
...
... l3
5l
7 P, Na,
Ut ..-
... 17 67
6062 48
142
r30 rr 22
2354 56 t5l t37 12 20
2342 l8 lO2 7A 4 16
t642 14 8072
3 t3t5
4t 15 86 1{ 413
l5
62 t40 148 l0 t6
t856
136
140 I 16
20t8 102 76 3 u
rr
1580762510
l8 122 83 3 t2
t0percentage was recovered
by
the
cropoI the
nitrogen appliedin
a single dressing ofN
fertiliser orFYM.
In
this experiment the topsof the
crop are ploughed backinto
the soil each autumn, and holv much nitrogenthis
makes availableto
the cropin
thenext
1'ear isnot
known.
Also,FYI{
and N fertiliser dressings exceeding 0.5 cwt.Nfacre leave nitrogen residues
in
the soil, the availabilities of which cannot be estimatedin
this experinent.
The crops contained
only
aboutfi
as much phosphorus asnitro-gen.
The
percentagesof
P
in
the
crops Brownwith
ammonium sulphate were consistentlv higherthan
with
sodiumnitrate
(mean increase0.02)i
P),but
the P removed per acre was almost identical for the two Nfertilisers.
The figures in Table 13 confirmthat
Iarm-vard
manure provides enough PIor
mangolds and sugar beet, andsuperphosphate
applied
to the
farmyard-manure
plots
did
not
increase
the
amountsof
P
in
the
crops.
Further, applying an
Nfertiliser to
the farmyard-manure plots, u'hich doubledthe yield
ofdry
matter,
also doubled the uptakeof
P peracre.
The farmyard manure (14 tons/acre) contained 25lb.
P
andthe
superphosphate(3!
cwt./acre) 30lb.
P.
At
this
levelof
application togetherwith
the
P residuesin
the soilfrom
previous applications the crops took up similar amounts of P {rom the organic manure and the inorganicfertiliser.
The availabilit5,of
the phosphorusin
the two
materialsneeds testing
with
smaller dressings,but
their
similar behaviour onBarnfield accords
with
the analysis of Rothamsted farmyard manure,in rvhich about
]
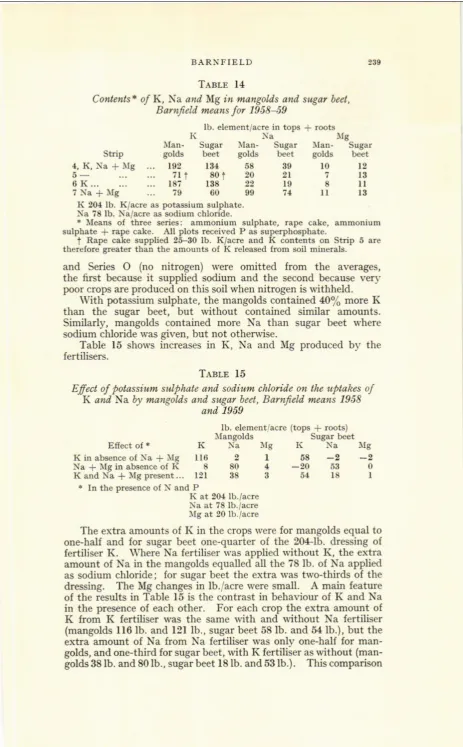
of the P is water-soluble.Table 14 shows the potassium, sodium and magnesium contents oI mangold and sugar-beet crops
from plots
*'hich
receivedno
Iarm-yard
manure. The
mineral
manure treatments
were
the
four
combinations
of
(l)
potassiumsulphate
(2M
lb.
K/acre)
and
(2)sodium chloride
rvith
magnesiumsulphate
(78lb.
Na
and 20 lb.
Mgiacre) ; all plots received
N
and P fertilisers.The figures
in
the table are averages oI three of the SeriesBAR\FIELD
:39T.{BLE 14
Contents* of
K, \a.
and Mgin
nangoWs and sugar beet,Barnfeld
meansfor
1958-59lb. elemetrt/acre in tops
+
lootsK
\a
lrt
Man-Strip
golds4, K, Na
+
lfg ...
1925-
7rt
6
K...
...
...
1877Na+Mg
...
79SuSar beet
r34
80t
138
60
fIan-golds
58 20 22
s0
Sugar
ilan-
Sugarbeet golds
be€t39
lO
t22t713
l08ll
74
ll
t3lIc
0
I
K
204 lb. K/acre as potassium sulphate.\a
78 lb. Na/acre as sodium cbloride.t
}feansof
tbree series: aBdoniurE sulphate, rape cake, ammoniumsubhate
+
rapecake.
A.ll plots received P as superphosphate.i
Rape cake supplied 25-30lb.
K/acre andK
cortenb otr Strip 5 aretherelore greater than the amouflts of K leleased Irom soil mherals.
and
Series
O
(no
nitrogen)
rvereomitted
from the
averages,the
frrst
becauseit
supplied sodiumand the
secord becausevery
poor crops axe produced on this soil when nitrogen is withheld.
With
potassium sulphate, the mangolds cotrtained t10o/o moreK
than
the
sugar
beet,
but
without
contained
similar
amounts.Similarly,
mangoldscontained more
Na
than
sugar
beet
rvhere sodium chloride was given,but
not otherwise.Table
15 shows increasesin K,
Na
and
Mg
producedby
the fertilisers.TABLE
l5
Efect
o/ potassium sulphate and sodiurtu chlo/ide on the u?tahesof
K
and. Na by mangoldsatd
sugu
beel,Barnfell.
means 1958unt
1959Efiect of
t
K in absence of Sa
+ llg
Na
+
Mg in absetrce of KK and Na
+
}Ig pres€nt...lb. element/acre (tops
+
roots)flangolds
SuSar beetK
]*a
llt
K
Na+ ID the preseoce of N and P
K at 204 lb./acre Na at 78 lb.lacre
flg
at 20 lb..iacreThe extra amounts
of
K
in
the crops were for mangolds equalto
one-halJ and
lor
sugar beet one-quarteroI the 204lb.
dressingof
lertiliser
K.
Where Nafertiliser
rvas appliedwithout K,
the
extra amountof
Nain
the mangolds equalledall
the 78lb.
oI Na appliedas sodium
chloride;
for
sugar beet the extra wastwo-thirds of
thedressing.
The Mg changesin
lb.,/acre weresmall.
A
main
featureoI
the resultsin
Table 15 is the contrastin
behaviourol
K
and Nain
the presenceoI
eachother.
For
each crop theextra
amount ofK
from
K
fertiliser
wasthe
samewith
andwithout Na
Iertiliser
(mangolcls
116lb.
andl2l
lb.,
sugar beet 58lb.
and 541b.),but
theextra
amountof
Na from Na fertiliser
wasonly
one-halffor
man-golds, and one-third for sugar beet,with
K fertiliser aswithout
(man-golds 38 lb. and 80 lb., sugar beet I 8 lb. and 53lb.).
This comparisonu6
2
L
58
-2
8804-2053
21O
ROTHAMSTED REPORTFOR
IS6t(K,SO.
r,. NaCl) could
not
be
madein
the
early
1-ears becauseStrip 7
was treated
differently
since
1903than
previously.
By
comparing
the
uptakesin
the early
)'ears (1878-83)of
K
and Nafrom the
sodiumnitrate
and
ammonium sulphate sectionsof
themineral manure strips, Watson showed
that
K and Na each depressedthe uptake of the
other.
This result \yastrue
for the same plotsin
1058-59,
but
the Na
depressedK
uptake
lessat
the
end
oI
the experimentthan
in
the early
years.
The
difierences between thetwo
comparisons
(NaCt
z.
KrSOn
and
NaNO"
u.
KrSOr
+
(NH.),SOJ, in
the efrectof
oneion
on the other, however, arenot
inconsistent.
They reflect difierences in the Na :K
ratios producedin
the
soil
by
the
difierent
Na fertilisers.
The
NaNO"
dressingsupplied twice
asmuch
Na
asthe
sodiumchloride
dressing.
K
residues
from
KrSOn accumulatedin
the
soil,
but
excessNa
wasalmost
wholly
leachedout,
sothat
the
difierencein
Na :K
ratio
between the two sets of plots widened as the experiment continued. Of
the total
potassiumin
farmyard
maauresfrom the
Rotham-sted Farm, 70-80o/o is soluble in water and over 900/6
in
ammoniumacetate
solution.
Nearly
all the
sodium
is
rvater-soluble.
Thesimpte design o{ the
Bamfield
Experiment does not provide asatis-factory
comparisonof
the
efrectivenessof
potassiumin
the
twoforms,
fertiliser and larmyard malure, as they
operatedin
the presenceof
difierent
amounts
of
nitrogen.
Good
comparisonsrequire well-established
N
response curves andK
uptakes.
Horv-ever, an approximate adjustmentto
theK
uptake for the differencein
\
levels indicatedthat
the availabilities of the
K
{rom the two
sources were
similar.
For
similar
reasonsan
approximate
valueonlv,
15lb.
Na,/acre, canbe
gir.enlor
the
uptake
of
sodiumbv
mangolds from farmyard manure.
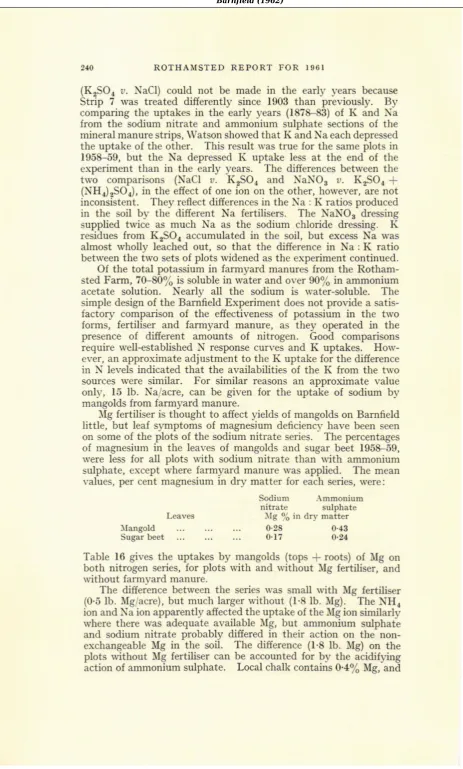
llg
fertiliser
is thoughtto
afiect yields of mangolds on Barnfietdtittle,
but
leaf st rnptomsof
magnesium dehciencv have been seenon some oI the plots
of
the sodiumnitrate
series.
The percentagesof
magnesiumin
the
leavesof
mangolds and sugarbeet
195&59,rvere less
for
al.tplots
with
sodiumnitrate than
Nith
ammonium sulphate, except rvhereIarmyard
manure wasapplied.
The mean values, per cent magnesiumin drv
matter for
each series, were:Sodium
-\mmolliumnitrate
sulphateLeaves
ltg
96 in drt'matterflangold
Suear
beet ...
...0.28
0.r7
0.430.21Table
16 givesthe
uptakesby
mangolds (tops+
roots)of
IIg
onboth
nitrogen series,for plots
with
andrvithout
llg
fertiliser,
andrvithout
Iarmyard manure.The
difierence betr /eenthe
series wassmall
rvith
Mg fertiliser
(0.5
lb-
Mg/acre),but
much laxgerwithout
(1.8lb.
Mg).
The NHoion and Na ion apparently affected the uptake of the Mg ion sim.ilarly
where there was adequate available
IIg,
but
ammonium sulphateand
sodiumnitrate
probably
differedin
their
action on
the
non-exchangeable
Mg
in
the
soil.
The
difference(f'8
lb.
Mg) on
theplots
without
Mgfertiliser
can be accountedfor
by
the acidilying
BARNFIELD
2II
l'5-2
lb.
Mg
rvould be releasedfrom
the chalk
in
the soil
by
the dressingof
ammoniumsulphate
(420lb.,/acre).
The
uptakesfor
sugar beet on the
tt'o
series difrer asu'ith
mangolds, 0.1 lb. Mg/acrewith
and
1.8without
Mg
fertiliser.
Table
16 showsno efiect
onuptake
by
mangoldsof
Mg b1'K
fertiliser
but
u'ith
sugarbeet
K
decreased uptake
by
I
lb.
Mg,'acre.About
2lb.
Mg'acret'ere
taken up from the farmyard manure.TABLE 16
Uptake of Mg by mangolds on ammonium sulphate and. sodium
nitralo series
in
presence and abscnae of ltlg andK,
Banfuld.
195849
St ip
475
[P, K, Na,
]Ig)
(P, Na,Mt) e)
lb. Mg/acre
AEmoniuE
sulphate
7-i
7-O
6-1Sodium
nitrate ...
7.2
7-2
4.6Difiereoce
0.5
O.4
1.86
Efiect of(P,
K)
Na, Mg1.3
2.6
EFFEcT oF THE
II.{\uRr.{L
Tnrernrxrs
oN THE SorLIn
the classificationof
the soils ofthe
Rothamsted Farmbv
theSoil Survey of England and \\'ales, the soil of BarnEeld, except
i'
the valley",
belongs to the Batcombe Series, rvith aflinty
clay loamsur-face
soil and
a
lellow-red flint1'
clal'
subsoilwith
vari-colouredmottling
at
varying
depths belorv 9inches.
In
"
the
valley"
the soil belongsto
theChadt]'
Series, rvhich difrers from the BatcombeSeries
mainly
in
thesubsoil.
The subsoilof
theCharity
Series is abrown
flinty
loam or clav loam do\rmto at
least 24inches.
About
half
oI
eachplot
s'hich
receir-ed sodiumnitrate
is
in
the
Chadtl-Series.
A
pH
survevof
Barnfreldin
1953-54 showedthat
areaswithin
the
ammonium sulphate
and
ammonium
sulphate+
rape
cake series (A and AC) s'ere acid (pH 5in
water).
The soils of the other nitrogen series containedchalk,
up
to
2o/oCaCO!.
A
dressingof
ground chalk, 5 tons,/acre, rvas applied
to
SeriesA
and ACin
1956.In
1958, when soil samples rvere taken for detailed chemical analysis,the
pH
valuesfor all plots
\r ere betu-een 7 and8-
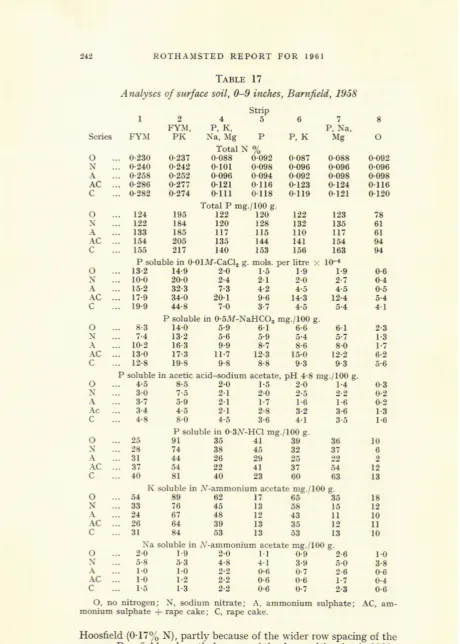
Table 17 givesanalysis
of
the
soilsfor total N,
soluble andtotal
P;
ammoniumacetate-soluble
K
and Nafor
the 0-9-inchdepth.
Soils from otherdepths ($-12,
l2-18,
18-21 inches) rvere also anall'sed, and referencesto
the results are madein
thetext-Nitrogen
The nitrogen content
of
the surface soilof Bamfield
unmanuredplots was 0.0lo/o N lorver than the comparable soils of the
Broadballi
\\rheat
and HoosfieldBarlel'
experiments.
The efiectoI
inorganic fertilisers (N, P,K)
on the N content of the soil u'as the samein
thethree experiments, a small gain of 0.01%
N.
Although the mangoldexperiment began
in
1876, farmyard manure was appliedto
the site of StripsI
and 2Irom
1856 and the gain in soil nitrogenin
1958 overthe
unmanuredsoil
s-as0.110(
\.
This
increaseis
lessthan
onB
6.4
4.i
ROTHAYSTED REPORT FOR TOOT
TABLE
l7
Analyses of surJace soil,
0-9 ircfus,
Barufzld,
1958 Stript215678
FYfI,
P,K,
P, NA,Series FYlt
PK
Na,Ut
P
P,K
Mg
OTotal N o/o
o
... 0.230 0.237 0.088 0.002 0-087 0.088
0.092\
... 0.240 0.242 0.101 0.098 0.096 0.096
0.096-{ ... 0.258 0.252 0.006 0.094 0.0s2 0.098
0.098AC ... 0.286 0.277 0.121 0.116 0.123 0.t
0.116c
... 0.282 0.271 0.lll
0.I8 0.tt9 0.121
o.t20 Total P mg./l0O g.122
120120
r28ll7
tt5
135
144140
153P soluble in o.oIM-CaClr g. mols. per
lit
ex
l0-.
78 6l 6l 94 94 06 0.4 0.5 5.4 .1.1
122
r93132
135ll0
ll7
l4l
154156
163o ... 12{
195\
... 122
184-{ ... 133
t85-{c _.. t54
205c ... 155
2t7o ... r3.2
14.0\
... 10.0
20.0A ... 15.2
X2.Ao ...
25\
...
28-.L ...
3l
AC
...
37c ...
40I-0
1.3
2.0
t.5
1.92.4
2.t
2.0P soluble in 0.3.Nr-}ICl ,18./100 g.
9l
35
41
3974
38
15
3244
26
29
2554
22
41
378l
40
231.9
7.3
4.2
4-5
1-5..r.c
... 17.9 34.0
20.19.6 14.3
12.4c ... r9.0
41.a7.0
3.?
1.5
5.4P soluble in o.5M-NaECO. m8./ro0 g.
o ... 8.3
14.0
5.9
0'l
6.6
6.1
2-t\
... 7.4
13.2
5.0
5.0
5.4
5.7
1.3-\ ... r0.2
16.3
9.9
8.7
8.6
8.O
1.7.{c ... r3.0
l?.3
rl.7
r2.3 15.0 12.2
6.2c
... 12.8 19.8
0.8
8.8
9.3
9.3
5.6P soluble in acetic acid-€odium acetate, pH 4.8 Et./100 8.
o
... 4.6
8.6
2.0
1.5
2.O
r.1
0.3N ... 3.0
7.5
2.t
2-O 2.5
2.2
0.2_t ... 3.?
5.0
2-t
t-7
1.6
1.6
0.2Ac ... 3.4
4.5
2.1
2.a
5.2
3.6
1.3c
... 4.E
8.0
4.5
3.6
4.1
3.5
1.6o
\
,{c
C
_.. 5.8
5.31.2
2-2
0.6
0.6K soluble in .\'-ammonium acetate mg./loo g.
o
... 54
89
62
l7
65
35
l8
\
... 33
76
45
t3
58
t5
t2,{ ... ,4
67
48
12
43
ll
l0
-{c ..- ,6
64
39
l3
35
12
ll
c
... 31
8{
53
13
53
13
rO\a
soluble in N-anmonium acetate mg./100t.
... 2.0
t.9
2.0
t.l
0.9...
t.0...
1.0...
1.54.8
4.1
3.92-2
0.6
0.?2.2
0.6
0.7O, no nitrogetr; N, sodium
nitrate; ,{,
ammonium sulphate; AC, am-,non'ium sulphate+
rape cake; C, repe cake.Hoosfield (0'17% N),
partly
because oI the u'ider row spacing of thecrop on Barnfield and
partly
because of the deepcultivation in
1929-30
to
about
12inches.
The
still
smaller increase (0.13o/oN)
on36
t0376
222
54
t263
l3
tt0
2.6
1.05.0
3.82.6
0.61.7
0.42.3
06BARNFIELD
:43Broadbalk
rvith
a
narrorvrow
crop
was causedby
the
fallos.ingscheme introduced
into
theexperiment.
The extra nitrogenin
the soilof
the farmyard-manure plots onBarnlield
was equalto
about one-quarterof
the
amount applied
in
the
organic
manure-
OnBarnfield, rape cake gave an increase
in
soil nitrogensimilar
to
theincreases
on
Broadbalk
and
Hoosfield (0.03%
N).
The
extra
nitrogen
in
the
rape-cake plotsof
Barnfield
andof
Broadba-lk lr-asequal to one-tenth of the nitrogen
applied;
on Hoosfield thefraction
was one-fiIth, as the dressing of rape cake rvas
half that
of the otherfie.lds
Pkosphorus
The site of the no P
strip
(8) of the Mangold Experiment receir.ed phosphate betrveen 1843 and 1852 (Table 2, footnote 4), more than 30 years beforethis
experimentbegan.
.4.1the
endof
the
experi-ment no
part
of this strip was as exhaustedof
P as the no-P plotsof
the Agdell and Exhaustion
Land
Experiments.
Even on the partsof
this strip
n'here sodiumnitrate
and
ammonium sulphate were app)ied, thetotal
P
and NaHCOT-solubleP
valuesoI
the soil wereonly a
little
lessthan
those of the P-residue plots of the Exhaustion Land Experiment, on s'hich the responsesby
cropsto
Pfertiliser in
1957
58
rveresmall
exceptfor potatoes.
As two-fiIths
of
Strip
8also received
P,
containedin
the
rape-cake dressing,each
yearfrom
1845to
1959, there is nowon
Barnield
only
a
little
land
at moderately lorv ler.elsof
P and noneat
very lorv levels.Although
the
sodiumnitrate
seriesstarted
in
1861,after
theother nitrogen series, the site had received the same amounts of
strip
manures, because
from
1843 these manureshad
beenapplied in
"
the valley"
from Series Oto
SeriesA.
From
1843to
1852 Larves andGilbert
used"
the valley"
land Ior other experimentsin
whichphosphate manures rvere applied as dressings across Strips
r1-7.
In
1958
there
were largeP
residuesin
the
soil Irom the
earll-
crossdressings.
The mean value {ortotal
P for Strips 11, 5, 6 and 7 oi thenitrate
series was 128 mg.1l00g.;
the corresponding valuesfor
the ammonium sulphate (SeriesA)
and the no-nitrogenplots
(Series O)sere
ll5
mg. and 122mg.
The P uptakeby
the cropsin
1958 59for
the
two
series(A and
N)
rvere almostidentical,
and therefore noneof
the extratotal
Pin
the soilsof
thenitrate
series should beattributed to
the twoN
fertilisers affecting uptakedifierentll'.
Theso s
of
the
ammonium sulphateplots,
horvever,contahed
more CaClr-soluble and NaHCOT-soluble P than the sodiumnitrate
plots, er.enthough thev
contained lesstotal P
(Strips4-7).
The
differ-ences were
equally
largelor
P
derived
from
superphosphate andfrom Iarmyard manure,
but
the difierencein
CaClr-soluble P on theno-P plots was very
small.
In
contrastto
the neutral and alkaline extractants,tlvo
acid extractants,CHTCOOH{H.COONa
(pH 4'8) and O.3N-HCI, dissolved more P from the sodiumnitrate
plots thanfrom the
ammonium sulphate
plots.
Apparently none
o{
theextractants correctll'
assessedthe
availableP,
but
mangolds andsugar beet may be sensitive
only
to
drastic changesin
soluble Pat
veiy
high levels, such as the levelsin
the Pfertiliser
andfarm3'ard-manure plots.