DEMOGRAPHIC RESEARCH
VOLUME 29, ARTICLE 1, PAGES 1-32
PUBLISHED 2 JULY 2013
http://www.demographic-research.org/Volumes/Vol29/1/ DOI: 10.4054/DemRes.2013.29.1
Research Article
How well does the American Community Survey
count naturalized citizens?
Jennifer Van Hook
James D. Bachmeier
© 2013 Jennifer Van Hook & James D. Bachmeier.
This open-access work is published under the terms of the Creative Commons Attribution NonCommercial License 2.0 Germany, which permits use, reproduction & distribution in any medium for non-commercial purposes, provided the original author(s) and source are given credit.
1 Introduction 2 2 Prior research and study contributions 2
3 Data and methodology 5
3.1 Estimates based on the American Community Survey 6 3.2 Estimates based on Office of Immigration Statistics naturalization
records
9 3.3 Comparing the Office of Immigration Statistics with the American
Community Survey estimates
15
4 Results 15
5 Conclusion 25
How well does the American Community Survey count naturalized
citizens?
1Jennifer Van Hook2
James D. Bachmeier3
Abstract
BACKGROUND
Citizenship status among the foreign born is a crucial indicator of social and political incorporation, yet there are good reasons to suspect that citizenship status is inaccurately reported on U.S. surveys.
OBJECTIVE
This paper updates research carried out in the mid-1990s by Passel and Clark (1997) on the extent to which foreign-born noncitizen respondents in U.S. government-sponsored surveys misreport as naturalized citizens.
METHODS
We compare demographic estimates of the resident naturalized foreign-born population in 2010, based on administrative data, to estimates from the 2010 American Community Survey (ACS).
RESULTS
Similar to previous research, we find that misreporting in the ACS is especially high among immigrants from all countries/regions who report fewer than five years in the United States. We also find that among longer-term foreign-born residents, misreporting is concentrated only among those originating in Mexico, especially men of all ages and older women, a finding that diverges from Passel and Clark in that we find no evidence of overreporting among immigrants from Central America and the Caribbean. Finally, the estimated magnitude of misreporting, especially among longer-term Mexican-born men, is sensitive to assumptions about the rate of emigration in our administrative-based demographic estimates, and assumptions about coverage error in the ACS, though altering these assumptions does not change the conclusions drawn from the general patterns of the results.
1 This research was supported by grants from the National Institutes of Health (RC2 HD064497, P01
HD062498, and 2R24HD041025).
2
The Pennsylvania State University, Population Research Institute, USA. E-mail: [email protected].
CONCLUSIONS
For applications that use citizenship as an indicator of legal status, we recommend that self-reported data on citizenship be accepted at face value for all groups except those with fewer than five years of U.S. residence, Mexican men, and older Mexican women.
1. Introduction
Immigration and immigrant integration continue to be topics of enormous social significance, particularly for countries like the United States, where immigrants make up 13% of its population. In the context of anti-immigrant policies and attitudes that treat societal outsiders differently, citizenship status among the foreign born is a crucial indicator of social and political incorporation in the United States (Van Hook, Brown, and Bean 2006) and other immigrant-receiving societies (Bloemraad 2006), and is strongly associated with political participation, access to public assistance, health care, and the formal labor market (Passel, Clark, and Fix 1997; DeSipio 2001; Fix and Zimmermann 2001; Van Hook and Balistreri 2006). Citizenship is also a key variable for the production of estimates of the characteristics of the unauthorized foreign-born population (Passel, Van Hook, and Bean 2006). Social scientists and policy analysts therefore rely heavily on survey items on citizenship to answer questions about immigrants, their well-being, and their impact on host societies (Bloemraad, Korteweg, and Yardakul 2008).
Given the importance of citizenship for research on immigrants, it is important to assess the accuracy of citizenship reporting in surveys. In the United States, data on naturalization and citizenship largely come from Census Bureau surveys, such as the Current Population Survey (CPS), the long form of the decennial census (2000 and earlier), and the American Community Survey (ACS). Prior research, carried out in the mid-1990s by Passel and Clark (1997), suggests that the number of naturalized citizens is overestimated in census data, possibly because some noncitizens misreport as citizens. We update and extend this work by comparing demographic estimates of the resident naturalized foreign-born population in 2010, based on administrative data, to estimates from the 2010 ACS.
2. Prior research and study contributions
proficiency and pass a civics test), or after three years if they are married to a U.S. citizen or have served in the U.S. military (U.S. Citizenship and Naturalization Services 2012). Because citizenship grants immigrants eligibility for a wide variety of public assistance programs and civic activities (Passel, Clark and Fix 1997; DeSipio 2001; Fix and Zimmermann 2001), and because it serves as an indicator of social inclusion and integration (Van Hook, Brown, and Bean 2006; Bloemraad 2006), researchers interested in immigrant integration and the well-being of immigrants and their children often incorporate citizenship into their analyses. For example, using Canadian and U.S. census data, Bloemraad (2006) finds that rates of naturalization among immigrants in Canada, which has implemented policies aimed specifically at the social integration of immigrants, are relatively higher than those for immigrants in the United States, where federal policy with respect to the civic incorporation of immigrants is, by comparison, more laissez-faire. In another example, Van Hook and Balistreri (2006) found that children living in households with noncitizens experienced steeper declines in food support and increases in food insecurity following the enactment of legislation that cut public assistance programs to noncitizens.
Data on citizenship has also been used in research on the characteristics of unauthorized immigration. Few surveys ask questions about immigrants’ legal status. Information on citizenship, which is a common survey question, along with other indicators of legal status, has been used to impute who among the foreign born are legally resident (Passel and Cohn 2009). Citizenship is strongly associated with legal status because naturalized citizens are composed entirely of legally resident persons, while noncitizens are composed of a mixture of legal statuses, including unauthorized migrants, legal permanent residents, and other legal nonimmigrants (Passel, Van Hook, and Bean 2006).
There are good reasons to suspect that citizenship is inaccurately estimated in census data. During the late 1990s, Passel and Clark (1997) compared the number of persons that are reported as naturalized in the 1990 Census and the 1996 Current Population Survey with the number of naturalized citizens based on administrative data from the Immigration and Naturalization Service (INS). They found the census/CPS estimates to be much higher than the INS-based estimates for two groups. Among new arrivals (those in the U.S. fewer than five years) from all national origins, about 75% of those who were reported as naturalized were probably not. Among longer-resident Mexican and Central American immigrants, about one-third of those who were reported as naturalized were probably not.
census takers, or because they are confused about their citizenship status. This assessment has limited the value of the citizenship variable for research on immigrant naturalization and legal status. For example, skepticism about the accuracy of citizenship reporting has led the Pew Hispanic Center (Pew) to refrain from using citizenship as an indicator of legal status among most recently arrived immigrants and all Mexicans and Central Americans (Passel et al. 2006).
For several reasons, we seek to update and extend the research conducted by Passel and Clark (1997). First, Passel and Clark’s research was presented at a conference but the details of their methodology were never published in a peer-reviewed outlet. For this reason, it has been difficult to evaluate and replicate their work. Here, we provide a detailed description of the data and methods used to evaluate census-based estimates of the number of naturalized citizens. While our method is not identical to Passel and Clark’s method, it adheres to the same basic logic. Like Passel and Clark, we use administrative data on naturalization to evaluate the number of citizens enumerated in census data, working on the premise that administrative records of naturalization are less sensitive to error than census data.
Second, we seek to update the Passel and Clark estimates because no evaluations of citizenship reporting have been done since their study. Reporting error may have risen due to increased Department of Homeland Security (DHS) enforcement activities both at the U.S.–Mexico border and in the U.S. interior (Haddal 2010). The increased risk of deportation and heightened costs of reentering the United States if deported may have made migrants less willing to provide accurate responses to questions about citizenship. Thus, at the same time that Federal and state/local policy vis-à-vis immigrants has shifted toward the increasing exclusion of noncitizens (Portes and Rumbaut 2006) – and especially unauthorized migrants – from certain rights, benefits, and access to labor markets, the changing policy context may have also encouraged increased misreporting of naturalization among noncitizen immigrants, especially in government-sponsored surveys. Passel and Clark examined citizenship in the 1996 March Current Population Survey and the 1990 Census, data collected over 15 years ago. We evaluate the number of naturalized citizens in the 2010 American Community Survey. Discussed further below, the ACS was designed as a replacement of the decennial census long form, and now serves as the major source of information about the size and composition of the foreign-born population in the United States.
and census estimates of the number of citizens. These ranges help us eliminate some of the most important alternative explanations for discrepancies between administrative and census-based estimates. If a discrepancy is consistently evident across all plausible ranges of sampling error, emigration, and coverage error, this lends support to idea that the discrepancy is due to an actual difference between the number of naturalized citizens represented in census data and the number of naturalized citizens in the population, rather than the assumptions we make in the process of evaluating census data.
Finally, we stress that our aim is to evaluate the ACS citizenship data as it is produced for public use by the Census Bureau. Therefore, we do not attempt to ―correct‖ the citizenship status or place of birth data reported in the public-use files of the ACS, such as by recoding what appear to be implausible responses to the citizenship question (e.g., foreign born with fewer than five years of U.S. residence), by adjusting the survey weights to account for insider knowledge of coverage error or other problems with the sampling weights, or by using restricted-use census data. We instead treat the ACS data as a competent non-Census Bureau analyst would.
3. Data and methodology
To assess the current level of citizenship reporting error, we estimated the number of naturalized citizens in mid-year 2010 by age group, sex, region of origin, and duration of residence based on the number of Office of Immigration Statistics (OIS) naturalization records. We then compared the OIS-based estimates with the corresponding numbers in the 2010 American Community Survey (also a mid-year estimate). The difference between the two provides an indication of over- or underrepresentation of naturalized citizenship in the ACS.
As mentioned above, the discrepancy can arise from errors other than reporting error. Most importantly, the ACS estimates are also subject to sampling error and coverage error, and the OIS-based estimates may not be accurate because of erroneous assumptions about the extent to which immigrants remain in the United States after naturalizing. In what follows, we describe the data, samples, methods, and errors associated with the production of the ACS- and OIS-based estimates. This is then followed by a description of how we compare the two sets of estimates. We conducted all data analyses in Stata 12.1.4 All Stata programs and data files used to produce the ACS and OIS estimates are provided at www.demographic-research.org/ volumes/vol29/1/.
3.1 Estimates based on the American Community Survey
Data. The 2010 ACS interviewed approximately 1.9 million U.S. housing units, or 2.4% of all occupied U.S. housing units, and 145,000 persons in group quarters.5 We used the one-year public use 2010 ACS, which contains a 1-in-100 sample of the U.S. population (N = 3,061,692 persons), obtained from the Integrated Public Use Microdata Series (IPUMS) (Ruggles et al. 2010).6 We used the ACS, rather than the decennial census or the Current Population Survey (as done by Passel and Clark), for several reasons. First, the decennial census no longer asks questions about citizenship. By design, the ACS replaced the decennial long form in the early 2000s and is now the only large U.S. sample with questions about naturalization and citizenship. The CPS would have been a good alternative, but the ACS is better because it includes a question about the year of naturalization, an item that is important for our estimates. Additionally, the ACS has a much larger sample than the CPS, which reduces sampling error. Finally, the ACS is representative of the U.S. resident population, while the CPS is representative of a subset—the civilian noninstitutionalized population. While we do not expect this to make much difference, the more inclusive ACS population is a closer match to the OIS-based estimates, which capture the entire U.S. resident population of naturalized citizens.
As described in the next section, the OIS estimates are limited to those who arrived in the United States in 1990 or later and naturalized age 18 or older. To match the universe for the OIS estimates, the ACS sample is limited to the same population: foreign-born naturalized citizens who came to the United States to stay in 1990 or later and who naturalized age 18 or older (N = 47,842).
The key variables used to produce the ACS estimates include country or region of birth (categorized as Mexico, Central American/Caribbean, Asia, and all other regions), sex, age (18–29, 30–39, and 40+), duration of U.S. residence (categorized <5 and 5+ years; recoded from the year the respondent reported he/she came to live in the U.S.), citizenship status, and age naturalized (18+; recoded from year of naturalization). Citizenship is based on the question ―Is this person a citizen of the United States?‖, to which respondents would have to answer ―Yes, U.S. citizen by naturalization‖ in order to be counted as a naturalized citizen.7 Persons marking this response are then asked to indicate the specific year of naturalization. Year of entry is ascertained by the question ―When did this person come to live in the United States?‖.
5 See http://www.census.gov/acs/www/methodology/sample_size_data/. 6 Data were extracted from https://usa.ipums.org/usa/sda/.
7 The 1990 Census asked the identical question as the 2010 ACS, and the CPS asks a similar question: ―Did
Errors and Omissions in ACS Data. As discussed above, citizenship status could be misreported. This is the type of error we are most interested in evaluating. However, there are several other possible sources of error in the ACS estimates that we wish to account for. While it is impossible to identify and enumerate every source of error, we attempt to account for the errors that seem most likely to affect our evaluation.
First, ACS estimates are subject to sampling error. To assess the size of sampling error, standard errors and confidence intervals were calculated using the Successive Differences Replication (SDR) method described in the ACS design and methodology documentation (U.S. Census Bureau 2009). To do so, we employed the ACS replicate weights provided by the Census Bureau. For more details, interested readers should refer to the accompanying Stata program for the ACS analyses (available online), as well as to the useful description of the method provided at the IPUMS website (https://usa.ipums.org/usa/repwt.shtml#q70).
Second, ACS estimates are subject to imputation error. Item nonresponse on the immigration questions is 4.5% on country of birth, 9.0% on year of entry, 5.2% on citizenship, and 15.1% on year of naturalization.8 The U.S. Census Bureau uses a ―hot-deck‖ method for imputing missing data on these items, but the details of their methodology are unclear. While missingness varies in magnitude,9 it is worth noting that some subpopulations, such as young adult and elderly Mexicans, have relatively high rates of missing data on key variables. To the extent that the Census Bureau’s hot-deck method does not accurately assign missing values, the naturalized population totals in the ACS will be prone to error.
Third, there may be some reporting error or inconsistencies associated with some of the immigration-related items in the ACS other than citizenship, particularly year of entry and year of naturalization. Ellis and Wright (1998) showed that there were inconsistencies in responses to questions about year of entry and place of residence one year earlier in the CPS. Recently arrived immigrants who are engaged in circular migration may find the year of entry question particularly confusing and could plausibly report the year of their first trip, last trip, or a year in between (Redstone and Massey 2004). This suggests that, at least for temporary migrants, year of entry may understate duration of U.S. residence. In a related vein, and as we discuss in more detail below in relation to the OIS data, differences in the questions used to determine year of
8 Naturalized citizens, of course, are the only persons who answer the question about year of naturalization.
Thus, 15.1% of the citizens had missing data on this question, while the other percentages reported are for the entire foreign-born sample.
9
immigration between the two data sources also lend uncertainty to the comparative estimates of the naturalized population.10
A fourth source of error in the ACS data is coverage error. By coverage error, we refer to discrepancies between the number in a given population represented in the ACS and the actual population that are not due to sampling error or reporting error. Coverage error among the foreign born can arise from inadequate representation of housing units containing foreign-born persons in the ACS sample or sampling frame, omissions of individuals from household rosters, or from errors in the sampling weights. If the number of naturalized citizens in the ACS was too low because of coverage error, then this would influence the comparison with the OIS-based estimates of the number of naturalized citizens independently of reporting error in the ACS.
Many observers suspect that coverage error is higher for the foreign-born than the native-born population, particularly among the U.S. Mexican-born population. The reason is simply that groups characterized by residential mobility and complex living arrangements, illicit activity, fear of detection, and sociopolitical marginality are less likely to be picked up in censuses or surveys (Swanson, Siegel, and Shryock 2004). A comprehensive review of this work was provided by Van Hook and Bean (1998). During the 2000s, the two leading producers of estimates of the unauthorized foreign-born population, the Office of Immigration Statistics and the Pew Hispanic Center, assumed that coverage error was, respectively, 10% (Hoefer, Rytina, and Baker 2011) and 13% (Passel and Cohn 2009) for the unauthorized foreign born, and about 2.5% for other foreign born. The OIS rested its assumption about coverage error on a survey conducted in Los Angeles that was then compared to census counts (Marcelli and Ong 2002). Pew based its assumption on the levels of enumeration error estimated for the 2000 Census, which were calculated by incorporating data from the Accuracy and Coverage Evaluation (ACE) post-enumeration survey.11 Recent evidence based on a
10 Additionally, responses to the year of entry and year of naturalization questions may suffer from year
heaping, in which respondents are more likely to report years ending in 5 or 0. Examination of the data did suggest some digit preference among respondents for these years, but also showed considerable heaping in years ending with digits 8 and 9, reflecting, we believe, actual spikes in both immigration and naturalization during the late 1990s. Because this type of heaping reflects actual trends in immigration and naturalization, we do not smooth the data. We did produce a supplementary set of results (available upon request) based on smoothed year of entry and year of naturalization data (Myers 1940). The results were very similar to those presented here. This makes sense. Year heaping resulting from digit preference would present the greatest concern if year variables were used as continuous measures, but we designed our analyses to minimize our reliance of these variables. We only use year of entry to drop pre-1990 arrivals from the sample, and for some analyses to discern between those arriving in the last five years versus five or more years. Similarly, we only used year of naturalization to classify respondents as naturalizing at age 18 or older. We discuss the limitations of these indicators and possible implications for the results in the conclusions.
11 Like previous post-enumeration surveys, the 2000 ACE reinterviewed a stratified sample of households
triangulation of three different methods that examine trends in births, deaths, and net migration, however, suggests slightly higher coverage error among all Mexican born in 2000 than estimated by the OIS and Pew (about 15–20% coverage error), but declining rates throughout the 2000 decade (Van Hook et al. 2012).12
This evidence places coverage error in the range of 2.5% (for legal foreign born) to 10–13% (for unauthorized foreign born) to 15–20% (for Mexican foreign born). Considering that coverage error is likely to be even lower among naturalized citizens than all foreign born or the Mexican born (because they are not unauthorized), we assumed a narrow range of coverage error of 0–5%. We adjusted for coverage error in selected analyses by dividing the ACS estimate by one minus the assumed coverage error rate (e.g., in the case of 5% coverage error, the adjusted ACS estimate = ACS estimate/.95).
3.2 Estimates based on Office of Immigration Statistics naturalization records
The OIS-based estimates of the naturalized citizens in 2010 were derived from the numbers of naturalizations in OIS administrative records. The OIS data on naturalizations are historical records of events (―flows‖) occurring over time, so they need to be converted to a ―stock‖ estimate of the number of naturalized citizens for a given point in time (i.e., July 2010) to be comparable with ACS estimates. Once a person becomes a naturalized citizen, they may remain living in the United States and be represented in the 2010 ACS. Alternatively, they may have died or emigrated from the United States, and therefore could not be represented in the 2010 ACS.
To account for deaths and emigration, we used the cohort-component projection method (Rowland 2003). More specifically, for each naturalization cohort, we estimated the number remaining by the time of the 2010 ACS (July 1, 2010 on average) by subtracting an estimate of deaths (D) and emigrants (E) that likely occurred during the follow-up period: that is, between the year of naturalization and July 1, 2010. For example, for a cohort age 20 that naturalized in 1995 (N20, 1995), the number of
naturalized citizens age 35 in 2010 (C35, 2010) is:
not produce separate estimates for the foreign born, Pew used the ACE to arrive at a 13% figure by assuming unauthorized rates of coverage error two to three times those for others within the same race/Hispanic origin, age, and sex grouping.
12 The three methods involve (1) comparisons of U.S. births to Mexican-born mothers with U.S.-born children
C35, 2010 = N20, 1995 – D1995–2010 – E1995–2010.
More generally, for a given cohort that naturalized at age a in year t, Ca+(2010-t), 2010 = Na, t – Dt-2010 – Et-2010.
We describe below how we estimated each component of this equation.
Naturalizations (Na, t)
Data. The OIS routinely compiles data obtained from the administrative records of legal immigrant admissions and naturalizations kept by the U.S. Department of Homeland Security. These files are not available as public-use data. The naturalization files include a record for each naturalization event occurring in the United States since the mid-1970s. Attached to each record is the demographic and immigration-related information (e.g., age, sex, country of birth, year of admission to the U.S., year of arrival to the U.S.) for the people who became citizens. Unlike the ACS, missing data do not pose significant problems for the OIS data. Out of the 5.4 million naturalization records used to produce our estimates, only 0.05% were missing on age, 0.03% on sex, 0.11% on country of birth, and 0.40% on year of arrival.13
Because no public-use data are available, the OIS generously provided a file to us containing detailed cross-tabulations of the number of naturalizations by year of naturalization, age at naturalization,14 sex, year of arrival, and region of birth (Mexico, Central American/Caribbean, Asia, Other). Combined, the cross-tabulations described the size and characteristics of 122,660 different naturalization cohorts. Together, these cohorts experienced 5.4 million naturalizations between January 1, 1990 and July 1,
13 Even though missingness in the OIS data is not high enough to bias estimates of the characteristics of
naturalized citizens, we did not want to discard the records with missing data; otherwise our estimates of naturalized citizens would be too low. Since the OIS data were given to us in the form of cross-tabulations rather than individual records, we could not use standard methods to handle missing data. Instead, we simply distributed the records with missing data proportionately across the categories of each variable (i.e., matching the observed distributions).
14 The OIS provided data for five-year age groups. We subdivided the data into single-year age groups for the
2010.15 Of course, we later combined these groups for presentation purposes, but the underlying detail gave us considerable flexibility.
Errors and Omissions in OIS Naturalization Data. Like the ACS data, the OIS data are subject to errors and omissions. First, the OIS data include only those who naturalized as adults age 18 and older. Children ages 0–17 may obtain ―derivative‖ citizenship from their parents when they naturalize, but the U.S. government does not produce easily accessible or interpretable statistics on derivative citizenship among children. We therefore limited our analyses (for both the OIS and the ACS estimates) to those who naturalized as adults age 18+.
Second, to be included in the OIS naturalization file, a person must have a matching record in the computerized OIS admission file and these files do not extend back before 1972. Thus pre-1972 arrivals (who comprised about 10% of all naturalizations between 1990 and 2010) are not in the computerized OIS naturalization file. To minimize this error, we limited our naturalization estimates (for both the OIS and the ACS) to those who arrived in the United States in 1990 or later.
Third, naturalization data were not available for the approximately 100,000 LPR records out of 1.7 million that were not originally included in DHS flow data between 2001 and 2010 due to delayed data entry. For naturalizations occurring between 2001 and 2010, we therefore proportionately adjusted the number of naturalizations upward by a small percentage in order to add back in the 100,000 missing records. Specifically, we weighted the 1,661,815 cases that naturalized after 2000 by the ratio: 1,761,816/1,661,816.
Fourth, information in the OIS data on year of arrival may be unreliable because it is based on a variety of sources (i.e., sometimes determined from other documents, sometimes self-reported, etc.). Additionally, self-reported year of arrival is based on a question about the year of the respondent’s last trip to the United States, which is different from the census question (year the respondent came to the U.S. to live). In our analyses, we therefore use year of arrival in a limited manner: namely, to identify those who arrived in 1990 or later, and to discern recently arrived immigrants (with fewer than five years of U.S. residence) from longer-resident immigrants.
Deaths (Dt-2010)
We estimated the likely number of deaths to each naturalization cohort by multiplying the appropriate age-, sex-, and year-specific annual probability of dying (qx) by the
number remaining in the cohort for each year of the follow-up period. No life table for naturalized citizens exists, so we used the life tables produced by the Social Security
15 The OIS did not report month of naturalization, so we estimated the number of naturalizations from January
Administration (Bell and Miller 2005), which estimate mortality risks for the United States based on NCHS vital statistics for ages 0–64 and Medicare files for ages 65 and older across all years of the projection period. Thus they yield more accurate estimates of old-age mortality (with less age misreporting) and reflect the mortality experiences of those eligible for Medicare, including naturalized immigrants. The Social Security Life Tables are available from the Max Planck Institute’s Human Life-Table Database (http://www.lifetable.de/). Mortality is a small component of the OIS-based estimates, and the estimates do not vary much when alternative U.S. life tables are used except for the oldest age groups (not a major concern, because over 90% of the naturalized citizens in our sample are younger than 65).
Emigrants (Et-2010)
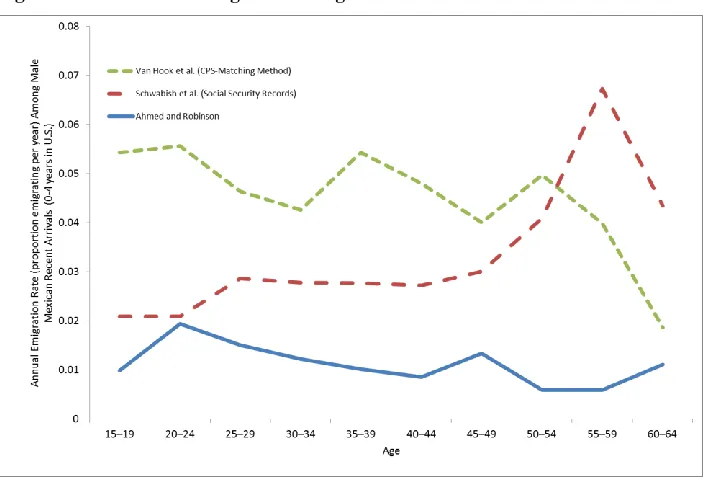
We estimated the number of emigrants for each naturalization cohort by applying a set of race-, age-, and duration-specific emigration rates each year of the projection period. Because no official statistics on emigration from the United State have been collected since 1956 (Kraly 1998), emigration among the foreign born has been estimated with a variety of indirect demographic methods, which have yielded a range of estimates. Because of uncertainty about emigration, we apply four different sets of estimates. The first assumes no emigration at all and the other three come from published estimates which roughly correspond with ―low‖, ―moderate‖, and ―high‖ levels of emigration. For the latter three, we used rates that vary by five-year age group, sex, race or country of birth (Mexico vs. other), and duration of U.S. residence (0–4, 5–9, and 10+ years).
The ―low‖ estimates are those produced by Ahmed and Robinson (1994). These are based on comparisons of cohorts followed over time between the 1980 and 1990 Censuses. The Ahmed and Robinson rates are broken down by race/ethnicity: Hispanic, white, black, and Asian. We used the Hispanic rates for Mexicans and Central/South Americans, the white rates for Europeans and Canadians, the Asian rates for all Asians, and the black rates for all other immigrants (mostly Caribbeans and Africans).
The ―moderate‖ estimates are those based on Social Security work history files (Schwabish 2009). These use a three-year discontinuation in U.S.-reported earnings as an indicator of emigration. Because unauthorized immigrants do not qualify for Social Security, the Social Security-based rates may most closely describe the emigration patterns of legal immigrants and (by extension) naturalized citizens. Our rates came from a prediction model provided to us by Schwabish which permitted us to produce annual emigration rates by age, sex, duration of residence, and Mexican origin.16 We
16 We gratefully acknowledge the assistance of Jonathan Schwabish for providing the prediction model. The
used the Mexican rates for Mexicans and Central Americans, and the non-Mexican rates for all other immigrants.
Finally, the ―high‖ estimates are those based on the CPS-matching method (Van Hook, Zhang, Bean, and Passel 2006). These use attrition from the CPS to estimate emigration. We used this method together with data from the 1996–2009 CPS to produce annual probabilities of emigration for naturalized foreign-born individuals in the CPS. We then estimated a prediction model of the probability of emigration, and used the estimated coefficients to construct predicted emigration rates by age, sex, duration of residence, and Mexican origin.17 We used the Mexican rates for Mexicans and Central Americans, and the non-Mexican rates for all other immigrants.
Figure 1 illustrates the three sets of emigration rates for male Mexican immigrants with 0–4 years of U.S. residence. Readers will notice that the ―low‖, ―moderate‖, and ―high‖ labels are broadly descriptive but are only partially accurate. Their rank order changes around age 55. At younger ages, the Ahmed and Robinson ―low‖ rates are lowest, the Van Hook ―high‖ rates are highest, and the Schwabish ―moderate‖ rates fall in the middle. However, at older ages (55+), the Van Hook ―high‖ rates fall below the Schwabish ―moderate‖ rates.
given year. The model was estimated on a person-year file that contains a record for every foreign-born Social Security recipient from the time of entry into the Social Security system until emigration or censorship. We used the coefficients to calculate the log-odds of annual emigration for each demographic group, which we then converted to predicted probabilities (i.e., annual emigration rates).
17
Figure 1: Estimates of foreign-born emigration
Projection Details
We projected forward each naturalization cohort from the year of its naturalization to July 1, 2010 (the ACS estimate date), subtracting deaths and emigrants and adding one year of age to the remaining members of the cohort for each year of the follow-up period.18 The first and last years of the follow-up period consisted of only six months. In the first year, we assumed naturalizations occurred evenly throughout the year, so the duration of the first year averaged six months. In the last year (2010), the projection period was only six months (from January 1 through July 1). The projections were conducted using Stata for all 122,660 naturalization cohorts. To compare the projected numbers of naturalized citizens for July 1, 2010 with 2010 ACS estimates, we collapsed the surviving cohorts into manageable groupings: by country/region; by country/region,
18 We estimated the number of deaths and emigrants simultaneously for each year of the follow-up period:
sex, and duration of residence (>5 and 5+ years); and by Mexican origin, age grouping (18–29, 30–39, and 40+), and sex.
3.3 Comparing the Office of Immigration Statistics with the American Community Survey estimates
We compare each of the OIS- and ACS-based estimates of naturalizations. We report the difference as a raw number (ACS – OIS) and a percentage difference (ACS – OIS) / OIS x 100. We take into consideration three criteria for determining the presence of reporting error. First, the difference between the OIS-based estimates of naturalizations for a given sub-population (e.g., Mexican immigrant women) and the corresponding ACS estimate must be significantly different: that is, the OIS estimate must fall outside the bounds of the ACS 95% confidence interval. Second, the ACS estimate must fall outside the bounds of OIS-based estimates given a plausible range of assumptions about emigration. Third, the OIS estimate must fall outside the bounds of the ACS estimate given a plausible range of assumptions about coverage error. In reporting results, we first focus in Tables 1–3 on the size of the OIS–ACS differences and whether they may be explained by sampling error or by alternative assumptions about emigration. Later, in Tables 4–5, we add in the complexity of making alternative assumptions about coverage error.
4. Results
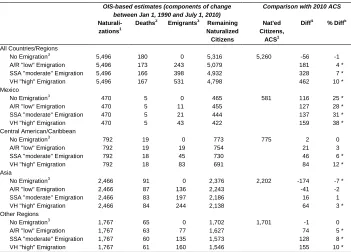
Table 1: Estimated naturalized citizens (thousands) based on OIS naturalization records and ACS, by region of birth, July 2010 (see notes below)
OIS-based estimates (components of change between Jan 1, 1990 and July 1, 2010)
Comparison with 2010 ACS
Naturali-zations1
Deaths2 Emigrants3 Remaining Naturalized Citizens
Nat'ed Citizens,
ACS1
Diff4 % Diff5
All Countries/Regions No Emigration3
5,496 180 0 5,316 5,260 -56 -1
A/R "low" Emigration 5,496 173 243 5,079 181 4 *
SSA "moderate" Emigration 5,496 166 398 4,932 328 7 *
VH "high" Emigration 5,496 167 531 4,798 462 10 *
Mexico
No Emigration3
470 5 0 465 581 116 25 *
A/R "low" Emigration 470 5 11 455 127 28 *
SSA "moderate" Emigration 470 5 21 444 137 31 *
VH "high" Emigration 470 5 43 422 159 38 *
Central American/Caribbean
No Emigration3 792 19 0 773 775 2 0
A/R "low" Emigration 792 19 19 754 21 3
SSA "moderate" Emigration 792 18 45 730 46 6 *
VH "high" Emigration 792 18 83 691 84 12 *
Asia
No Emigration3 2,466 91 0 2,376 2,202 -174 -7 *
A/R "low" Emigration 2,466 87 136 2,243 -41 -2
SSA "moderate" Emigration 2,466 83 197 2,186 16 1
VH "high" Emigration 2,466 84 244 2,138 64 3 *
Other Regions
No Emigration3 1,767 65 0 1,702 1,701 -1 0
A/R "low" Emigration 1,767 63 77 1,627 74 5 *
SSA "moderate" Emigration 1,767 60 135 1,573 128 8 *
VH "high" Emigration 1,767 61 160 1,546 155 10 *
Notes: Estimates are for naturalized citizens who naturalized between 1/1/1990 and 7/1/2010.
1 Excludes naturalizations of immigrants who arrived before 1990 or who naturalized as children aged 0–17.
2
Based on Social Security administration life table (Bell and Miller 2005) 3
A/R = Ahmed and Robinson 1994 ("low"), SSA = Schwabish 2009 ("moderate"), VH = Van Hook et al. 2006 ("high") 4
Diff = (ACS – OIS). 5
%Diff = (ACS – OIS)/OIS * 100.
* The absolute difference between the OIS and ACS estimates is greater than twice the standard error of the ACS estimates.
7% to 10% and becomes statistically significant when we apply the ―low‖, ―moderate‖, and ―high‖ emigration rates respectively.
Table 1 indicates that the OIS–ACS difference is concentrated largely among Mexican immigrants, where the discrepancy is significant and ranges from 25% (assuming no emigration) to 38% (assuming high emigration). Unlike the previous work of Passel and Clark (1997), comparison of ACS and OIS estimates does not suggest significant levels of misreporting among Central Americans/Caribbeans, for whom the ACS estimate is significantly higher than the OIS-based estimate only when assuming ―moderate‖ or ―high‖ levels of emigration. Also, when we assume no emigration among Asians, the ACS estimates significantly fewer naturalizations than are estimated in the OIS data. This is probably because emigration is almost certainly not nonexistent for this group. When we assume low or moderate emigration, the OIS– ACS differences are insignificant, and at high levels of emigration, the ACS-based estimate is only 3% higher than the OIS estimate. Finally, naturalizations among immigrants born elsewhere in the world are not significantly higher in the ACS when we assume no emigration. But the OIS–ACS gap increases as the assumed rate of emigration increases, from 5% to 8% to 10% respectively, at ―low‖, ―moderate‖, and ―high‖ levels of emigration.
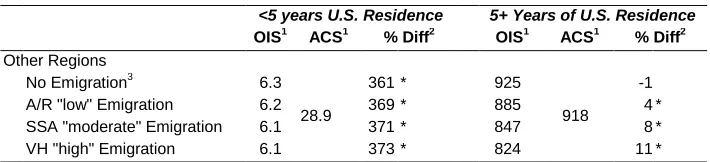
Table 2: Estimated naturalized citizens (thousands), by sex, duration of residence, and region of birth, July 2010 (see notes below)
<5 years U.S. Residence 5+ Years of U.S. Residence
OIS1 ACS1 % Diff2 OIS1 ACS1 % Diff2
Men
Mexico
No Emigration3 .6
16.0
2,587 * 183
250
37 *
A/R "low" Emigration .6 2,588 * 178 41 *
SSA "moderate" Emigration .6 2,589 * 175 43 *
VH "high" Emigration .6 2,590 * 162 54 *
Central American/Caribbean
No Emigration3 1.2
17.3
1,366 * 322
320
-1
A/R "low" Emigration 1.2 1,382 * 313 2
SSA "moderate" Emigration 1.1 1,404 * 305 5 *
VH "high" Emigration 1.1 1,431 * 282 13 *
Asia
No Emigration3 5.0
24.7
395 * 1,029
935
-9 *
A/R "low" Emigration 4.9 403 * 960 -3
SSA "moderate" Emigration 4.9 403 * 956 -2
VH "high" Emigration 4.9 404 * 949 -1
Other Regions
No Emigration3 4.5
20.8
360 * 767
734
-4 *
A/R "low" Emigration 4.4 369 * 732 0
SSA "moderate" Emigration 4.4 369 * 715 3
VH "high" Emigration 4.4 370 * 711 3
Women
Mexico
No Emigration3 .8
13.8
1,689 * 281
302
7 *
A/R "low" Emigration .8 1,700 * 276 9 *
SSA "moderate" Emigration .8 1,727 * 268 13 *
VH "high" Emigration .8 1,726 * 259 17 *
Central American/Caribbean
No Emigration3 1.2
14.2
1,097 * 449
424
-6 *
A/R "low" Emigration 1.2 1,105 * 439 -3
SSA "moderate" Emigration 1.2 1,128 * 423 0
VH "high" Emigration 1.2 1,127 * 407 4 *
Asia
No Emigration3 11.3
35.0
208 * 1,331
1,207
-9 *
A/R "low" Emigration 11.2 212 * 1,266 -5 *
SSA "moderate" Emigration 11.1 214 * 1,213 0
Table 2: (continued)
<5 years U.S. Residence 5+ Years of U.S. Residence
OIS1 ACS1 % Diff2 OIS1 ACS1 % Diff2
Other Regions
No Emigration3 6.3
28.9
361 * 925
918
-1
A/R "low" Emigration 6.2 369 * 885 4 *
SSA "moderate" Emigration 6.1 371 * 847 8 *
VH "high" Emigration 6.1 373 * 824 11 *
Notes: Estimates are for naturalized citizens who naturalized between 1/1/1990 and 7/1/2010
1
Excludes naturalized immigrants who arrived before 1990 or who naturalized as children aged 0–17. 2
%Diff = (ACS - OIS)/OIS * 100 3
A/R = Ahmed and Robinson 1994 ("low"), SSA = Schwabish 2009 ("moderate"), VH = Van Hook et al. 2006 ("high") *
Absolute difference between OIS and ACS estimate is greater than twice the standard error of the ACS estimates.
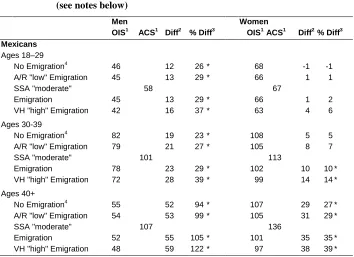
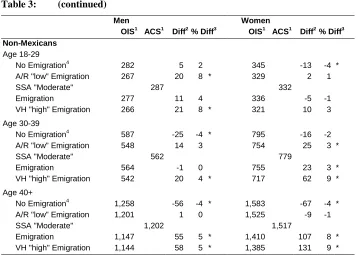
In Table 3, the OIS and ACS estimates are presented for Mexican and non-Mexican men and women by age group by varying rates of emigration. We note that the OIS estimates do not always decline as emigration increases from the ―low‖ to the ―moderate‖ to the ―high‖ series because of age crossovers in various emigration estimates. Regardless of assumptions about emigration, the ACS estimates are especially high relative to the OIS-based estimates among Mexican men of all age groups and Mexican women aged 40 and older. The same pattern does not hold among non-Mexicans, where the discrepancy remains relatively low across all age groups.
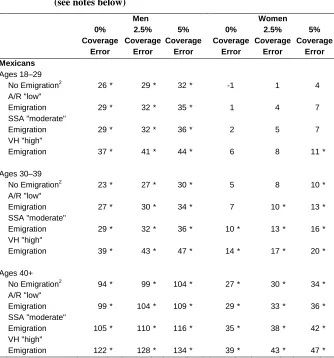
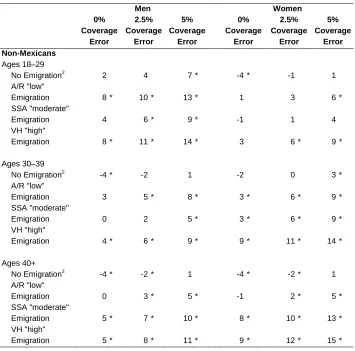
Up to this point, our ACS estimates of naturalization have not been adjusted for possible undercoverage of the foreign born in the ACS. To illustrate the impact of coverage error, we report in Table 4 percentage differences between the ACS and the OIS estimates at three levels of assumed coverage error. For all groups, the OIS–ACS discrepancies increase as rates of assumed emigration and coverage error increase. For example, among Mexican-born men aged 18–29, the gap is about 26% if no coverage error is assumed (assuming no emigration). This increases to 29% when we assume 2.5% coverage error and to 32% when we assume 5% coverage error. The same pattern holds for Mexican women aged 18–29, though the magnitude of overreporting is substantially lower, ranging from -1% to 4% (assuming no emigration), and is not significant in any instance. This shows that the naturalization reporting error estimates shown in Tables 1–3 are low-end estimates. They will be higher for groups that are underrepresented in the ACS.
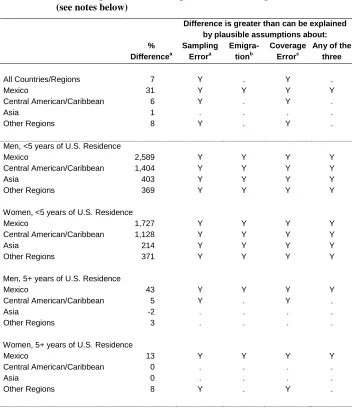
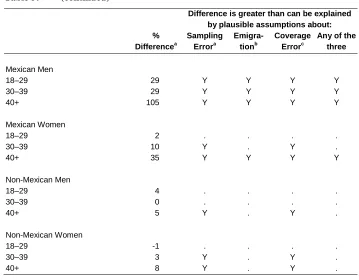
emigration and no coverage error), (2) alternative plausible assumptions about emigration (assuming no coverage error), and (3) alternative plausible assumptions about coverage error (assuming moderate emigration). Finally, the last column indicates with a ―Y‖ whether the OIS–ACS difference is so large that it cannot be explained by any of these three sources of error and is therefore very likely to reflect reporting error. For example, the OIS–ACS gap for Mexicans is 31% if we assume ―moderate‖ levels of emigration and no coverage error (2nd row). The ―Y‖ in the second column indicates that this gap is statistically significant. The ―Y‖ in the third column indicates that the gap remains no matter what we assume about emigration (with no coverage error). The ―Y‖ in the fourth column indicates that the gap remains no matter what we assume about coverage error (with moderate emigration). Finally, ―Y‖ in the fifth column indicates that the gap remains significant under all combinations of plausible assumptions about sampling error, emigration, and coverage error.
Table 3: Estimated naturalized citizens of all years of U.S. residence (thousands), by age, sex, and Mexican origin, July 2010 (see notes below)
Men Women
OIS1 ACS1 Diff2 % Diff3 OIS1 ACS1 Diff2 % Diff3
Mexicans
Ages 18–29
No Emigration4 46
58
12 26 * 68
67
-1 -1
A/R "low" Emigration 45 13 29 * 66 1 1
SSA "moderate"
Emigration 45 13 29 * 66 1 2
VH "high" Emigration 42 16 37 * 63 4 6
Ages 30-39
No Emigration4 82
101
19 23 * 108
113
5 5
A/R "low" Emigration 79 21 27 * 105 8 7
SSA "moderate"
Emigration 78 23 29 * 102 10 10 *
VH "high" Emigration 72 28 39 * 99 14 14 *
Ages 40+
No Emigration4 55
107
52 94 * 107
136
29 27 *
A/R "low" Emigration 54 53 99 * 105 31 29 *
SSA "moderate"
Emigration 52 55 105 * 101 35 35 *
Table 3: (continued)
Men Women
OIS1 ACS1 Diff2 % Diff3 OIS1 ACS1 Diff2 % Diff3
Non-Mexicans
Age 18-29
No Emigration4 282
287
5 2 345
332
-13 -4 *
A/R "low" Emigration 267 20 8 * 329 2 1
SSA "Moderate"
Emigration 277 11 4 336 -5 -1
VH "high" Emigration 266 21 8 * 321 10 3
Age 30-39
No Emigration4 587
562
-25 -4 * 795
779
-16 -2
A/R "low" Emigration 548 14 3 754 25 3 *
SSA "Moderate"
Emigration 564 -1 0 755 23 3 *
VH "high" Emigration 542 20 4 * 717 62 9 *
Age 40+
No Emigration4 1,258
1,202
-56 -4 * 1,583
1,517
-67 -4 *
A/R "low" Emigration 1,201 1 0 1,525 -9 -1
SSA "Moderate"
Emigration 1,147 55 5 * 1,410 107 8 *
VH "high" Emigration 1,144 58 5 * 1,385 131 9 *
Notes: Estimates are for naturalized citizens who naturalized between 1/1/1990 and 7/1/2010
1 Excludes naturalized immigrants who arrived before 1990 or who naturalized as children aged 0–17.
2 Diff = (ACS - OIS) 3 %Diff = (ACS - OIS)/OIS * 100 4
A/R = Ahmed and Robinson 1994 ("low"), SSA = Schwabish 2009 ("moderate"), VH = Van Hook et al. 2006 ("high") * Absolute difference between OIS and ACS estimate is greater than twice the standard error of the ACS estimates.
Table 4: Percentage difference between OIS and ACS estimates while varying ACS coverage error assumptions, by Mexican origin, age, and sex (see notes below)
Men Women
0% Coverage
Error
2.5% Coverage
Error
5% Coverage
Error
0% Coverage
Error
2.5% Coverage
Error
5% Coverage
Error
Mexicans
Ages 18–29
No Emigration2 26 * 29 * 32 * -1 1 4
A/R "low"
Emigration 29 * 32 * 35 * 1 4 7
SSA "moderate"
Emigration 29 * 32 * 36 * 2 5 7
VH "high"
Emigration 37 * 41 * 44 * 6 8 11 *
Ages 30–39
No Emigration2 23 * 27 * 30 * 5 8 10 *
A/R "low"
Emigration 27 * 30 * 34 * 7 10 * 13 *
SSA "moderate"
Emigration 29 * 32 * 36 * 10 * 13 * 16 *
VH "high"
Emigration 39 * 43 * 47 * 14 * 17 * 20 *
Ages 40+
No Emigration2 94 * 99 * 104 * 27 * 30 * 34 *
A/R "low"
Emigration 99 * 104 * 109 * 29 * 33 * 36 *
SSA "moderate"
Emigration 105 * 110 * 116 * 35 * 38 * 42 *
VH "high"
Table 4: (continued)
Men Women
0% Coverage
Error
2.5% Coverage
Error
5% Coverage
Error
0% Coverage
Error
2.5% Coverage
Error
5% Coverage
Error
Non-Mexicans
Ages 18–29
No Emigration2 2 4 7 * -4 * -1 1
A/R "low"
Emigration 8 * 10 * 13 * 1 3 6 *
SSA "moderate"
Emigration 4 6 * 9 * -1 1 4
VH "high"
Emigration 8 * 11 * 14 * 3 6 * 9 *
Ages 30–39
No Emigration2 -4 * -2 1 -2 0 3 *
A/R "low"
Emigration 3 5 * 8 * 3 * 6 * 9 *
SSA "moderate"
Emigration 0 2 5 * 3 * 6 * 9 *
VH "high"
Emigration 4 * 6 * 9 * 9 * 11 * 14 *
Ages 40+
No Emigration2 -4 * -2 * 1 -4 * -2 * 1
A/R "low"
Emigration 0 3 * 5 * -1 2 * 5 *
SSA "moderate"
Emigration 5 * 7 * 10 * 8 * 10 * 13 *
VH "high"
Emigration 5 * 8 * 11 * 9 * 12 * 15 *
Notes 1
(ACS - OIS)/OIS * 100 2
Table 5: Sensitivity of OIS–ACS difference to sampling error, assumptions about emigration, and assumptions about coverage error
(see notes below)
Difference is greater than can be explained by plausible assumptions about:
%
Differencea
Sampling
Errora
Emigra- tionb
Coverage
Errorc
Any of the three
All Countries/Regions 7 Y . Y .
Mexico 31 Y Y Y Y
Central American/Caribbean 6 Y . Y .
Asia 1 . . . .
Other Regions 8 Y . Y .
Men, <5 years of U.S. Residence
Mexico 2,589 Y Y Y Y
Central American/Caribbean 1,404 Y Y Y Y
Asia 403 Y Y Y Y
Other Regions 369 Y Y Y Y
Women, <5 years of U.S. Residence
Mexico 1,727 Y Y Y Y
Central American/Caribbean 1,128 Y Y Y Y
Asia 214 Y Y Y Y
Other Regions 371 Y Y Y Y
Men, 5+ years of U.S. Residence
Mexico 43 Y Y Y Y
Central American/Caribbean 5 Y . Y .
Asia -2 . . . .
Other Regions 3 . . . .
Women, 5+ years of U.S. Residence
Mexico 13 Y Y Y Y
Central American/Caribbean 0 . . . .
Asia 0 . . . .
Other Regions 8 Y . Y .
Table 5: (continued)
Difference is greater than can be explained by plausible assumptions about:
%
Differencea
Sampling
Errora
Emigra- tionb
Coverage
Errorc
Any of the three
Mexican Men
18–29 29 Y Y Y Y
30–39 29 Y Y Y Y
40+ 105 Y Y Y Y
Mexican Women
18–29 2 . . . .
30–39 10 Y . Y .
40+ 35 Y Y Y Y
Non-Mexican Men
18–29 4 . . . .
30–39 0 . . . .
40+ 5 Y . Y .
Non-Mexican Women
18–29 -1 . . . .
30–39 3 Y . Y .
40+ 8 Y . Y .
Notes a
Assuming moderate emigration (SSA series) and no coverage error (these estimates come from Table 1, last column for the top panel; Table 2, 3rd and 6th columns for the middle panel; and Table 3, 4th and 8th columns for the bottom panel).
b
The ACS estimate (assuming no coverage error) falls significantly outside the range of the OIS estimates while varying emigration assumptions.
c
The OIS estimate (assuming moderate emigration) falls outside the range of the ACS estimates while varying coverage error assumptions.
Y = yes
5. Conclusion
of the misreporting of naturalization have not been generated since the mid-1990s (Passel and Clark 1997). Our objective in this paper has been to update this research and provide the first set of estimates of reporting error among immigrants in the American Community Survey.
Naturalization reporting error was estimated by comparing a demographic estimate based on administrative data from the Department of Homeland Security’s Office of Immigration Statistics, with the number of naturalizations reported in the 2010 ACS. Similar to the earlier work of Passel and Clark (1997), we find that the ACS estimates of naturalized citizens are much higher than the OIS-based estimates among immigrants from all regions of the world who have lived in the United States fewer than five years. Among immigrants residing in the United States for five or more years, the OIS–ACS discrepancy is concentrated among those born in Mexico, especially men of all ages and women age 40 or older. In fact, the discrepancy is particularly large for both men and women age 40+, which is a little surprising given that the unauthorized population is concentrated among young and working-aged adults, and we expected the unauthorized to be most likely to misreport. Nevertheless, these patterns cannot be explained by sampling error, alternative assumptions about emigration, or coverage error.
We can only speculate as to the reasons behind the apparently high rates of overreporting among Mexican immigrants. There remains the remote possibility that the discrepancies derive from inaccurate assessments of mortality,19 or differences in how duration of residence is measured between the OIS and ACS.20 However, the results seem more likely to reflect the fact that large portions of Mexicans, particularly young Mexican men, are unauthorized migrants. When compared with the total foreign-born population, the 2010 estimates of the unauthorized population (Hoefer, Rytina, and Baker 2011) suggest that 55% of Mexican foreign born are unauthorized compared with
19
However, we think this is unlikely. Fewer than 10% of the naturalized citizens in our analyses were age 65 or older. Additionally, supplementary analyses show that the OIS–ACS discrepancy is equally high among the older age groups with lower mortality rates (ages 40–64) and higher mortality rates (age 65+).
20 We think this is unlikely. To explain, the ACS question ―When did this person come to live in the United
28% of Central Americans/Caribbeans, 8.5% of Asians, and 10% of all other national origins. Estimates of the Mexican unauthorized population by age and sex are difficult to locate, but one report based on the 2000 Census (Passel, Van Hook, and Bean 2004) suggests that Mexican-born men and women younger than 30 were the most likely to be unauthorized among all age, sex, and national origin groups. For example, 89.4% were estimated to be unauthorized compared with 34.6% of same-aged non-Mexican foreign-born men. Such high prevalence of unauthorized status may help explain the large OIS– ACS discrepancy among young Mexican-born men.
In the case of Mexican immigrants age 40+, the results are more difficult to explain since the proportion unauthorized for this age group is lower than younger Mexican immigrants. Perhaps one clue is that most of these migrants arrived in the United States as older adults (due to the fact that we restricted the sample to immigrants arriving in the U.S. in 1990 or later to be consistent with the population reflected in the OIS data). Among all naturalized Mexican immigrants counted in the 2010 ACS, just 14% of those aged 40–64 and 8% of those aged 65+ arrived in the United States in 1990 or later. We suspect that the distinctive group of older-arriving immigrants in our sample knows little to no English, may well be unauthorized migrants reuniting with adult children who have settled in the United States, and as such may live in complex multigenerational households. To the extent that these attributes characterize older-arriving Mexican migrations, these factors may combine to lend difficulty to collecting complete and accurate survey data about them, and thus be in part responsible for their high rates of overreporting of naturalization. Supplementary analyses further reveal high levels of missing data on immigration items for this group, so missing data and inaccurate missing data allocations may also help explain their high OIS–ACS gap in the number of naturalized citizens.
Finally, our analyses suggest that our conclusions are robust to alternative assumptions about emigration and coverage error. Even if there were no emigration and no coverage error at all, the ACS estimates would be higher than the OIS estimates for many groups. And, when we assumed higher (nonzero) emigration, this reduced the OIS-based estimates, which then further increased the OIS–ACS discrepancy. Similarly, when we accounted for coverage error of the foreign born in the ACS, this again increased the gap between OIS and ACS estimates. Moreover, it is clear that if coverage error for some groups (such as Mexican male immigrants) were even higher than 5% (which we assumed to be on the ―high end‖), this would serve to further increase the OIS–ACS gap. Passel and Clark’s (1997) evaluation of naturalization reporting error appears to have assumed no coverage error and low emigration rates. Thus their estimates probably represented lower-bound estimates of reporting error.
References
Ahmed, B. and Robinson, J.G. (1994). Estimates of Emigration of the Foreign-born Population: 1980-1990. Washington, DC: Population Division, U.S. Census Bureau (Population Division Working Paper No. 9).
Bell, F.C. and Miller, M.L. (2005). Life Tables for the United States Social Security Area 1900-2100. Actuarial Study No. 116. Social Security Administration. Office of the Actuary.
Bloemraad, I. (2006). Becoming a Citizen: Incorporating Immigrants and Refugees in the United States and Canada. University of California Press.
Bloemraad, I., Korteweg, A., and Yurdakul, G. (2008). Citizenship and Immigration: Multiculturalism, Assimilation, and Challenges to the Nation-State. Annual Review of Sociology 34(1): 153-79. doi:10.1146/annurev.soc.34.040507.134608. Costanzo, J.M., Davis, C.J., and Malone, N. (2002). Guide to International Migration
Statistics: The Sources, Collection, and Processing of Foreign-Born Population Data at the U.S. Census Bureau. Washington, DC: U.S. Census Bureau (Population Division Working Paper #68).
DeSipio, L. (2001). Building America, One Person at a Time: Naturalization and Political Behavior of the Naturalized in Contemporary U.S. Politics. In: Mollenkopf, J. and Gerstle, G. (eds.). E Pluribus Unum? Immigrant, Civic Life and Political Incorporation. New York: Russell Sage Foundation: pp. 67-106.
Ellis, M., and Wright, R. (1998). When Immigrants are Not Migrants: Counting Arrivals of the Foreign-Born Using the U.S. Census. International Migration Review 32(1): 127-44. doi:10.2307/2547563.
Fix, M. and Zimmermann, W. (2001). All under One Roof: Mixed-Status Families in an Era of Reform. International Migration Review 35(134): 397-419.
Haddal, C.C. (2010). Border Security: The Role of the U.S. Border Patrol. Washington, DC: Congressional Research Service.
Kraly, E.P. (1998). Emigration: Implications for U.S. Immigration Policy Research. In: Migration Between Mexico and the United States: Binational Study, Vol. 2 Research Reports and Background Materials. Mexico City and Washington, DC: Mexican Ministry of Foreign Affairs and the U.S. Commission on Immigration Reform: pp. 587-618.
Marcelli, E.A. and Ong, P.M. (2002) 2000 Census Coverage of Foreign-Born Mexicans in Los Angeles County: Implications for Demographic Analysis. Paper presented at the 2002 Annual Meeting of the Population Association of America, Atlanta, GA.
Minnesota Population Center (2012). Replicate Weights in the American Community Survey / Puerto Rican Community Survey. Minneapolis, MN: University of Minnesota. Accessed 3/13/2012 on-line at: http://usa.ipums.org/usa/repwt.shtml.
Myers, R.J. (1940). Errors and Bias in the Reporting of Ages in Census Data. Transactions of the Actuarial Society of America 41(2): 395-415.
Passel, J.S. and Clark, R.L. (1997). How Many Naturalized Citizens Are There? An Assessment of Data Quality in the Decennial Census and CPS. Paper presented at the Annual Meeting of the Population Association of America, Washington, DC. March 1997.
Passel, J.S. and Cohn, D. (2009). A Portrait of Unauthorized Immigrants in the United States. Washington, DC: Pew Hispanic Center.
Passel, J.S., Clark, R.L., and Fix, M. (1997). Naturalization and Other Current Issues in U.S. Immigration: Intersections of Data and Policy. In: Proceedings of the Social Statistics Section of the American Statistical Association: 1997. Alexandria, VA: American Statistical Association.
Passel, J.S., Van Hook, J., and Bean, F.D. (2006). Narrative Profile with Adjoining Tables of Unauthorized Migrants and Other Immigrants, Based on Census 2000: Characteristics and Methods. Immigration Studies Whitepapers No. 3, Sabre Systems, Washington, DC. http://sabresystems.com/sd_whitepapers_ immigration.asp.
Portes, A. and Rumbaut, R.G. (2006). Immigrant America: A Portrait. Berkeley, CA: University of California Press.
Redstone, I. and Massey, D.S. (2004). Coming to Stay: An Analysis of the U.S. Census Question on Immigrants' Year of Arrival. Demography 41(4): 721-38.
doi:10.1353/dem.2004.0035.
Rowland, D.T. (2003). Demographic Methods and Concepts. Oxford: Oxford University Press.
Ruggles, S., Alexander, J.T., Genadek, K., Goeken, R., Schroeder, M.B., and Sobek, M. (2010). Integrated Public Use Microdata Series: Version 5.0 [Machine-readable database]. Minneapolis, MN: University of Minnesota.
Schwabish, J.A. (2009). Identifying Rates of Emigration in the United States Using Administrative Earnings Records. Washington, DC: Congressional Budget Office.
Swanson, D., Siegel, J. S., and Shryock, H. S. (2004). The Methods and Materials of Demography. San Diego, CA and London: Emerald Group Publishing.
U.S. Census Bureau (2009). American Community Survey Design and Methodology. Washington, DC: U.S. Census Bureau.
U.S. Citizenship and Naturalization Services (2012). Citizenship Through Naturalization. http://www.uscis.gov.
Van Hook, J. and Balistreri, K.S. (2006). Ineligible Parents, Eligible Children: Food Stamps Receipt, Allotments and Food Insecurity among Children of Immigrants. Social Science Research 35(1): 228-251. doi:10.1016/j.ssresearch.2004.09.001. Van Hook, J., and Bean, F.D. (1998). Estimating Underenumeration among
Unauthorized Mexican Migrants to the United States: Applications of Mortality Analyses. In: Migration Between Mexico & the United States: Binational Study, Thematic Chapters, Vol 1. Mexico City and Washington, DC: Mexican Ministry of Foreign Affairs and U.S. Commission on Immigration Reform: pp. 551-70. Van Hook, J., Bean, F.D., Bachmeier, J.D., and Tucker, C. (2012). The Hidden
Dimension: Coverage Error and the Estimation of the U.S. Unauthorized Mexican Population. [unpublished manuscript].
Van Hook, J., Brown, S.K., and Bean, F.D. (2006). For Love or Money? Welfare Reform and Immigrant Naturalization. Social Forces 85(2): 643-666.
doi:10.1353/sof.2007.0029.