ARTHROPOD MANAGEMENT
Using Marked Lygus hesperus (Knight) (Hemiptera: Miridae) Adults
to Evaluate Sweep Net Sampling in Cotton
Dale W. Spurgeon*
D.W. Spurgeon, USDA, ARS, WICSRU, 17053 N. Shafter Avenue, Shafter, CA 93263
*Corresponding author: Dale.Spurgeon@ars.usda.gov ABSTRACT
The recently elevated pest status of Lygus spp. across much of the U.S. cottonbelt has accentuated the need for improved understanding of commonly used sampling methods. A mark-release-recapture method was developed for use in sampling stud-ies of adults of the western tarnished plant bug,
Lygus hesperus (Knight), in Pima cotton (Gos-sypium barbadense L.). Adult bugs were marked with fingernail polish to facilitate their identifica
-tion and prevent flight. Marked bugs released in
sample rows at known population densities were then sampled with the standard 38-cm sweep net. Recovery of marked bugs from 1-m row sections suggested a large proportion (> 85%) of released bugs remained in sample rows. Based on two sets of pooled regressions relating numbers of collected adult bugs to expected numbers (assuming 100%
collection efficiency), estimated collection efficien -cies of the sweep net changed with cotton crop development from approximately 21.4% in smaller, less developed plants (plant heights < 50 cm on most dates) to 7.7% in more developed plants (plant heights > 52 cm). Increasing the sample unit
size from 10 to 20 sweeps improved fit of regres
-sion models for both sets of samples, but fit of the
model corresponding to less developed plants was still better than for more developed plants. These results illustrate the utility of the mark-release-recapture approach for sampling studies of adult lygus in cotton, and suggest opportunities for its
use in quantifying the influence of factors such
as time of day, plant development, and variation among samplers on population indices provided by the sweep net in cotton.
T
he western tarnished plant bug, Lygus hesperus (Knight), has long been recognized as a keypest of cotton, Gossypium spp., in the San Joaquin Valley of California (Sevacherian and Stern, 1972).
Concurrent with progress in eradication of the boll weevil (Anthonomus grandis Boheman) and the adoption of transgenic insecticidal cottons for control of lepidopterous pests, the tarnished plant bug (Lygus lineolaris [Palisot de Beauvois]) has also become a key pest of cotton in the Mid-South (Musser et al., 2007). The elevated pest status of lygus bugs, especially in the Mid-South, has accentuated the need for improved management strategies. Paramount to the development of these strategies is improved understanding of the population indices provided by commonly used relative sampling methods.
The standard 38-cm diameter sweep net is a widely used tool for sampling lygus adults in both research and crop management contexts. Several sampling studies of Lygus spp. have focused on evaluation of relative methods, including the sweep net, in comparison with one or more absolute sam-pling methods (Byerly et al., 1978; Ellington et al., 1984; Fleischer et al., 1985; Snodgrass and Scott, 1997; Zink and Rosenheim, 2004). However, the
results of these studies cannot be compared directly because of differences in the size of the samples (5 to 50 sweeps), method of sweeping (across one row, across two rows, upward through the terminal), and time during the cotton production season when samples were collected. More recent studies pur-port to evaluate sweep net sampling effectiveness
or efficiency, but make no attempt to determine collection efficiency of the sweep net or how well
Recognition of the limitations associated with meaningful population estimation by either absolute or relative sampling is necessary for the appropriate design and interpretation of sampling method evalu-ations. Because the terms associated with sampling
are often implicitly redefined or used inappropriately,
a brief review of key terms and their implications
is useful. Southwood (1978) defined an absolute
population estimate as one that could be expressed as a density per unit area, and a relative estimate as one expressed in unknown units such as per unit
effort. These definitions are not entirely adequate; a sampling method that samples a defined area but
only detects a portion of the individuals present is
not an absolute method. Implicit in the definition of
an absolute population estimate is that its magnitude depends on the magnitude of the sampled population. In other words, an absolute method accounts for all, or nearly all, of the individuals in each sampled unit. Estimates by relative methods depend on factors in addition to population size. Therefore, interpretation of relative estimates may not be straightforward.
Accuracy is the nearness of measurements to their true values (Zar, 1984). Precision, as
de-fined by Zar (1984), is a measure of the closeness
of repeated measurements of the same quantity.
This definition of precision refers explicitly to the
sampling method, not to the resulting population esti-mate. In an entomological context, absolute methods are presumed to be both accurate and precise. Rela-tive methods are not accurate, and their precision is
typically not known. Sokal and Rohlf (1987) defined
precision in a less restrictive sense, which could include precision of a population estimate. In the context of agricultural entomology, precision of a population estimate is the nearness of sample counts to each other. Sokal and Rohlf (1987) also pointed out that a biased sampling method may provide pre-cise estimates that are not accurate. For this reason, evaluations of sampling methods that rely wholly on comparisons of precision of population estimates
(coefficient of variation or relative variation) are
of limited usefulness and may be misleading. This situation is exacerbated by the fact that the distribu-tions of most insects are not random (Kuno, 1991; Morris, 1960; Strickland, 1961). Spatial variability in insect distribution can occur on multiple scales. For example, Sevacherian and Stern (1972) found that populations of L. hesperus in cotton sampled by sweep net were overdispersed, whereas Willers
et al. (1999) related within-field distributions of L.
lineolaris to large-scale variations in plant vigor that could be detected by remote sensing. Therefore, the precision of a given population estimate may depend as much on the pattern of insect distribution, the size of aggregations, and the number, distribution, and unit size of absolute samples, as on the accuracy and precision of the sampling method. In that case, highly
accurate and precise absolute methods will reflect
the spatial variation of the population being sampled, and therefore might provide population estimates that are not always consistent or precise, whereas less accurate relative methods might indicate a higher level of apparent precision. This situation was observed by Spurgeon and Mueller (1991) for nymphs of the threecornered alfalfa hopper (Spis-sistilus festinus [Say]) in soybean.
If a relative sampling method is precise, it will detect a consistent proportion of the individuals in any sample unit with a given population density and estimates of the true population can be obtained by
defining the relationship between observed counts
and the number of individuals within the sampled units. This requires some estimate of precision of the sampling method. Technically, precision of the sam-pling methods used in agricultural entomology can-not be directly determined because of the typically large variation in population levels among sample units (Morris, 1960). In addition, each sample unit is unique with respect to the size, structure, and complexity of its components (plants) containing the insects, and in respect to the numbers of insects present. Furthermore, the act of sampling changes the sampled units, precluding their repeated measure-ment. Therefore, precision of the sampling method can only be estimated indirectly, based on knowledge of the population density present in each sampled unit. In practice, that knowledge is rarely available.
estimates by absolute sampling methods do not
accurately reflect the population levels sampled by
relative methods, the estimated relationships suffer from what Montgomery and Peck (1982) referred to as measurement errors in the regressor. If these errors are not accounted for, parameter estimates of the resulting regressions are biased.
Development of a method to establish popula-tions of lygus of known magnitude for subsequent sampling would decrease the variability associated with absolute sampling methods, thereby diminishing an important source of error in sampling evaluations. The release of bugs marked in a manner to prevent
flight has been the approach used to satisfy this goal.
Wilson et al. (1984) marked L. hesperus adults using Testors paint, but those efforts were unsuccessful be-cause many of the bugs were able to free their wings.
Raulston et al. (1998) successfully used fingernail
polish for this purpose in sampling studies of the adult boll weevil. The objective of this study was to develop and validate a mark-release-recapture system
for evaluating the collection efficiency of the sweep
net for adult Lygus hesperus in cotton.
MATERIALS AND METHODS
Two experiments were performed during the spring and summer of 2008. First, the ability to mark and establish populations of L. hesperus adults was examined, with emphasis on retention of bugs
within desired test rows. Second, defined population
levels of marked bugs were used to evaluate the
col-lection efficiency of the standard 38-cm sweep net
and to relate population estimates by the sweep net to established population levels. In this experiment,
collection efficiency was defined as the numbers of
bugs collected by the sweep net compared to the numbers that would be expected if the sweep net collected all bugs within the sampled portions of row. Both experiments were conducted in a 0.46-ha plot (95 m × 48 rows) of the Pima (Gossypium barbadense l.) cultivar Phytogen 800 (Dow Agro-Sciences, Indianapolis, IN) planted in 1.02-m rows. Marking and handling of bugs. In preliminary
efforts to mark bugs, a fine paint brush was used to place a droplet of fingernail polish on the dorsum
of the abdomen of L. hesperus adults such that the wings were cemented together. Assorted brands and colors were evaluated, and most were satisfactory, although some required thinning with acetone to avoid cementing the bug to the paint brush.
Thin-ning was also intended to permit the polish to flow
between the wings and ensure the wings could not be separated. Tests in which small cohorts of bugs (usually 10) were painted with various colors
indi-cated the marking procedure eliminated flight and did not produce significant mortality over a 4- to 7-d
period (unpublished data).
Based on these preliminary results, a procedure for handling and marking bugs was established. Most lygus adults for the studies were obtained from a laboratory colony. Bugs were obtained at least 1 d before marking to ensure their cuticle was hard-ened. Adults (0- to 2-d old) from the colony were collected and held in mixed-sex groups on green bean (Phaseolus vulgaris l.) pods in an environ-mental chamber maintained at 24 °C with a 14:10 (l:D) photoperiod, both before and after marking. Several collections were made and held separately for each sample date so that a range of adult ages (typically 3- to 7-d old) would be represented. At the time of marking, groups of bugs (5 to 10) were aspirated into 55.5-ml (15-dram) plastic vials (No. 55-15, Thornton Plastics, Salt lake City, UT), lightly anesthetized with Co2, and transferred to the bottom
of a petri dish lined with moistened filter paper. The filter paper liner prevented bugs from sticking to the
container once they were painted. After painting, the petri dishes were covered by a screened lid until the polish was dried. on the day of release, marked bugs were aspirated into 55.5-ml plastic vials labeled with the adult age. Each vial contained a section of green bean pod and was closed with a snap-cap. The vial cap was penetrated by a hole (~0.8 cm diameter) positioned near the rim and closed with a rubber stopper. Bugs were subsequently released individu-ally by removing the stopper and tapping the vial. Vials were assigned to treatments according to age
so that the age distribution of bugs on any individual test date was identical for all treatments.
areas of approximately 1 m were established at the ends of each 10-m sample row by removing plants. on each subsequent sample date, the entire tier of sample rows was shifted one row farther from the
western field margin. Also, on each sample date,
two of the frames used in the evaluations of bug movement from plants were established between the tier of sample rows and the northern (or southern)
field margin. The frames were intended to provide
an estimate of retention of marked adults within the sample rows. Plants for enclosure in the frames were selected based on their similarity to those in the sample rows. The frames were placed using the procedures previously described until the 8 July sample date. Because bugs were rarely captured in the Tangle-Trap, its use was discontinued beginning on 8 July. Frames were moved to new locations for each sample date.
Consecutive samplings alternated between northern and southern tiers of rows, beginning with the northern tier, until the plant canopy was nearly closed in the northern tier (8 July). After 8 July, only the southern tier was used. Also, beginning on 23 July, sample rows in the southern tier were shifted 20
rows farther from the western field margin to avoid
large differences in plant height within the sample tier. At that time, the number of buffer rows sepa-rating sample rows was reduced from four to three.
on each sample date except 8 July a total of 280 marked bugs of undetermined sex were used. A total of 260 bugs were released into sample rows, distributing the bugs as evenly as possible within each row. Ten bugs were released into each of the frames to provide an estimate of bug availability for
sampling on each date. A different color of fingernail
polish was used on each sample date within a tier of sample rows. on most dates, released bugs ranged in age from 3 to 7 d at the time of sampling, with 40
to 70% of the bugs ≤ 5-d old. Exceptions included
10 June, when bug age only ranged from 3 to 5 d, on 24 June when bug age ranged from 2 to 8 d, and on 27 June and 11 July, when bug age ranged from 3 to 9 d. Also, wild bugs collected from alfalfa, and therefore of unknown age, were used on 30 July and 6 August. These bugs were collected and marked 3 to 4 d before release.
Marked adult L. hesperus were released into sample rows and frames after 19:00 h on the evening before sampling. Samples were collected between 09:15 and 09:45 h the following morning. Each row was sampled by taking 10 sweeps with a standard 38-under the frame were leveled and the base of the
frame was sealed with soil. The top edge of each frame was then coated with Tangle-Trap adhesive (The Tanglefoot Co., Grand Rapids, MI). Burial of the bottom surface of the frame and coating of the top surface with adhesive was intended to prevent bugs from leaving the plants by walking.
Bug movement from plants was evaluated on 30 May and 3 and 6 June. Plant height from the soil sur-face to the mainstem terminal averaged 17.0, 20.8, and 20.8 cm on the respective dates. Corresponding num-bers of mainstem true leaves were 7.1, 7.8, and 8.2. Median fruiting phenologies were either sub-pinhead (squares < 2 mm in width, including bracteoles, 30 May), or pinhead (bud enclosed by the bracteoles < 3-mm diameter, 3 and 6 June). For each test date, 10 marked bugs of undetermined sex were released onto the upper leaves of separate plants after 19:00 h (PDT). The following morning (between 09:00 and 10:00 h), the plants, frame, and surrounding soil surface were examined for marked bugs. Recovered bugs were recorded as captured in the adhesive, recovered dead, or recovered alive. Each frame was moved to a new row section for each test.
Determination of sweep net collection ef-ficiency. Sampling was conducted on 12 dates (10, 20, 24, and 27 June; 1, 3, 8, 11, 16, 23, and 30 July; 6 August). For each sample date we used four population levels (1, 2, 4, and 6 adult bugs/ row m) that were established on eight parallel 10-m row sections. Each population level was replicated twice on each date using a completely randomized design. The only deviation from this design was on 8 July, when 72 bugs were inadvertently released into a row assigned to the 60 bugs/row treatment. The
study field was characterized by a marked change
in soil type near its southern margin, which resulted in much smaller plants compared with plants in the
remainder of the field. This difference was exploited
to allow concurrent evaluations in plants of similar fruiting phenology but with different plant heights and canopy development. A tier of study rows was
established on each end of the field. The tier on the northern end of the field began approximately 15 m from the northern field margin. The tier on the
southern end began about 10 m from the southern
margin. Both tiers extended 10 m toward the field
center. The outermost row of each study area was
cm sweep net. Pendulum sweeps were used, with one pass of the net across one row constituting a sweep. All samples were collected by the same person, and
the time to collect each sample was recorded to provide a measure of consistency of walking speed down the row. Concurrent with sample collection, plants within the frames were examined for marked bugs and to collect plant measurements. Beginning on 1 June, plants within the frames were cut into pieces for inspection because of increasing plant size. Plant measurements included the number of plants enclosed by the frame. Also, three plants within each frame were examined to determine plant height (from the soil surface to the terminal), most developed fruiting structure, and number of mainstem nodes. Plant fruit were categorized as pinhead square (de-veloping bud < 3-mm diameter), matchhead square (bud between 3- and 6-mm diameter), one-third grown square (bud > 6-mm diameter), candle (petals
elongated but not open), bloom (open flower with
white petals), or boll. Counts of mainstem nodes
began with the first true leaf above the cotyledons
and ended with the uppermost unrolled leaf.
linear regression (PRoC MIXED, SAS ver. 9.2, SAS Institute, Cary, NC) was used to examine relationships between population levels of marked bugs that were released and numbers of marked bugs recovered by the sweep net for each sample date. For these calculations, we assumed each pass of the sweep net sampled 0.38 m of row, resulting in a total of 3.8 m of sampled row per 10 sweeps. The expected number of bugs collected,
assum-ing 100% collection efficiency (number of bugs
released in a row × 3.8 m/10 m), was used as the independent variable, and the number of bugs col-lected by the sweep net was used as the dependent variable. The regression equations for all sample dates were examined for common slopes (littell et al., 2002). Because global tests of common slopes sometimes omit useful information contained in the individual slopes (littell et al., 2002), single degree of freedom contrasts of the regressions were also examined. Based on these analyses, regres-sions from the various dates were pooled into two groups, and each group was described by a common regression equation. For each analysis, the data were examined for evidence of heterogeneity of variance and non-normality of errors by inspection of residual and normal quantile-quantile plots, re-spectively. Based on these plots the untransformed counts were used in all analyses.
The sample rows were designed to accommodate 10-sweep samples because of logistical constraints imposed by the availability of bugs and the labor associated with marking. However, a 10-sweep sample is smaller than that used in many research
or monitoring programs. To examine the influence of sample size on model fit, duplicate 10-sweep
samples within a sample date were pooled to make a single 20-sweep sample for each combination of population level and sample date. The relationship between numbers of bugs collected and expected numbers of bugs was re-examined using linear regressions as for the 10-sweep samples. The
em-phasis of this analysis was to examine the influence of sample size on model fit.
RESULTS AND DISCUSSION
Evaluation of bug retention on plants. Pre-liminary studies indicated most marked bugs placed on plants within the frames remained on the row section, although it was apparent that many bugs did not remain on the plants on which they were originally placed. Recovery of live bugs from the frames ranged from 70 to 100%, and averaged 92.5%. Three (2.5%) of the 120 released bugs were found dead, and 2 (1.7%) were captured in the adhesive on the top edge of the frame base. Four released bugs (3.3%) were not located. These results indicated a high probability that population levels of marked bugs could be established and maintained long enough to facilitate subsequent sampling activities.
Determination of sweep net collection
ef-ficiency. At the initiation of sampling studies to
evaluate the collection efficiency of the sweep net
(10 June), the median stage of fruit development within the frames was matchhead square. Plant counts in the frames indicated populations of
about 117,500 plants/ha on the northern field end
and 106,900 plants/ha on the southern end. When sampling was discontinued in the northern tier of sample rows (early bloom, 8 July), plants within the frames averaged 67.5 cm in height (Table 1) and the canopy in the sample rows was closing. When sampling terminated in the southern tier of rows the plants were at cut-out and few squares were present, despite attaining an average plant height of only 51.4 cm (Table 1). Plant development in the
southern tier of rows was never sufficient to result
Table 1. Mean plant height, number of true-leaf nodes, and median stage of fruiting development (n = 6) from two 1-m row
lengths corresponding to sample dates in evaluation of sweep net collection efficiency for Lygus hesperus adults in cotton
Sample date Field end Plant height (cm) No. nodes Fruiting stage
10 June North 22.8 9.2 matchhead square
20 June South 22.8 10 matchhead square
24 June North 41.9 14.3 one-third grown square
27 June South 29.9 13.3 one-third grown square
1 July North 55.3 15.7 candle
3 July South 39.4 14.3 one-third grown square
8 July North 67.5 18.2 bloom
11 July South 47.0 16.2 candle
16 July South 53.3 16.2 boll
23 July South 52.8 17.5 boll
30 July South 52.2 17.3 boll
6 August South 51.4 17.2 boll
Based on the recovery of bugs from the frames, about 86.2% (207 of 240) of released bugs were available for capture at the time of sampling. only one bug (0.8%) was recovered from the adhesive on the frames before use of the adhesive was discontin-ued. over the duration of the study 13 bugs (5.4%) were recovered dead within the frames. Most bugs recovered dead were partially eaten, and predation by both nabids and ants was observed. only 7.9% of released bugs could not be located. Recovery of live marked adult L. hesperus from frames on indi-vidual sample dates ranged from 70% (16 July and
6 August) to 100% (1 and 3 July). Recovery was ≥
80% on nine of the 12 sample dates, so we made no effort to adjust population levels of released adult L. hesperus to account for mortality or dispersal.
Average times to collect the sweep samples were remarkably consistent, ranging from 6.4 to 7.4 s/10 sweeps. Sampling times on the two sample dates with the largest averages (8 July, 7.4 s; 16 July, 7.3 s) were recorded by a different individual than on other dates (range from 6.4 to 6.8 sec). Thus, differences in sampling times observed among dates appeared to
re-flect differences caused by the person recording times
rather than any characteristic of the sample rows. A shortcoming of many studies of sweep net sampling is the inadequate description of the sampling procedure. The relevance of the sample collection times in this study lie in the information they provide investiga-tors seeking to standardize sampling protocols or to emulate the technique reported herein.
Naturally occurring L. hesperus adults were detected in sweep net samples on several dates.
However, their numbers were low (usually ≤ 1
per 10-sweep sample) and no effort was made to accurately quantify their population levels. When the relationship between numbers of marked bugs collected by the sweep net and expected numbers of bugs was examined for each sample date, slopes of the regressions ranged from 0.045 to 0.263 (Table 2).
Seven of the 12 slopes were significantly different
from zero (P < 0.05) although none of the intercepts was different from zero (P = 0.200 to 0.944). The slope of the regression corresponding to samples
col-lected on 27 June was not significantly different from zero (Table 2) because five bugs were collected from
one of the rows into which 10 bugs were released. This number was greater than the number of bugs
expected (3.8) for a sweep net collection efficiency
of 100%. No more than two bugs were collected from this population level on any other date, and 16 of the 24 samples at the 1 bug/row m population level yielded counts of zero. The 1 July samples were collected from the northern tier of rows, and the slope (0.089) exhibited a marked departure from the previous sample from the northern tier (24 June,
Table 2). This reduction in collection efficiency ap -peared to correspond with an increase in plant devel-opment, including increased plant height (Table 1), a noticeably wider canopy, and a prevalence of lateral fruiting branches compared with the previous sample date. Although the following sample date from the
northern tier produced a significant regression (8 July,
Slopes of regression equations were also reduced on 16 July and 30 July (Table 2). on these sample dates, plant heights (Table 1) were approaching those
first associated with a reduced regression slope in the
northern tier of rows (1 July). However, the canopy in rows of the southern tier was noticeably less de-veloped, and reduced slopes were not observed in these rows on other dates with similar plant heights (23 July, 6 August). It is possible that at least a part of the reductions in the slopes observed on 16 and 30 July was related to inadequate marking of some bugs. on 16 July a plaque of polish was found unattached within the sweep net during sampling, indicating that at least one adult lost the applied mark. This date was also associated with the lowest recovery rate (70%) from the frames. on the evening before
30 July, five bugs were observed to separate their
wings during releases. These bugs were killed and replaced at the time of release. However, plaques of polish were still noted in the sweep net at the time of sampling on the day following release. Also, on
that date one marked bug was observed to fly from
a frame despite an otherwise high recovery rate (95%). A plaque of polish was also recovered from the sweep net during sampling on 10 June, when the regression slope was much higher. It seems unlikely that the losses of marks from the bugs on 16 and 30 July could have been wholly responsible for the reduced slopes of regressions on those dates. It is more plausible that the increasingly complex plant structure associated with advanced stages of fruiting development resulted in the more variable sweep net
collection efficiency compared to smaller plants of
simpler structure. Additional research is necessary to resolve the factors responsible for the inconsistent recovery rates from the more developed plants.
Tests for a common slope among all individual regressions did not suggest a need to separate the regressions into groups (F = 1.66; df = 11, 72; P = 0.100). However, single degree of freedom con-trasts of the regressions indicated that not all slopes were equal. Based on these contrasts, the individual regressions were combined into two groups. The
first of these groups contained all sample dates
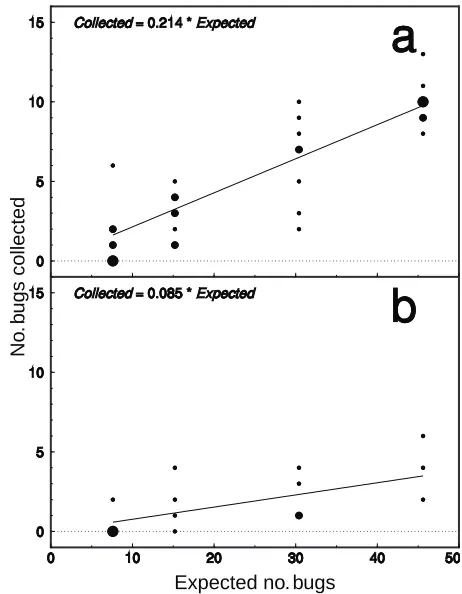
except 1, 8, 16, and 30 July. This group contained only two sample dates on which plant heights were > 50 cm (Table 1). Analysis of this group of sample dates indicated a common-slope model adequately described the pooled data (F = 0.12; df = 7, 48; P = 0.996). The resulting regression equation (intercept ± SE, -0.195 ± 0.361; slope ± SE, 0.226 ± 0.025; F = 80.59; df = 1, 62; P < 0.001) explained 56.5% of the variability in the data. Because the intercept was not different from zero (t = -0.54, df = 1, P = 0.591), a
no-intercept model was fitted that indicated a sweep net collection efficiency of 21.4% (Fig. 1).
Comparisons of the slopes corresponding to sample dates with generally larger plants also indi-cated a common slope was appropriate (F = 0.49; df = 3, 24; P = 0.690). The pooled data yielded a
significant regression (intercept ± SE, 0.165 ± 0.341;
slope ± SE, 0.067 ± 0.023; F = 8.16; df = 1, 30; P = 0.008), but the model only explained 21.4% of the variation in the data. The corresponding no-intercept
model indicated a sweep net collection efficiency of
only 7.7% (Fig. 1).
Table 2. Linear regression parameters relating number of released adult Lygus hesperus recovered in 10-sweep samples to expected number based on 100% sweep net collection efficiency in cotton
Sample date Intercept (±SE) P Slope (±SE) P R²
10 June -0.076 (1.027) 0.943 0.198 (0.072) 0.032 0.562
20 June 0.441 (0.960) 0.662 0.227 (0.067) 0.014 0.658
24 June -1.000 (0.695) 0.200 0.263 (0.048) 0.002 0.831
27 June 0.924 (1.421) 0.540 0.198 (0.099) 0.092 0.401
1 July 0.898 (0.730) 0.264 0.089 (0.051) 0.130 0.339
3 July -0.780 (0.796) 0.365 0.245 (0.055) 0.004 0.765
8 July -0.262 (0.202) 0.242 0.049 (0.013) 0.010 0.700
11 July -0.492 (0.790) 0.557 0.212 (0.055) 0.008 0.712
16 July -0.059 (0.748) 0.939 0.096 (0.052) 0.116 0.360
23 July 0.110 (1.500) 0.944 0.254 (0.105) 0.051 0.496
30 July -0.051 (0.305) 0.873 0.045 (0.021) 0.080 0.424
Analyses of data where duplicate 10-sweep samples within a date were pooled (20-sweep samples; omitting data for unpaired population levels of 60 and 72 bugs/row on 8 July) resulted in the same groupings of pooled regressions as the 10-sweep samples. The regression model for the
first group, representing sample dates with gener -ally smaller plants (intercept ± SE, -0.390 ± 0.681; slope ± SE, 0.226 ± 0.024; F = 90.37; df = 1, 30; P < 0.001), explained 75.1% of the variation in the data. The corresponding no-intercept model indicated a
sweep net collection efficiency of 21.4% (Fig. 2).
The model for the second group of dates, on which plants were generally larger (intercept ± SE, 0.073 ± 0.734; slope ± SE, 0.083 ± 0.027; F = 9.37; df = 1, 13; P = 0.009), only explained 41.9% of the
ob-served variation. Based on the no-intercept model,
collection efficiency of the sweep net in the larger
plants was 8.5% (Fig. 2). Thus, fit of both models
was improved by increasing the size of the sample
unit. This improvement in model fit was caused by
the data smoothing effect of the larger sample unit, and a reduction in the frequency of zero counts.
Regardless, fit of the model in the generally larger plants, and associated collection efficiency of the
sweep net, were much poorer than for smaller, less developed plants.
Previous investigations do not directly report
estimates of collection efficiency by the sweep net,
but several studies provide information relating Lygus population estimates obtained by sweeping to those from absolute samples. Based on samples composed of 50 sweeps across a single row, Byerly et al. (1978) reported the sweep net underestimated population levels of adult Lygus hesperus in cot-ton by a factor of 3.65. Although this estimate Expected no. bugs
No
. b
ugs collected
Expected no. bugs
No
. b
ugs collected
Figure 1. No-intercept regressions of numbers of marked and released L. hesperus adults recovered by 10-sweep samples from cotton versus expected numbers assuming 100% sweep net collection efficiency: a) sample dates (10, 20, 24, 27 June, 3, 11, 23 July, 6 August) correspond to those with generally smaller plant heights (mean height 22.8 to 52.8 cm); b) sample dates (1, 8, 16, 30 July) cor-respond to those with generally greater plant heights (mean height 52.2 to 67.5 cm). Sizes of plotted circles are proportional to the number of data points.
would correspond to a collection efficiency of
about 27%, their study used a larger (40.6-cm diameter) net to sample a wider range of cotton growth stages compared with the study reported here. Ellington et al. (1984) found no relationship between numbers of adult Lygus spp. collected in 50-sweep samples across two rows and estimates provided by a clam shell device in late-season cotton. However, a regression relating pooled 50-sweep samples (resulting in 250-sweep samples) to absolute estimates resulted in a slope of 2.867
(approximately 35% collection efficiency). Snod -grass and Scott (1997) used both 5- and 10-sweep samples in early- to mid-season cotton, with each sweep passing upward through the plant terminal. They reported the sweep net collected about 1/3 of Lygus lineolaris indicated by plant inspections, but regressions corresponding to the weeks of sampling
indicated a range of collections efficiencies from
17% to 39%, with an overall average of 24.5%. Zink and Rosenheim (2004) used 50-sweep samples in cotton with 15 to 20 mainstem nodes, with each sweep being one pass of the net across a row. They reported that each L. hesperus adult collected in a sweep net sample corresponded to one adult per 3 m of row based on counts from caged plants. This relationship approximates a sweep net collection
efficiency of 16%. Although most of the estimates of sweep net collection efficiency observed in the
current study are within the range of previously reported estimates, differences among studies in the size and development of sampled plants as well as differences in the sweeping technique prevent meaningful comparisons.
Although evaluation of the influences of cotton
plant height or canopy development on collection
efficiency of the sweep net was not an objective of the study, observations strongly suggest an influ -ence of plant phenology on sampling for L. hespe-rus adults. However, the overlap in plant heights between the two sets of regression equations with common slopes clearly indicates that plant height alone is not an adequate descriptor. Phytogen 800 is
a Pima variety that branches prolifically under the
observed growing conditions. If L. hesperus adults utilized terminals of both mainstems and fruiting branches, it is possible that the extent of branch de-velopment, types and sizes of fruit on the branches, or proximity of branch and mainstem terminals
may be important factors influencing the sweep net collection efficiency. In addition, the extent
of branch development (especially branch length)
influences canopy width, and a well-developed
plant canopy offers more surface area as well as more resistance to the passage of the net than does a less developed canopy. Additional investigations are required to determine which plant parameters
are most relevant to efforts to refine estimates of sweep net collection efficiency.
The results reported herein illustrate the utility of a mark-release-recapture approach to evaluating sampling methods for lygus adults. Key to this ap-proach is the assumption that released bugs remain in the desired row sections, and that marked bugs display behaviors and within-plant distribution pat-terns similar to those of bugs naturally infesting cot-ton. Counts of bugs from the recovery frames suggest a large proportion of bugs released in the evening were available for sampling on the following morn-ing. Although the loss of some bugs was certain, this source of sampling error was likely small compared to the error commonly associated with population estimates by absolute methods. This would be par-ticularly true when naturally occurring population levels are low, and numbers of absolute samples are limited by available labor or time. Although it was not possible to ascertain whether the behaviors of colony-reared bugs were similar to those of bugs
occurring naturally in the field, results obtained
with wild bugs collected from alfalfa (30 July and 6 August) were not inconsistent with results using colony-reared L. hesperus adults. These observations suggest a mark-release-recapture approach can be extended to provide more reasonable estimates of sampling precision than are possible using naturally occurring populations. These methods should also have utility in unambiguously quantifying a variety
of potential influences on sample methods such as
plant size and structure, time of day effects, and differences among samplers.
DISCLAIMER:
REFERENCES
Byerly, K.F., A.P. Guiterrez, R.E. Jones, and R.F. luck. 1978. A comparison of sampling methods for some arthropod
populations in cotton. Hilgardia 46:257–282.
Ellington, J., K. Kiser, G. Ferguson, and M. Cardenas. 1984. A comparison of sweep net, absolute, and insectavac
sampling methods in cotton ecosystems. J. Econ. Ento-mol. 77:599–605.
Fleischer, S.J., M.J. Gaylor, and J.V. Edelson. 1985. Estimat-ing absolute density from relative samplEstimat-ing of Lygus lineolaris (Heteroptera: Miridae) and selected preda-tors in early to mid-season cotton. Environ. Entomol. 14:709–717.
Gore, J., and A. Catchot. 2005. Tarnished plant bug sampling and management in the Mississippi Delta. p. 1234–1238.
In Proc. Beltwide Cotton Conf., New orleans, lA. 4–7 Jan. 2005. Natl. Cotton Counc. Am., Memphis, TN.
Kuno, E. 1991. Sampling and analysis of insect populations. Annu. Rev. Entomol. 36:285–304.
littell, R.C., W.W. Stroup and R.J. Freund. 2002. SAS for linear Models. 4th ed. SAS Institute, Cary, NC.
Montgomery, D.C. and E.A. Peck. 1982. Introduction to linear Regression Analysis. Wiley, New York.
Morris, R.F. 1960. Sampling insect populations. Annu. Rev. Entomol. 5:243–264.
Musser, F., S. Stewart, R. Bagwell, G. lorenz, A. Catchot, E. Burris, D. Cook, J. Robbins, J. Greene, G. Studebaker, and J. Gore. 2007. Comparison of direct and indirect sampling methods for tarnished plant bug
(Hemip-tera: Miridae) in flowering cotton. J. Econ. Entomol.
100:1916–1923.
Raulston, J.R., D.W. Spurgeon, and A.N. Sparks, Jr. 1998.
Influence of fruit on sampling and control of adult boll
weevils in cotton. Southwest. Entomol. 23:1–10.
Sevacherian, V., and V.M. Stern. 1972. Spatial distribution
patterns of lygus bugs in California cotton fields. Envi -ron. Entomol. 1:695–704.
Sharp, J.W., and R.D. Bagwell. 2006. Evaluation of multiple
bug sampling techniques for effectiveness and effi -ciency. p. 954–956. In Proc. Beltwide Cotton Conf., San Antonio, TX. 3-6 Jan. 2006. Natl. Cotton Counc. Am.,
Memphis, TN.
Snodgrass, G.l., and W.P. Scott. 1997. A conversion factor for correcting numbers of adult tarnished plant bugs (Heteroptera: Miridae) captured with a sweep net in cot-ton. Southwest. Entomol. 22: 189–193.
Sokal, R.R., and F.J. Rohlf. 1987. Introduction to Biostatistics. 2nd ed. W. H. Freeman, New York.
Southwood, T.R.E. 1978. Ecological Methods with Particular Reference to the Study of Insect Populations. 2nd ed.
Chapman and Hall, New York.
Spurgeon, D.W., and A.J. Mueller. 1991. Sampling methods and spatial distribution patterns for threecornered alfalfa hopper nymphs (Homoptera: Membracidae) on soybean. J. Econ. Entomol. 84:1108–1116.
Stewart, S.D., G. Studebaker, G.M. lorenz, F. Musser, A. Catchot, J. Greene, and R.D. Bagwell. 2006. Update on regional tarnished plant bug sampling in the Mid-South. p. 1591–1596. In Proc. Beltwide Cotton Conf., San Antonio, TX. 3–6 Jan. 2006. Natl. Cotton Counc. Am., Memphis, TN.
Strickland, A.H. 1961. Sampling crop pests and their hosts. Annu. Rev. Entomol. 6: 201–220.
Willers, J.l., M.R. Seal, and R.G. luttrell. 1999. Remote sensing, line-intercept sampling for tarnished plant bugs (Heteroptera: Miridae) in mid-south cotton. J. Cotton Sci. 3:160–170.
Wilson, l.T., T.F. leigh, D. Gonzalez, and C. Foristiere. 1984. Distribution of Lygus hesperus (Knight) (Miridae: He-miptera) on cotton. J. Econ. Entomol. 77:1313–1319.
Zar, J.H. 1984. Biostatistical Analysis. 2nd ed. Prentice-Hall,
Englewood Cliffs, NJ.