DEMOGRAPHIC RESEARCH
VOLUME 32, ARTICLE 37, PAGES 1049
−
1064
PUBLISHED 21 MAY 2015
http://www.demographic-research.org/Volumes/Vol32/37/ DOI: 10.4054/DemRes.2015.32.37
Descriptive Finding
Demographic characteristics of Sardinian
centenarian genealogies: Preliminary results of
the AKeA2 study
Rosa Maria Lipsi
Lucia Pozzi
Ciriaco Carru
James W. Vaupel
Graziella Caselli
Giovannella Baggio
Claudio Franceschi
Luca Deiana
1 Introduction 1050
2 Overview of the AKeA2 study: Sample selection and data
collection plan
1050
3 Validation procedure 1054
4 Completeness of the information 1054
5 Some preliminary results 1056
6 Conclusion 1059
7 Acknowledgments 1060
Demographic characteristics of Sardinian centenarian genealogies:
Preliminary results of the AKeA2 study
Rosa Maria Lipsi1 Graziella Caselli2
Lucia Pozzi3 Giovannella Baggio4
Ciriaco Carru5 Claudio Franceschi6
James W. Vaupel7 Luca Deiana8
Abstract
OBJECTIVE
This article provides an overview of the AKeA2 study, with a particular focus on data collection concerning family genealogies of the Sardinian centenarians and controls, and on the quality of these data. A first analysis of the main characteristics of the survey data is also summarized and selected preliminary results are presented.
METHODS
We use descriptive statistics to analyze data collected by the AKeA2 survey on Sardinian centenarians and controls.
RESULTS
Centenarian women have on average fewer children, and at an older age, particularly for their last child. The mothers of centenarians, especially centenarian women, lived longer on average than those of deceased controls and controls born between 1905 and 1910 but still living at the moment of the survey.
1 Italian National Institute of Statistics (ISTAT), Italy. E-Mail: [email protected]. The views and opinions
expressed in this article are those of the author and do not necessarily reflect those of the Italian National Institute of Statistics (ISTAT).
2
Sapienza University of Rome, Italy. E-Mail: [email protected].
1. Introduction
In Sardinia, male death rates after age 80 are only modestly higher than female death rates, and are lower than female levels in some municipalities. The remarkably low mortality after age 80 has thus yielded a surprisingly large number of centenarian men compared with centenarian women (Robine and Caselli 2005). An area with a large number of centenarians has been identified in the Sardinian province of Nuoro (Deiana et al. 1999; Poulain et al. 2004), as well as a longevity area for men. This latter area comprises municipalities in Oristano as well as Nuoro where the standardized death rate across old ages for men is less than 10% higher than for women, whereas elsewhere in the two provinces the standardized male death rate is more than 30% higher (Caselli and Lipsi 2006). The higher number of centenarians and their more balanced sex ratio have led to considerable interest among demographers, geneticists, gerontologists, and clinicians specializing in genetic mapping (DNA) (Caselli, Robine, and Rasulo 2003).
The bio-medical characteristics of Sardinian centenarians was investigated by Luca Deiana and Giovannella Baggio (Deiana et al. 1999) in the AKeA study, an acronym derived from an expression in the Sardinian dialect that means “may you live to 100.” A second, larger and cross-disciplinary study, called AKeA2, was launched in 2003, which involved demographers, historians, biologists, geneticists, and gerontologists. The demographic survey was directed by James Vaupel.
This article gives a short description of the AKeA2 demographic survey and of the data collection, and provides a preliminary analysis of the data.
2. Overview of the AKeA2 study: Sample selection and data
collection plan
The data collection was time-consuming. Over a six-year period various types of information were gathered: individual demographic characteristics, data on survival rates, and archival data regarding family characteristics and early-life events.
As concerns the living controls, the plan was to identify three younger controls for each centenarian by finding people born around 1907, 1912, and 1922. We also identified, for each centenarian, two deceased controls that were born, as mentioned before, the same year (and around the same day and month) and in the same municipality as the centenarian and to find one who died in his or her late 60s and one who died in his or her late 70s.
In choosing both controls it was required that the family names of their mothers and fathers had to be different from the family names of the centenarian’s parents. Controls with a familial relationship with centenarians were excluded from the sample, to avoid possible excessive consanguinity. Satisfying all these requirements was not always possible, but as shown in Table 1 we succeeded in locating appropriate controls for most of the centenarians.
We succeeded in collecting information on 204 centenarians, 98 males and 106 females. These people were born between 1890 and 1904, in 126 municipalities (Figure 1) throughout the island (out of the 377 Sardinian municipalities). Table 1 shows 54 out of 98 centenarian men were from the provinces of Nuoro and Oristano, the provinces that included the longevity areas with exceptionally low male mortality.
Regarding the living controls, in small municipalities individuals born in 1907, 1912, and 1922 could not always be located. Hence, individuals from adjacent cohorts were identified, specifically born between 1905 and 1910, 1911 and 1917, and 1918 and 1923.
Prior to being interviewed, the centenarian’s willingness to be visited was established by first contacting their general practitioner and/or family, who were asked to participate in the survey. If they refused the centenarian was replaced with a similar substitute, where possible.
Table 1: Individuals in the survey by birth cohort, sex, province, and region
Year of Birth
Men Women M+W
Cagliari Nuoro Oristano Sassari Sardinia Cagliari Nuoro Oristano Sassari Sardinia Sardinia
M W
Centenarians
1890-1892 0 1 0 0 1 0 0 0 0 0 1 1893-1895 0 1 0 0 1 0 2 0 0 2 3 1896-1899 1 6 0 4 11 1 7 2 4 14 25
1900 2 2 0 0 4 1 4 2 5 12 16
1901 1 3 1 2 7 1 11 5 16 33 40 1902 7 10 3 10 30 4 9 6 12 31 61 1903 4 11 5 3 23 1 5 3 5 14 37
1904 5 9 2 5 21 0 0 0 0 0 21
Total 20 43 11 24 98 8 38 18 42 106 204
Living controls
1905-1910 15 38 8 20 81 7 35 16 37 95 176 1911-1917 20 43 10 24 97 8 38 18 42 106 203 1918-1923 20 43 11 23 97 8 38 18 41 105 202 Total 55 124 29 67 275 23 111 52 120 306 581
Deceased controls aged 60-69 years
1890-1892 0 1 0 0 1 0 0 0 0 0 1 1893-1895 0 1 0 0 1 0 2 0 0 2 3 1896-1899 1 6 0 3 10 1 5 1 3 10 20
1900 1 2 0 0 3 1 3 0 4 8 11
1901 0 3 1 2 6 1 10 5 13 29 35 1902 7 8 2 8 25 3 9 4 10 26 51 1903 3 11 3 3 20 0 5 3 3 11 31
1904 2 9 2 5 18 0 0 0 0 0 18
Total 14 41 8 21 84 6 34 13 33 86 170
Deceased controls aged 70-79 years
1893-1895 0 1 0 0 1 0 2 0 0 2 3 1896-1899 1 6 0 3 10 1 6 1 4 12 22
1900 2 2 0 0 4 1 3 2 5 11 15
1901 1 3 1 2 7 1 11 4 12 28 35 1902 6 10 3 10 29 4 8 6 11 29 58 1903 4 11 4 4 23 1 5 4 4 14 37
1904 5 8 2 5 20 0 0 0 0 0 20
Total 19 41 10 24 94 8 35 17 36 96 190
3. Validation procedure
Sardinian municipalities, as elsewhere throughout Italy, have two types of population register. One collects civil records, recording births, deaths, and marriages that occur in the municipality in question. Sardinian civil records have beencollected since 1866. The second – the Anagrafe – records residence and change of residence as well as residents’ births, deaths, and marriages.
To validate ages in our study, the following documents were examined: birth certificate, marriage certificate(s), the birth, marriage, and death certificates of parents, the birth certificates of all children of the individual in question, and the birth certificates of the individual’s siblings. Complete validation is achieved only when the data is cross-checked and proves to be consistent.
Firstly, the consistency of the data was checked by verifying that birth and death registers were in agreement if the individual had died, or that the birth register and the
Anagrafe were in agreement if he or she was living (date and place of birth, names given to the new-born, names of parents, age of father if given).
Secondly, we checked the coherence between names given in the various records. Then we verified the consistency of the marriage register regarding parents’ marriage (name of spouses, date and place of marriage, ages), checking the plausibility of the age at marriage of both spouses. Next we checked the plausibility of all between-birth intervals for the individual and siblings, taking into account those who died in their first year of life. A repetition of the name given to siblings often can be explained by the death of a former sibling; this must be considered for age validation.
The validation process was quite lengthy. Over two and a half years passed between the date of interview and the time it took to collect all the data for both centenarians and controls. During this period a number of deaths occurred and were duly entered in the death register.
4. Completeness of the information
By applying the validation procedure to demographic data from 1866, genealogies were reconstructed for 1,145 individuals. Specifically, for each individual we have reconstructed his/her life history as well as the biographies of his/her ancestors and descendants. These were then uploaded using “Heredis 8” (2007) (a software for reconstructing genealogies), to compile a database of 21,788 individuals, including the ascendants, siblings, and descendants of the sampled subjects.
deceased); data on second marriages; the number and sex of their children. Widow status is also recorded, but is missing for 18% of men and 23% of centenarian women (Table 2).
Information on the parentsconcerning date and place of birth is available for all sampled individuals. Other information is available for many of them, such as date of death(92% of centenarians), marriage (from 94 to 98%), and fertility (from 94 to 99%).
Table 2: Synthesis of some demographic characteristics concerning centenarians and controls. Values per 100
Demographic characteristics
Individuals in the survey
Centenarians Living controls Deceased controls Total Individuals 1905 – 1910 1911 – 1917 1918 – 1923 Aged 60–69 years Aged 70–79 years Men
Number of individuals 98 81 97 97 84 94 551
Deceased at the moment of the civil register checks 48.0 30.9 16.5 8.2 100.0 100.0 49.7 Place of death different from place of birth 19.1 32.0 12.5 75.0 4.8 4.3 12 No information on vital status 6.1 2.5 2.1 2.1 0 0 2.2 Emigrated at the moment of the demographic checks 4.1 1.2 1.0 0 0 0 1.1 Never married (1) 8.2 7.4 4.1 12.4 13.1 3.2 8.0 Second marriages 8.9 5.3 6.5 0 6.8 9.9 6.3 Married at the moment of the civil register checks 7.8 33.3 45.2 80.0 78.1 58.2 49.7 Widows at the moment of the civil register checks 74.4 62.7 50.5 11.8 17.8 41.8 43.8 No information on civil status at the moment of the civil
register checks
17.8 4.0 4.3 8.2 4.1 0 6.5
Women
Number of individuals 106 95 106 105 86 96 594
Deceased at the moment of the civil register checks 54.7 33.7 20.8 6.7 100.0 100.0 50.7 Place of death different from place of birth 27.6 15.6 9.1 28.6 1.2 4.2 10.0 No information on vital status 5.7 2.1 5.7 1.0 0 0 5.7 Emigrated at the moment of the demographic checks 4.7 1.1 2.8 1.9 0 1.0 2.0 Never married (1) 19.8 26.3 11.3 20.0 22.1 20.8 19.9 Second marriages 2.4 2.9 3.2 3.6 1.5 2.6 2.7 Married at the moment of the civil register checks 0 2.9 6.4 25 58.2 21.1 17.6 Widows at the moment of the civil register checks 76.5 87.1 85.1 72.6 38.8 72.4 73.1 No information on civil status at the moment of the civil
register checks
23.5 10.0 8.5 2.4 3.0 6.6 9.2
5. Some preliminary results
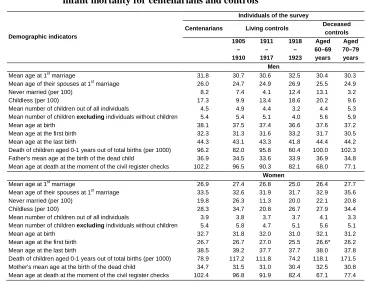
A first result regards the average age at death: for centenarians it was 102.4 years and 102.2 respectively for women and men (Table 3). Differences between the sexes also emerged for controls for the 1905–1910 and 1911–1917 cohorts, where the mean age at death was 96.8 and 91.9 for women and 96.5 and 90.3 for men, respectively. Surprisingly, for deceased controls who died in their late 60s, the mean age at death was significantly lower for women (67.1 years) than for men (68.0 years).
Only 16 participants (6 men and 10 women) changed their residence, but any migration that took place was limited to within the island.
Regarding fertility, especially for the mean number of children per woman, there are significant differences between centenarians and their deceased control and living controls for the 1905–1910 cohorts. Table 3 shows that centenarian women (excluding childless women - we restricted the analysis to women that had experienced a ‘birth event’) had an average of 5.4 children compared with 5.6 children for women in the same cohorts deceased at ages 60–69 and 5.8 children for women in the 1905–1910 cohorts. No comparison can be made with younger cohorts, that is to say, women in the 1918–1923 cohort. The reproductive age of these cohorts mostly coincides with the second demographic transition in Italy when there was a fertility decline, so that they experienced the first major drop in fertility.
Table 3: Some demographic indicators concerning civil status, fertility, and infant mortality for centenarians and controls
Demographic indicators
Individuals of the survey
Centenarians Living controls Deceased
controls 1905 – 1910 1911 – 1917 1918 – 1923 Aged 60–69 years Aged 70–79 years Men
Mean age at 1st
marriage 31.8 30.7 30.6 32.5 30.4 30.3 Mean age of their spouses at 1st
marriage 26.0 24.7 24.9 26.9 25.5 24.9 Never married (per 100) 8.2 7.4 4.1 12.4 13.1 3.2 Childless (per 100) 17.3 9.9 13.4 18.6 20.2 9.6 Mean number of children out of all individuals 4.5 4.9 4.4 3.2 4.4 5.3 Mean number of children excluding individuals without children 5.4 5.4 5.1 4.0 5.6 5.9 Mean age at birth 38.1 37.5 37.4 36.6 37.6 37.2 Mean age at the first birth 32.3 31.3 31.6 33.2 31.7 30.5 Mean age at the last birth 44.3 43.1 43.3 41.8 44.4 44.2 Death of children aged 0-1 years out of total births (per 1000) 96.2 82.0 95.8 60.4 100.0 102.3 Father's mean age at the birth of the dead child 36.9 34.5 33.6 33.9 36.9 34.8 Mean age at death at the moment of the civil register checks 102.2 96.5 90.3 82.1 68.0 77.1
Women
Mean age at 1st
marriage 26.9 27.4 26.8 25.0 26.4 27.7 Mean age of their spouses at 1st
marriage 33.5 32.6 31.9 31.7 32.9 35.6 Never married (per 100) 19.8 26.3 11.3 20.0 22.1 20.8 Childless (per 100) 28.3 34.7 20.8 26.7 27.9 34.4 Mean number of children out of all individuals 3.9 3.8 3.7 3.7 4.1 3.3 Mean number of children excluding individuals without children 5.4 5.8 4.7 5.1 5.6 5.1 Mean age at birth 32.7 31.8 32.0 31.0 32.1 31.2 Mean age at the first birth 26.7 26.7 27.0 25.5 26.6* 26.2 Mean age at the last birth 38.5 39.2 37.7 37.7 38.0 37.8 Death of children aged 0-1 years out of total births (per 1000) 78.9 117.2 111.8 74.2 118.1 171.5 Mother's mean age at the birth of the dead child 34.7 31.5 31.0 30.4 32.5 30.8 Mean age at death at the moment of the civil register checks 102.4 96.8 91.9 82.4 67.1 77.4
The differences between centenarians and controls are significant at a level of α<0.05 (Student's t-test) * The difference with centenarians is not significant
Table 4: Some demographic indicators concerning fertility and mortality of the parents of centenarians and controls
Demographic indicators
Individuals of the survey
Centenarians Living controls Deceased controls
1905 – 1910 1911 – 1917 1918 – 1923 Aged 60–69 years Aged 70–79 years Men
Mean number of children for mother 6.3 6.6 6.2 6.4 6.2 5.9 Mean number of children for father 6.1 6.7 6.4 6.5 6.3 5.9 Mother's mean age at birth for each of these
individuals
30.1 31.2 31.3 31.6 30.7 31.0
Father's mean age at birth for each of these individuals
36.7 38.6 38.9 38.8 36.6 38.4
Birth order of each individual of the survey 3.1 3.4 3.8 3.2 3.4 3.2 Mother's mean age at death 71.3 71.4 71.1 76.9 71.2 70.0 Father's mean age at death 70.1 74.5 75.0 77.2 70.7 69.9
Women
Mean number of children for mother 6.9 6.9 6.7 6.2 6.3 6.6 Mean number of children for father 6.8 6.9 6.7 6.2 6.3 6.6 Mother's mean age at birth for each of these
individuals
30.6 30.9 31.7 30.4 32 31.7
Father's mean age at birth for each of these individuals
37.5 37.5 37.8 36.5 39.4 38.0
Birth order of each individual of the survey 3.8 3.6 3.7 2.9 3.8 3.7 Mother's mean age at death 74.1 70.9 74.3 77.9 68.7 70.6 Father's mean age at death 71.3 73.5 71.8 75.3 68.3 72.2
The differences between centenarians and controls are significant at a level of α<0.05 (Student's t-test)
Birth order for centenarian men and women is also of some interest, both in the light of the existing literature (Doblhammer 2000; Voland and Engel 1986; Westendorp and Kirkwood 1998) and, above all, in relation to the results obtained in other studies on late reproduction, parity, and longevity in Sardinian women (Astolfi et al. 2009). On average the birth order is 3.1 for men and 3.8 for women (Table 4). For centenarian men the birth order is lower compared with their deceased controls, particularly for those who died in their 60s.
The most interesting result of this brief overview of our preliminary analysis concerns the significantly lower number of deaths in the first year of life among the children of the people who survived to become centenarians: see Table 3. Ninety-six out of 1,000 infants of fathers who became centenarians died, and for mothers the figure is 79 per 1,000. By contrast, the death rates of the infant children of the controls who died in their 60s or 70s were 100−102 and 118−172 per thousand, for fathers and mothers respectively. The mothers who became centenarians also suffered lower death rates among their infant children than women born in later cohorts, even though infant mortality was lower in these later cohorts. The people in the 1918–1925 cohorts are less selected because the infant mortality had begun to decline in the depths of the demographic transition when there was a fertility decline.
In Sardinia as a whole, infant mortality in the period 1925–30, which roughly coincides with the mean age when centenarians had their children, was 100-105 per thousand (Gatti 2002; Breschi and Fornasin 2008).
6. Conclusions
The wealth of information gathered in the AKeA2 survey can be used to study various hypotheses about longevity.
parents at the time of their own procreation. The centenarians appear to take advantage of several factors related to the timing of fertility that the literature suggests may foster longevity.
7. Acknowledgments
The authors would like to thank anonymous reviewers and the Associate Editor for their helpful comments and suggestions. Moreover we are very grateful to Iris Levitis for her careful and meticulous assistance with English language editing.
The AKeA2 demographic survey of Sardinian Centenarians, directed by W. James Vaupel, Max Planck Institute for Demographic Research, Rostock, Germany (financed by the U.S. National Institute on Aging (NIA), subcontract with Duke University n.03-SC-NIH-1027).
Corrections:
References
Astolfi, P., Caselli, G., Fiorani, O., Lipsi, R.M., Lisa, A., and Tentoni, S. (2009). Late reproduction behaviour in Sardinia: spatial analysis suggests local aptitude towards reproductive longevity. Evolution and Human Behaviour 30(2): 93–102.
doi:10.1016/j.evolhumbehav.2008.09.001.
Breschi, M. and Fornasin, A. (2008). La mortalità per genere nei primi cinque anni di vita. Italia 1864–1959. In: Breschi, M. and Pozzi, L. (Eds). Salute, malattia e sopravvivenza in Italia fra ‘800 e ‘900. Udine:Forum: 243–272. doi:10.1400/ 119206.
Capri, M., Salvioli, S., Monti, D., Caruso, C., Candore, G., Vasto, S., Olivieri, F., Marchegiani, F., Sansoni, P., Baggio, G., Mari, D., Passarino, G., De Benedictis, G., and Franceschi, C. (2008). Human longevity within an evolutionary perspective: the peculiar paradigm of a post-reproductive genetics. Experimental Gerontology 43(2): 53–60. doi:10.1016/j.exger.2007.06.004.
Caselli, G. and Lipsi, R.M. (2006). Survival differences among the oldest old in Sardinia: who, what, where, and why? Demographic Research 14(13): 267–294.
doi:10.4054/DemRes.2006.14.13.
Caselli, G., Robine, J.M., and Rasulo, D. (2003). Variations regionales du rapport de féminité en Italie. In: Vallin, J. (Ed). Du genere et de l’Afrique, Omage à Thérèse Lococh. Paris: INED.
Deiana, L., Ferrucci, L., Pes, G.M., Carru, C., Delitala, C., Ganau, A., Mariotti, S., Nieddu, A., Pettinato, S., Putzu, P., Franceschi, C., and Baggio, G. (1999). AKEntAnnos. The Sardinia Study of extreme longevity. Aging, Clinical and Experimental Research 11(3): 142–149.
Di Bona, D., Vasto, S., Capurso, C., Christiansen, L., Deiana, L., Franceschi, C., Hurme, M., Mocchegiani, E., Rea, M., Lio, D., Candore, G., and Caruso, C. (2009). Effect of interleukin-6 polymorphisms on human longevity: a systematic review and meta-analysis. Ageing Research Reviews 8(1): 36–42. doi:10.1016/ j.arr.2008.09.001.
Doblhammer, G. and Oeppen, J. (2003). Reproduction and longevity among the British Peerage: the effect of frailty and health selection. Proc Biol Sci. 270(1524): 1541–1547. doi:10.1098/rspb.2003.2400.
Doblhammer, G. and Vaupel, J.W. (2001). Lifespan Depends on Month of Birth.
Proceedings of the National Academy of Sciences 98(5): 2934–2939.
doi:10.1073/pnas.041431898.
Gatti, A.M. (2002). La mortalità infantile tra Ottocento e Novecento. La Sardegna nel panorama italiano. Cagliari, Italia: Università degli Studi di Cagliari.
Gavrilov, L.A. and Gavrilova, N.S. (1999). Season of Birth and Human Longevity.
Journal of Anti-Aging Medicine 2(4): 365–366. doi:10.1089/rej.1.1999.2.365. Gravina, S., Lescai, F., Hurteau, G., Brock, G.J., Saramaki, A., Salvioli, S., Franceschi,
C., and Roninson, I.B. (2009). Identification of single nucleotide polymorphisms in the p21 (CDKN1A) gene and correlations with longevity in the Italian population. Aging (Albany NY) 1(5): 470–480.
Heredis (2007). La généalogie, pour la vie! Montpellier, France: Heredis/BSD Concept.
www.heredis.com.
Invidia, L., Salvioli, S., Altilia, S., Pierini, M., Panourgia, M.P., Monti, D., De Rango, F., Passarino, G., and Franceschi C. (2010). The frequency of Klotho KL-VS polymorphism in a large Italian population, from young subjects to centenarians, suggests the presence of specific time windows for its effect. Biogerontology
11(1): 67–73. doi:10.1007/s10522-009-9229-z.
Larke, A. and Crews, D.E. (2006). Parental investment, late reproduction, and increased reserve capacity are associated with longevity in humans. Journal of Physiological Anthropology 25(1): 119–131. doi:10.2114/jpa2.25.119.
Lescai, F., Blanché, H., Nebel, A., Beekman, M., Sahbatou, M., Flachsbart, F., Slagboom, E., Schreiber, S., Sorbi, S., Passarino, G., and Franceschi, C. (2009). Human longevity and 11p15.5: a study in 1321 centenarians. European Journal of Human Genetics 17(11): 1515–1519. doi:10.1038/ejhg.2009.54.
Lescai, F., Marchegiani, F., and Franceschi, C. (2009). PON1 is a longevity gene: results of a meta-analysis. Ageing Research Reviews 8(4): 277–284.
doi:10.1016/j.arr.2009.04.001.
McArdle, P.F., Pollin, T.I., O'Connell, J.R., Sorkin, J.D., Agarwala, R., Schäffer, A.A., Streeten, E.A., King, T.M., Shuldiner, A.R., and Mitchell, B.D. (2006). Does having children extend life span? A genealogical study of parity and longevity in the Amish. The Journals of Gerontology Series A: Biological Sciences and Medical Sciences 61(2): 190–195. doi:10.1093/gerona/61.2.190.
Müller, H-G., Chiou, J-M., Carey, J.R., and Wang, J.L. (2002). Fertility and life span: late children enhance female longevity. The Journals of Gerontology Series A: Biological Sciences and Medical Sciences 57(5): 202–206. doi:10.1093/gerona/ 57.5.B202.
Perls, T., Albert, L., and Fretts, R.C. (1997). Middle-age mothers live longer. Nature
389(6647): 133. doi:10.1038/38148.
Poulain, M., Pes, G.M., Grasland, C., Carru, C., Ferrucci, L., Baggio, G., Franceschi, C., and Deiana, L. (2004). Identification of a geographic area characterized by extreme longevity in the Sardinia island: the AKeA study. Experimental Gerontology 39(9): 1423–1429. doi:10.1016/j.exger.2004.06.016.
Raule, N., Sevini, F., Santoro, A., Altilia, S., and Franceschi, C. (2007). Association studies on human mitochondrial DNA: methodological aspects and results in the most common age-related diseases. Mitochondrion 7(1−2): 29–38. doi:10.1016/ j.mito.2006.11.013.
Robine J-M. and Caselli G. (2005). An unprecedented increase in the number of centenarians. Genus 61(1): 57–82.
Rose, G., Passarino, G., Scornaienchi, V., Romeo, G., Dato, S., Bellizzi, D., Mari, V., Feraco, E., Maletta, R., Bruni, A., Franceschi, C., and De Benedictis, G. (2007). The mitochondrial DNA control region shows genetically correlated levels of heteroplasmy in leukocytes of centenarians and their offspring. BMC Genomics
8(1): 293. doi:10.1186/1471-2164-8-293.
Rose, G., Romeo, G., Dato, S., Crocco, P., Bruni, AC., Hervonen, A., Majamaa, K., Sevini, F., Franceschi, C., and Passarino, G. (2010). Genetics of Healthy Ageing Project Consortium. Somatic point mutations in mtDNA control region are influenced by genetic background and associated with healthy aging: a GEHA study. PLoS One 5(10): e13395. doi:10.1371/journal.pone.0013395.
advantages and perspectives. Free Radical Research 40(12): 1303–1323.
doi:10.1080/10715760600917136.
Santoro, A., Salvioli, S., Raule, N., Capri, M, Sevini, F., Valensin, S., Monti, D., Bellizzi, D., Passarino, G., Rose, G., De Benedictis, G., and Franceschi, C. (2006). Mitochondrial DNA involvement in human longevity. Biochimica et Biophysica Acta (BBA) – Bioenergetics 1757(9–10): 1388–1399. doi:10.1016/ j.bbabio.2006.05.040.
Tentoni, S., Lisa, A., Fiorani, O., Lipsi, R.M., Caselli, G., and Astolfi, P. (2012). Spatial Analysis of the aptitude to late maternity on the Island of Sardinia. Journal of Biosocial Sciences 44(3): 257–272. doi:10.1017/S0021932011000575.
Testa, R., Bonfigli, A.R., Salvioli, S., Invidia, L., Pierini, M., Sirolla, C., Marra, M., Testa, I., Fazioli, F., Recchioni, R., Marcheselli, F., Olivieri, F., Lanari, L., and Franceschi, C. (2009). The Pro/Pro genotype of the p53 codon 72 polymorphism modulates PAI-1 plasma levels in ageing. Mechanisms of Ageing and Development 130(8): 497–500. doi:10.1016/j.mad.2009.06.001.
Vinogradov, A.E. (1998). Male reproductive strategy and decreased longevity. Acta Biotheoretica 46(2): 157–160. doi:10.1023/A:1001181921303.
Voland, E. and Engel, C. (1986). Ist das postmenopausale Sterbealter Variable einer fitness-maximierenden Reproduktionsstrategie? Anthropologischer Anzeiger
44(1): 19–34.
Westendorp, R.G.J. and Kirkwood, T.B.L. (1998). Human longevity at the cost of reproductive success. Nature 396(6713): 743–746. doi:10.1038/25519.
Zeng, Y. and Vaupel, J.W. (2004). Association of Late Childbearing with Healthy Longevity among the Oldest-Old in China. Population Studies 58(1): 37–53.