DESERT Online at http://jdesert.ut.ac.ir
DESERT 16 (2011) 169-175
Effect of salinity on wheat (
Triticum aestivum
L.) grain yield, yield
components and ion uptake
H.R. Asgari
a*, W. Cornelis
b, P. Van Damme
ba
Assistant Professor, Gorgan University of Agricultural Sciences and Natural Resources, Gorgan, Iran
b
Assistant Professor, Ghent University, Ghent , Belgium
Received: 11 August 2011; Received in revised form: 8 December 2011; Accepted: 26 January 2012
Abstract
Crops growing in salt-affected soils may suffer from physiological drought stress, ion toxicity, and mineral deficiency. A pot study was conducted in 2004-2005 in the Aghala area (northern Iran) to study the effect of different salinity levels, i.e. ECe= 3 (control), 8, 12 and 16 dS m-1 on wheat grain, yield components and leaf ion uptake of four Iranian wheat
genotypes, i.e. Kouhdasht, Atrak, Rasoul and Tajan. Treatments were replicated three times in a completely randomized design in a factorial arrangement. Desired salinity levels were obtained by mixing adequate NaCl before filling the pots. Soil water was maintained at 70% of available water holding capacity. Results revealed that Kouhdasht and Tajan showed highest and lowest grain yield and its components as compared to other cultivars at different salinity levels. Leaf Na+ and Cl- concentrations of all genotypes increased significantly with increasing soil salinity, with the highest concentrations in Tajan, followed by Rasoul, Atrak and Kouhdasht cultivars, respectively. Highest leaf K+ concentration and K+: Na+ ratio were observed in Kouhdasht cultivar, followed by Atrak, Rasoul and Tajan, respectively. Therefore, Kouhdasht and Atrak were identified as the most salt-tolerant genotypes as compared to two other wheat genotypes.
Keywords: Abiotic stresses; Plant ecophysiology; Stress physiology; Semi-arid agriculture
1. Introduction
Abiotic stress is the most harmful factor concerning the growth and productivity of crops worldwide (Mane et al., 2011). Salinity is one of the major abiotic stresses that adversely affect crop productivity and quality (Chinnusamy et al., 2005). The United Nations Environment Program (UNEP) estimates that approximately 50% of cropland in the world is salt-stressed (Flowers and Yeo, 1995). On average, 20% of all irrigated lands are affected by salts (Yeo, 1999), but this figure increases to more than 30% in countries such as Egypt, Argentina and Iran (Zink, 2003).
Adverse effects of salinity on plant growth may be due to ion cytotoxicity (mainly due to Na+, Cl-, and SO42-) and osmotic stress (Zhu, 2002). Based
on plants capacity to grow on high salt medium, they can be classified into two groups, i.e. halophytes and glycophytes. Halophytes are tolerant to high NaCl concentrations (Zhu, 2001a). They generally accumulate Na+ and Cl- in
Corresponding author. Tel.: +98 171 2220028, Fax: +98 171 2225989.
E-mail address: [email protected]
vacuoles and synthesize organicosmolytes in the cytoplasm, which facilitates water uptake into the plant and enhances turgor-driven growth at low to moderatesalinity levels (Bell and O'Leary, 2003). By contrast, with glycophytes, salinity imposes ionic stress, osmotic stress, and secondary stresses such as nutritional disorders and oxidative stress (Zhu, 2001a).
Wheat is moderately tolerant to salt with threshold without yield loss at 6 dS m-1 (Mass and Hoffmann, 1977; Munns et al., 2006) and with yield 50% loss at 13 dS m-1 (Mass and Hoffmann, 1977). Salinity has inhibitory effects on wheat phenological aspects such as leaf number, leaf rate expansion (El-Hendawy et al., 2005), root growth rate (Neumann, 1995b), root/shoot ratio (El-Hendawy et al., 2005) and total dry matter yield (Pessarakli and Huber, 1991).
little genetic variation in Cl- concentration within wheat leaves (Husain et al., 2004).
The sensitivity of some crops to salinity has been attributed to the inability to keep Na+ and Cl -out of the transpiration stream. For many glycophytes, but not all, differences in salt tolerances between genotypes have been closely associated with reduced uptake and accumulation of Na+ and/or Cl- ions at the whole plant (Lee et al., 2005; Tester and Davenport, 2003; Francois and Mass, 1994), shoot and leaf level (Francois and Mass, 1994). In such cases, genetic diversity in the trait of Na+ and Cl- exclusion could be useful selection traits to screen wheat genotypes for salinity tolerance (El-Hendawy, 2004).
Munns et al. (2006) found that wheat genotypes with the lowest Na+ concentrations produced more dry matter than genotypes with high Na+ concentrations. Moreover, there low-Na+ genotypes had fewer injured leaves, and a higher proportion of living to dead leaves.
Several studies have been carried out with different wheat genotypes to look for tolerance to salinity in Iran and eventually a few genotypes, i.e. Alvand, Roshan, Sorkh-tokhmeh, Sholeh, Tabasi, Kavir, Mahoti and Mahdavi were found to be salt-tolerant and consequently proposed to farmers (reviewed by Cheraghi, 2004). However, to our knowledge no work has been done to investigate the response of the wheat cultivars that were studied for our experiments, i.e. Kouhdasht, Rasoul, Tajan and Atrak to soil salinity stress. Therefore, the aim of the present study was to quantify effects of different salinity levels on grain yield, yield components and leaf ion concentrations of these wheat genotypes.
2. Materials and Methods
2.1 Site Description
A pot study was conducted in 2004-2005 in the Aghala area of northern Golestan province (37° 07’ N, 54° 07’ E) which is located in north of Iran. A semi-arid climate prevails in the area. Mean annual
rainfall in Aghala is 386 mm, whereas mean maximum and minimum temperatures are 37.5°C and 1.1°C, respectively. As measured with a US
Class A evaporation pan, mean annual
evapotranspiration is 1445 mm (Asgari, 2001). Golestan province is considered as a major agricultural region of Iran. It consists of vast area of salt-affected soils in the northern parts due to shallow and brackish groundwater and/or high evapotranspiration (Kiani et al., 2005). In Aghala plain, except marginal perch of land in the south near Gorganrud River (that works as a natural drain), most agricultural lands, especially in the north suffer from salinity (Asgari, 2008). Therefore, we situated experimental area in the south, to be able to use normal (non-saline) soil samples and then add calculated amounts of NaCl to create desired levels of saline soils.
2.2 Treatments and Measurements
Treatment combinations included four salinity levels, i.e. 3 (control), 8, 12 and 16 dS m-1 and four wheat genotypes. Some properties of the selected wheat genotypes are summarized in Table1. To characterize soil conditions, fifteen spots were randomly selected on an agricultural field (with 4 hectares in size). In each spot, 2 to 3 sub-samples of approximately 0.5-0.6 kg (wet) weight were taken from the top 0-30 cm using a 4 cm diameter Edelman auger. Specific spot sub-samples were thoroughly mixed to obtain a composite soil sample for each location. Some physico-chemical properties of the soil at the study site are presented in Table 2. Prior to filling test pots (height: 0.33 m; diameter: 0.20 m), NaCl was mixed with the soil to obtain the desired salinity levels. The quantity of NaCl required obtaining a given salinity level was calculated as Eq. 1 (USDA, 1954):
g NaCl per kg soil = TSS × equivalent weight of NaCl ×SP/1000 × 100 Eq. 1
where TSS is total soluble salts, SP is saturation percentage, i.e. moisture percentage of a saturated soil paste on a dry weight basis, whereby the equivalent weight of NaCl was taken as 58.5 meq l-1.
Table.1 Some properties of wheat genotypes used in the experiment (Kalateh et al., 2001) Genotypes
Properties
Tajan Atrak Rasoul Kouhdasht
Seed colour red red white white
Plant height (cm) 90-95 85-95 90-95 92-104
Grain yield (ton ha-1) 5-7 4-6 4-6 4-6
Protein percent (per grain) 13 12.3 12 11.5
Lodging tolerant tolerant tolerant tolerant
Stripe rust (Puccinia striiformis) semi- tolerant semi-sensitive semi-sensitive semi- tolerant Fusarium head blight (Fusarium graminearum) semi-sensitive semi- tolerant semi- tolerant semi- tolerant
Sowing date December December December December
Fertilizers were applied at 120: 60: 60 kg ha-1 NPK as urea, single super phosphate and potassium sulfate, respectively. Ten seeds were sown in each pot with 5 lit pot-1 soil. After germination, three uniform seedlings were selected and allowed to grow whereas the rest was uprooted and discarded. Soil water was maintained at 70% of available water holding capacity. At grain maturity, all plants from each pot were harvested. At grain maturity, numbers of spikes, spikelets, productive tillers and
spike lengths and TGW, grain yield, harvest index and straw yield (weight) were recorded. Wheat leaves were dried at 70 °C and then were digested with 1 NHCl for 24 hours at 40 °C, then shaken for 1.5 hours, and filtered manually. Na+ and K+ concentrations were determined by flame photometry (Jenway PFP-7, Essex, UK), whereas Cl- was measured with a coulometric chloride analyzer (Corning 926, Essex, U.K.).
Table. 2 Some physico-chemical properties of the sampling soil Soil sampling depth (cm) Soil texture Clay 0-2 µm (g kg-1)
Silt 2-50 µm
(g kg-1)
Sand 50-2000 µm
(g kg-1)
OM (g kg-1)
Saturated percent (mass%) Field capacity (mass%) ECe (dS m-1) pH
0-30 30-60 60-90 Si-L Si-C-L Si-C-L 14 33 33 72 59 61 14 8 6 1.52 - - 42 49 53 24.0 28.5 28.8 3.0 3.9 6.2 7.8 8.0 7.9 OM is organic matter content (not measured for 30-60 and 60-90 cm depths);
ECe is electrical conductivity on a saturation extract at 25 °C; Si-L and Si-C-L are silt loam and silty clay loam soils, respectively.
2.4 Statistical Analysis
Completely randomized design (Steel and Torrie, 1980) in factorial arrangement data thus obtained were statistically analyzed using SPSS computer software (version 12.0). Treatment means were compared using Duncan’s Multiple Range Test (Duncan, 1955). A p level of 0.05 was considered in all statistical tests, except when otherwise mentioned.
3. Results
3.1 Grain yield
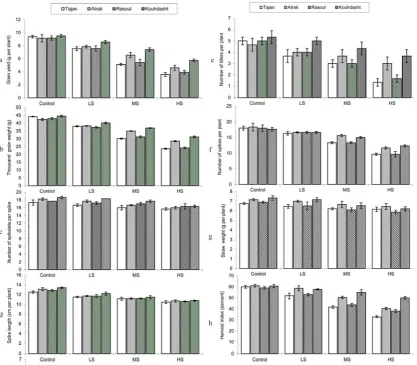
Grain yield of all wheat genotypes significantly decreased with increasing salinity levels (Fig.1a). At relatively low salinity level (LS), Kouhdasht showed significantly higher grain yield than the other genotypes. At relatively moderate salinity (MS) and high salinity (HS) levels, yield differences between genotypes were more pronounced than at LS. Kouhdasht showed significantly higher grain yield than the other genotypes, whereas grain yield of Atrak was significantly higher than that of Rasoul and Tajan. Grain yield differences between the latter two genotypes were not significant at MS and HS.
3.2 Thousand Grain Weight (TGW)
TGW of all wheat genotypes significantly decreased with increasing salinity level (Fig.1b). At LS, highest TGW was observed for Kouhdasht: this value was significantly higher than for the other genotypes. Non-significant differences were observed in TGW of Tajan and Atrak, whereas Rasoul showed consistently the lowest TGW values. At MS and HS, more pronounced
differences in TGW were observed compared to LS. Kouhdasht showed significantly higher TGW than the other genotypes. Non-significant differences were observed in TGW of Rasoul and Tajan at MS and HS.
3.3 Number of Spikelets per Spike (NSS)
NSS of all wheat genotypes was decreased with increasing salinity levels (Fig. 1c). Except for Tajan, LS caused a non-significant decrease in NSS of all wheat genotypes as compared to control conditions. At MS and HS, Tajan showed significantly lower NSS values compared to Kouhdasht and Atrak. Kouhdasht showed highest NSS compared to the other wheat genotypes.
3.4 Spike Length
Spike length of all wheat genotypes was decreased significantly by applying different levels of salinity as compared to control treatment (Fig. 1d). At LS, Kouhdasht showed significantly higher spike length than the other wheat genotypes. At MS and HS, Tajan showed significantly lower spike length than the other three wheat genotypes, whereas Kouhdasht showed the significantly highest spike length.
3.5 Number of Tillers per Plant (NTP)
Fig. 1. Effect of different salinity levels on a) grain yield (g per plant); b) 1000 grain weight (g); c) number of spikelets per spike; d) spike length (cm per plant); e) tiller numbers per plant; f) spikes number per plant; g) straw weight (g); and h) harvest index (). LS, MS and HS
denote relatively low, moderate and high salinity level, respectively; error bars indicate standard deviation.
3.6 Number of Spikes per Plant (NSP)
NSP of all wheat genotypes decreased significantly with increasing salinity levels (Fig. 1f). Non-significant differences were observed for NSP for all wheat genotypes at both control and LS. At MS and HS, Kouhdasht and Atrak cultivars showed significantly higher NSP values than Rasoul and Tajan cultivars. Rasoul and Tajan showed similar NSP.
3.7 Straw Weight
Straw weight of all wheat genotypes decreased with increasing salinity levels (Fig. 1g). At LS, Atrak showed significantly highest straw weight compared to the other genotypes. Non-significant changes in straw weight of the other wheat genotypes were observed at LS as compared to control. At MS and HS, Tajan had significantly lowest straw weight as compared to that obtained by other cultivars.
3.8 Harvest Index (HI)
HI of all wheat genotypes significantly decreased with increasing salinity level (Fig. 1h). Atrak showed significantly higher HI values than Tajan and Rasoul. Non-significant differences were observed for HI between Atrak and Kouhdasht at LS. At MS and HS, differences in HI became more pronounced: Kouhdasht showed significantly higher HI compared to the other genotypes, whereas, Atrak showed significantly higher HI than Rasoul and Tajan.
3.9 Leaf Na+ Concentration
Rasoul > Atrak > Kouhdasht.
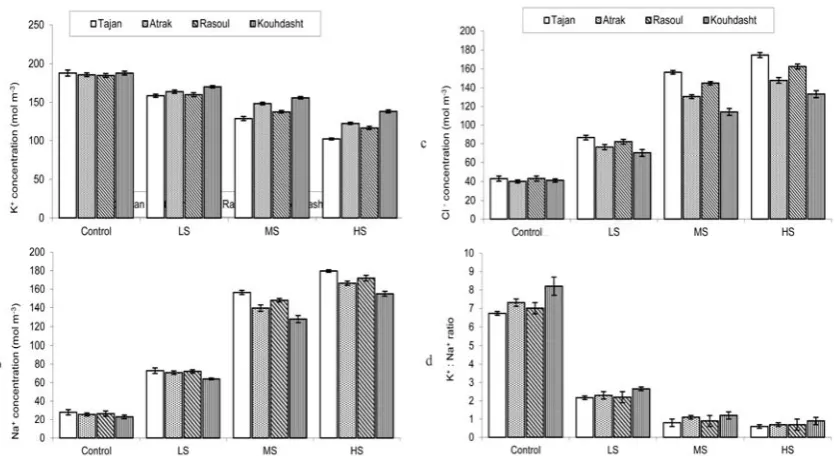
Fig. 2. Effects of different salinity levels on a) leaf K+ concentration (mol m-3); b) leaf Na+ (mol m-3); c) leaf Cl- concentration (mol m-3); and d) leaf K+: Na+ ratio. LS, MS and HS denote relatively low, moderate and high salinity level respectively; error bars indicate standard
deviation
3.10 Leaf K+ Concentration
Leaf K+ concentration of all wheat genotypes significantly decreased with increasing salinity levels as compared to control treatment (Fig. 2b). Under all salinity levels, genotypes were ordered in terms of leaf K+ concentration as: Kouhdasht > Atrak > Rasoul > Tajan, with all values being significantly different.
3.11 Leaf Cl- Concentration
Chloride concentration in all wheat genotype leaves significantly increased with increasing salinity levels as compared to the control treatment (Fig. 2c). Under all salinity levels, genotypes were ordered in terms of leaf Cl- concentration as: Tajan > Rasoul > Atrak > Kouhdasht, with all values being significantly different.
3.12 Leaf K+: Na+ Ratio
Leaf K+: Na+ ratio of all wheat genotypes decreased significantly with increasing salinity level as compared to control treatment (Fig. 2d). At LS, Kouhdasht showed significantly higher K+: Na+ ratio than the other genotypes. Non-significant differences were observed for the other three wheat genotypes. At MS and HS, Kouhdasht showed a significantly higher K+: Na+ ratio compared to the other genotypes, except for Atrak. Non-significant differences were observed in K+: Na+ ratio of Atrak and Rasoul, and also in K+: Na+ ratio of Rasoul and Tajan at the latter two salinity levels.
4. Discussion and Conclusion
low salinity. Maas and Grieve (1990) observed reduction of spikelet and kernel number per spike under the influence of root zone salinity. Grieve et al. (1992) found a reduction in tillering capacity, spike length, number of spikelets and kernels per spike of moderately salt-stressed wheat. In the present study, values of parameters mentioned above, i.e. tiller number and leaf number, decreased with increasing salinity. Tiller numbers per plant of the salt-sensitive genotype (Tajan) showed a higher reduction (by about 37%) than tolerant genotype (Kouhdasht) (i.e. by about 19%). This may indicate that tiller number under salinity can be used as a simple and non-destructive measurement to evaluate salinity stress tolerance of wheat genotypes in breeding programs (El-Hendawy et al., 2005). Munns (1993) indicated that salt in plants reduces growth by causing premature senescence of old leaves and hence reduced supply of assimilates to growing regions. Significant decrease in spike length, spike number and spikelets number per spike of all wheat cultivars was observed with increasing salinity levels. Table 3 shows that spike length and spikelet number per spike have a positive and highly significant correlation with grain yield. Leaf Na+ and Cl -concentrations were increased by salinity, whereas the opposite was observed for leaf K+ concentration and accordingly, the K+: Na+ ratio. K+ had a positive and highly significant correlation with grain yield. Leaf Na+ concentration of Kouhdasht under all salinity levels was significantly lower than that observed in other genotypes (Fig. 2a). Moreover, Kouhdasht accumulated highest K+ concentration and had higher K+: Na+ ratio than that of other wheat genotypes. By contrast, Tajan maintained significantly higher leaf Na+ concentration than the other genotypes (except
Rasoul) under different salinity levels. In contrast, there is a highly significant positive correlation between grain yield and K+ concentrations as well as with K+: Na+ ratio (Table 3).
Within a species, or even within a genus, leaf Na+ concentrations can be used as an indicator of relative ability to ‘exclude’ Na+. In addition, genotype tolerance to high Na+ concentrations in leaves may differ, assumedly due to differences in compartmentation efficiency in leaf vacuoles; this trait has been characterized as ‘tissue tolerance’ (Munns, 2005; Flowers, 2004). The ability to maintain low Na+ and high K+ concentrations in leaves (Dvorak et al., 1994) and K+: Na+ discrimination can be found amongst wheat genotypes, wheat progenitors, and wild relatives (Chhipa and Lal, 1995; Gorham, 1993), although the relationship does not hold across all genotypes (Ashraf and McNeilly, 1988; El-Hendawy et al., 2005). Kouhdasht and Atrak either restricted the Na+ uptake or excluded Na+ from leaves, whereas Tajan and Rasoul were not able to exclude Na+ from their leaves. Higher leaf Na+ concentrations in Tajan and Rasoul might have inhibited K+ uptake, and therefore, these genotypes maintained a low concentration of K+ and consequently a low K+: Na+ ratio in their leaves. By contrast, Kouhdasht showed a restricted uptake of Na+ and Cl-, and a better maintenance of the proper K+: Na+ ratio. As Kouhdasht and Atrak were identified as the most salt-tolerant genotypes, they can be utilized through selection and breeding programs for further improvement in salt tolerance of Iranian wheat genotypes. Furthermore, as Atrak and Kouhdasht are also drought-tolerant (Kalateh et al., 2001), they may possibly be considered as drought/saline-tolerant genotypes in Iran.
Table. 3. Relationship between grain yield and yield components and leaf ion concentrations (Pearson correlation)
GY TGW NTP NSP NSS SL SW HI Na+ Cl- K+
TGW 0.90**
NTP 0.85** 0.80**
NSP 0.81** 0.75** O.79**
NSS -0.72** -0.70** -0.76** 0.64**
SL (cm) -0.65** -0.55** -0.64** 0.54** 0.75**
SW (g/plant) -0.57** -0.68** -0.72** 0.54** 0.68** 0.77** HI (%) 0.86** 0.83** 0.84** 0.84** 0.65** -0.71** 0.68**
Na+ -0.79** -0.75** -0.78** -0.74** -0.56** -0.65** -0.55** -0.78**
Cl- -0.45** -0.56** -0.65** -0.59** -0.67** -0.69** 0.61** -0.78** 0.79**
K+ 0.80** 0.78** 0.78** 0.74** 0.69** -0.74** 0.76** 0.82** -0.77** -0.80**
K+:Na+ratio 0.86** 0.81** 0.76** 0.78** 0.65** -0.63** 0.56** 0.83** -0.73** -0.62** 0.83** ** Highly significant at P = 0.01 probability
GY, TGW, NTP, NSS, NSP, SL, SW, HI, Na+, Cl- and K+ are respectively grain yield, 1000 grain weight, number of tillers per plant, number of spikelets per spike, number of spikes per plant, spike length, straw weight, harvest index, leaf Na+ concentration, leaf Cl- concentration and leaf K+ concentration, respectively.
Acknowledgements
The authors gratefully acknowledge the financial and logistic assistance provided by Gorgan University of Agricultural Science and Natural Resources of Iran, and by the Faculty of
Bio-engineering Science of Ghent University, Belgium.
References
University of Agricultural Science and Natural Resources (in Persian). p. 90-91.
Asgari, H.R., T.M. Hasan Ghassemi, W.M. Cornelis and P. Van Damme, 2008. Evaluating salt tolerance of four Iranian wheat (Triticum aestivum L.) genotypes at different levels of salinity. Proceedings of the International Conference on Desertification. 23 January 2008, Ghent, Belgium. P: 75-76.
Ashraf, M. and T. Mc Neilly, 1988. Variability in salt tolerance of nine spring wheat cultivars. Journal of Agronomy and Crop Science, 160: 14–21.
Bell, H. and J. O’Leary, 2003. Effects of salinity on growth and cation accumulation of Sporopolus virginicus (Poaceae). Amrican Journal of Botany, 90:1416–1424. Cheraghi, S.A.M., 2004. Institutional and scientific profiles of organizations working on saline agriculture in Iran. In Prospects of Saline Agriculture in the Arabian Peninsula: Proceedings of the International Seminar on Prospects of Saline Agriculture in the GCC Countries. (Eds.), Taha, F.K., Ismail, S., Jaradat, A. 18-20 March 2001, Dubai, United Arab Emirates, pp. 399-412.
Chhipa, B.R. and P. Lal, 1995. Na/K ratios as the basis of salt tolerance in wheat. Australian Jouranl of Agricultural Research, 46: 533–539.
Chinnusamy, V., A. Jagendorf and J.K. Jhu, 2005. Understanding and improving salt tolerance in plants. Crop Science, 45: 437-448.
Colmer, T.D., R. Munns and T.J. Flowers, 2005a. Improving salt tolerance of wheat and barley: future prospects. Australian Journal of Experimental Agriculture, 45: 1425- 1443.
Duncan, D.B., 1955. Multiple Range and Multiple Tests. Biometrics,11: 1-42.
Dvorak, J., M.M. Noaman, S. Goyal and J. Gorham, 1994. Enhancement of the salt tolerance of Triticum turgidum L by the Kna1 locus transferred from Triticum aestivum L. chromosome 4D by homoeologous recombination. Theorectical and Applied Genetics, 87: 872-877.
El-Hendawy, S.E., 2004. Salinity Tolerance in Egyptian Spring Wheat Genotypes. Ph.D Thesis, Department für Pflanzenwissenschaften, Technische Universität München. p. 1-10.
El-Hendawya, S.E., Y. Hua, G.M. Yakout, A.M. Awad, S.E. Hafizb and U. Schmidhalter, 2005. Evaluating salt tolerance of wheat genotypes using multiple parameters. European. Journal of Agronomy, 22: 243-253.
Flowers, T. J., 2004. Improving crop salt tolerance. Journal of Experimental Botany, 55: 307-319.
Francois, L.E., C.M. Grieve, E.V. Maas, T.J. Donovan and S.M. Lesch, 1994. Time of salt stress affects growth and yield components of irrigated wheat. Agronomy Journal, 86: 100–107.
Gorham, J., 1990a. Salt tolerance in the Triticeae: K : Na discrimination in Aegilops species. Journal of Experimental Botany, 41: 615-621.
Gorham, J., 1993. Genetics and physiology of enhanced K: Na discrimination. In: Randall, P.J., Delhaize, E., Richards, R.A., Munns, R. (Eds), Genetic aspects of plant mineral nutrition. Dordrecht: Kluwer Academic Publishers, pp.151-158.
Grieve, C.M., S.M. Lesch, L.E. Francois and K.H. Maas, 1992. Analysis of main spike and yield components in salt stressed wheat. Crop Science, 32: 697–703.
Husain, S., S. von Caemmerer and R. Munns, 2004. Control of salt transport from roots to shoots of wheat in saline soil. Functional Plant Biology, 31: 1115-1126.
Kalateh, M., M.A. Dehghan, J. Jafarbai, A. Nourinia, A. Abroudi, H. Soghi, S. Kia, H.A. Fallah and A. Nazari, 2001. Some wheat genotypes characteristics in Golestan province and technical suggestions. Gorgan Agricultural Research Centre Report, unpublished report (in Persian). Kiani, A., M.E. Asadi, M. Homaee and M. Mirlatifi, 2005. Wheat production function under salinity and water stress conditions. MTERM International Conference. Thailand, pp. 14-22.
Lee, G., R.N. Carrow and R.R. Duncan, 2005. Criteria for Assessing Salinity Tolerance of the Halophytic Turfgrass Seashore Paspalum. Published online 1 January 2005, Crop Science.
Maas, E.V. and C.M. Grieve, 1990. Spike and leaf development in salt-stressed wheat. Crop Science, 30: 1309-1313.
Mass, E.V. and G.F. Hoffiman, 1977. Crop salt tolerance- current assessment. Journal of Irrigation and Drinage, 103: 115-134.
Munns, R., 1993. Physiological processes limiting plant growth in saline soil: some dogmas and hypotheses. Plant, Cell and Environment, 16: 15-24.
Munns, R., 2002. Comparative physiology of salt and water stress. Plant, Cell and Environment, 25: 239-250.
Munns, R., 2005. Genes and salt tolerance: bringing them together. New Phytologist, 167: 645-663.
Munns, R. and R.A. James, 2003. Screening methods for salinity tolerance: a case study with tetraploid wheat. Plant and Soil, 253: 201-218.
Munns, R., A. Richard and A. Läuchli, 2006. Approaches to increasing the salt tolerance of wheat and other cereals. Journal of Experimental Botany, 57: 1025-1043.
Neumann, P.M., 1995b. The role of cell wall adjustment in plant resistance to water deficits. Crop Science, 35: 1258- 1266.
Pessarakli, M. and J.T. Huber, 1991. Biomass production and protein synthesis by alfalfa under salt stress. Journal of Plant Nutrition, 14(3): 283-293.
SPSS Inc., 2000. Statistical Package for Social Sciences 10.0 for Windows User's Guide. SPSS Inc., Chicago IL. Steel, R.G.D. and J.H. Torrie, 1980. Principles and Procedures of Statistics. 2nd ed. McGraw Hill Book Co. Inc., New York.
Tester, M. and R. Davenport, 2003. Na+ tolerance and Na+ transport in higher plants. Annals of Botany, 91: 503-527. Tyerman, S.D and I.M. Skerrett, 1999. Root ion channels and salinity. Scientia. Horticulture, 78: 175-235.
USDA., 1954. Diagnosis and improvement of saline and alkali soils. in Saskatchewan soils. Can. J. Soil Sci. 64:669-704. Agric. Handb. no. 60. United States Salinity Laboratory, RiverHolliday, G., and L.E. Deuel, Jr. 1997. Soil Remediation for the side, CA.
Yeo, A.R., 1999. Predicting the interaction between the effects of salinity and climate change on crop plants. Scientica Horticulture, 78: 159-174.
Zhu, J.K., 2001. Cell signaling under salt, water and cold stress. Plant Biology, 4: 401–406.