ISSN: 1735-0344 Tanaffos 2014; 13(2): 27-34
Spirometry Values for Detecting a Restrictive Pattern in
Occupational Health Settings
Amir Houshang Mehrparvar 1, Mohammad Javad Zare Sakhvidi 2, Mehrdad
Mostaghaci 1, Mohmmad Hossein Davari 1, Seyed Hesam Hashemi 1, Zohreh Zare 1
1 Occupational Medicine Department, Faculty of
Medicine, Shahid Sadoughi University of Medical
Sciences, 2 Occupational Health Department, Faculty of
Health, Shahid Sadoughi University of Medical Sciences, Yazd, Iran
Received: 11 March 2014 Accepted: 30 May 2014
Correspondence to: Mostaghaci M
Address: Occupational Clinic, Shahid Rahnamoun hospital, Farrokhi Ave., Yazd, Iran
Email address: [email protected]
Background: Pulmonary function tests are valuable measures for diagnosis and management of respiratory diseases. In the field of occupational medicine, spirometry is commonly performed, and in a considerable number of spirometries during occupational health evaluations, restrictive pattern is observed without any respiratory symptoms and may necessitate referral of the subject for body plethysmography, which is an expensive test.
In this study, we evaluated the diagnostic accuracy of spirometry for detection of restrictive lung pattern in an occupational setting.
Materials and Methods: In a cross-sectional study from 2008 to 2012, 1224 subjects were selected and entered in the study out of 1,486 individuals referred for annual spirometry. Selected subjects underwent spirometry and body plethysmography. Subjects were divided into two groups of restrictive and non-restrictive patterns and then sensitivity, specificity, positive predictive value (PPV) and negative predictive value (NPV) of spirometry for detection of restrictive lung pattern were calculated using total lung capacity measured by plethysmography as the gold standard. Receiver operating characteristic (ROC) curves were used as well.
Results: Spirometry showed sensitivity, specificity, PPV and NPV of 97.75%, 73.04%, 73.72% and 97.67% for FVC< lower limit of normal (LLN) and 98.68%, 78.00%, 77.31% and 98.83% for FVC< LLN along with FEV1/FVC≥ LLN, respectively. According to the ROC curve, the best cut-off point for FVC for detection of restrictive lung pattern was 70%.
Conclusion: This study showed that spirometry is a useful method in occupational health evaluations to rule out restrictive lung patterns with acceptable accuracy; however, it is not an accurate tool for detection of restrictive lung pattern in an occupational setting. Simultaneous use of FVC and FEV1/FVC for detection of restriction increases the predictive value of spirometry.
Key words:
Spirometry, Body plethysmography, Restrictive lung
pattern, Occupational health evaluation
INTRODUCTION
Pulmonary diseases are responsible for significant morbidity and mortality worldwide (1). Pulmonary function tests play a critical role in diagnosis and management of pulmonary diseases. These tests are performed to diagnose or rule out obstructive, restrictive or mixed ventilatory defects (2-4). An accurate diagnosis and an acceptable maneuver depend on various factors such as the device, operator, patient and environmental conditions (5-9).
One main application of spirometry is for screening subjects in occupational settings. Spirometry is routinely used as a screening tool for early detection of impaired lung function in workers exposed to respiratory irritants. Thus, spirometry tests are widely used for annual occupational health evaluations. Spirometry can directly detect obstructive lung diseases i.e. FEV1/FVC, and it can also be used for screening or ruling out restrictive lung patterns (i.e. decreased FVC) (10-12).
Spirometry cannot measure residual volume (RV) or total lung capacity (TLC), so the gold standard for detection of a restrictive lung pattern is body plethysmography, which can measure TLC (13, 14). A decreased FVC may show a true restrictive lung pattern or may reflect airflow obstruction due to air trapping, or early termination of spirometry maneuver (15).
Early detection of a restrictive lung pattern is very important for timely management. In occupational medicine, spirometry is useful for pre-placement testing and periodic evaluations (16). During occupational health evaluations, spirometry is routinely used. If a restrictive pattern is detected by this test, the patient is referred for body plethysmography, an expensive test, which is not available in many medical centers (17-22).
Variable accuracy values have been reported for spirometry in detection of restrictive lung pattern. Spirometry has been reported to have a sensitivity of 32% to 95%, and specificity of 42% to 98% for detection of restrictive lung patterns (15, 17, 23, 24). Most studies have shown a high NPV and low PPV for spirometry (15, 17,
23-25), although a high PPV has also been reported by some researchers (17, 26).
This study was designed to evaluate the accuracy of spirometry for detection of restrictive lung pattern in an occupational health setting.
MATERIALS AND METHODS
This was a cross-sectional (diagnostic) study to assess the accuracy of spirometry for detection of restrictive lung patterns. The study population consisted of all individuals referred to the pulmonary function laboratory of occupational health clinic in Shahid Sadoughi University of Medical Sciences, Yazd, Iran to perform spirometry regardless of diagnosis. Individuals were referred for pre-placement, periodic or specific occupational health evaluations from different workplaces. Our sample size was calculated to be 500 subjects in each group (restrictive and non-restrictive pattern) considering the sensitivity of more than 90% for spirometry and power of 90%. In a 4-year period (April 2008 to May 2012), from 14,486 individuals who underwent periodic pulmonary function tests, 708 subjects with restrictive pattern who could perform spirometric maneuvers were entered in the study and 516 individuals without restrictive pattern were selected as the control group.
For height measurement, subjects were asked to stand without shoes against a wall (buttocks, back, and head against the wall) with their heads erect. A ruler was placed against the wall and the subject’s head to ensure correct reading. The height was measured to the nearest centimeter from the floor to the bottom of the ruler by a metal ruler attached to the wall. Age was recorded according to the patients’ self-reporting. Weight was measured without shoes by a digital scale (Laica, Italy).
calibrated daily by its internal syringe. Both tests were performed in a standard condition (in a sitting position, in the morning). Room temperature was kept between 20 and 26°C. Spirometry and body plethysmography results were automatically corrected for body temperature pressure saturation (BTPS) conditions by the device software.
All tests were performed according to American Thoracic society/European Respiratory Society (ATS/ERS) guidelines for spirometry and lung volume measurement (27-30). Acceptability criteria were considered according to ATS/ERS taskforce (a satisfactory start of test criteria i.e. extrapolated volume of less than 0.5% of FVC or 0.150 L and a satisfactory end of test criteria i.e. a 1s plateau in the volume–time curve, without coughing during the first second of the maneuver, without early termination of expiration, and without glottis closure) (27). Spirograms were repeated until three acceptable tests were obtained. Studies were considered repeatable if the largest and second largest values for FVC and FEV1 were within 150 mL of each other. If the first maneuvers were not satisfactory, further maneuvers were used until the reproducibility criteria were satisfied or a maximum of eight maneuvers was reached (28). Spirometry was performed by a trained technician.
For spirometry, the highest sum of FVC and FEV1 from three technically acceptable recordings was selected. Before performing the test, all factors intervening or contraindicating spirometry were questioned (27).
For lung volume measurement, a minimum of two attempts with the functional residual capacity reproducible within 5% were made for each patient (24). Plethysmography was performed by a trained technician blinded to the results of spirometry. Spirometric reference values were extracted from Golshan et al. (31). Lung volume reference values were used according to Golshan et al. (32).
For determination of the diagnostic accuracy of FVC, we used two criteria: FVC< LLN alone; and FVC<LLN along with FEV1/FVC>LLN. Restrictive body plethysmographic pattern was defined as TLC<LLN.
To determine the best cutoff point for FVC for detection of restriction in our population, ROC curve analysis was performed using two definitions for FVC.
Data were analyzed by SPSS (ver. 19) using chi square test, t-test and Pearson's correlation test. Sensitivity, specificity, PPV and NPV of spirometry were calculated. Diagnostic accuracy expressed as [(true positives+ true negatives) / (true positives+ true negatives+ false positives+ false negatives)] was also calculated (20). Level of significance was set at P<0.05.
This research was approved by the Ethics Committee of Shahid Sadoughi University of Medical Sciences. An informed consent (in Persian) was obtained from all participants before the tests.
RESULTS
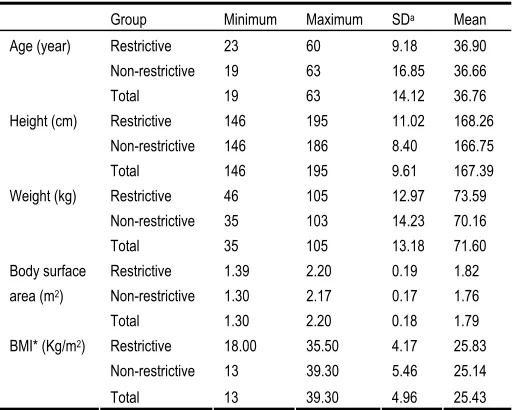
This study was performed between April 2008 and May 2012. A total of 708 individuals with restrictive and 516 subjects without restrictive patterns were entered in the study. Table 1 shows demographic data of the subjects. The mean age and height were not significantly different between the two groups (P= 0.83 and P= 0.67, respectively).
Table 1. Demographic data of the subjects in the two groups
Group Minimum Maximum SDa Mean
Restrictive 23 60 9.18 36.90
Non-restrictive 19 63 16.85 36.66
Age (year)
Total 19 63 14.12 36.76
Restrictive 146 195 11.02 168.26
Non-restrictive 146 186 8.40 166.75
Height (cm)
Total 146 195 9.61 167.39
Restrictive 46 105 12.97 73.59
Non-restrictive 35 103 14.23 70.16
Weight (kg)
Total 35 105 13.18 71.60
Restrictive 1.39 2.20 0.19 1.82
Non-restrictive 1.30 2.17 0.17 1.76
Body surface
area (m2)
Total 1.30 2.20 0.18 1.79
Restrictive 18.00 35.50 4.17 25.83
Non-restrictive 13 39.30 5.46 25.14
BMI* (Kg/m2)
Total 13 39.30 4.96 25.43
Tables 2 and 3 show the accuracy of spirometry for detection of restrictive lung patterns according to the aforementioned two criteria. Kappa coefficient for FVC<LLN alone and FVC<LLN along with FEV1/FVC≥LLN was found to be 0.691 (P<0.001) and 0.742 (P<0.001), respectively.
Table 2. Comparison of FVC <LLN along with lung volume measurements by plethysmography.
TLCb<LLN TLC≥LLN Total
FVCa<LLN 261 93 354
FVC≥LLN 6 252 258
Total 267 345 612
aFVC: Forced vital capacity, bTLC: Total lung capacity
Sensitivity = 97.75%, Specificity = 73.04%, PPV = 73.72%, NPV = 97.67%, Likelihood ratio = 2.64, Diagnostic Accuracy= (522+504)/ (522+504+186+12) = 1026/1224 = 83.82%
Table 3. Comparison of FVC < LLN along with FEV1/FVC ≥ LLN; with lung volume measurements by plethysmography.
TLCb<LLN TLC≥LLN Total
FVCa<LLN and FEV1/FVC≥LLN 225 66 291
FVC≥LLN or FEV1/FVC<LLN 3 234 237
Total 228 300 528
aFVC: Forced vital capacity, bTLC: Total lung capacity
Sensitivity = 98.68%, Specificity = 78.00%, PPV = 77.31%, NPV = 98.83%, Likelihood ratio = 4.48, Diagnostic Accuracy: (450+468)/ (450+468+132+6) = 918/1056= 86.93%
Area under the ROC curve was 0.835 (95%CI = 0.810-0.883) for FVC<LLN alone. This value was 0.847 (95%CI = 0.801-0.870) for FVC<LLN along with FEV1/FVC≥LLN. Figure 1 shows the ROC curve for FVC<LLN alone and Table 4 shows the likelihood ratio of different FVC measures for FVC<LLN alone. The best cut-off point for FVC in detection of restrictive respiratory disease in our population was 70% predicted.
Figure 1. ROC curve for FVC<LLN alone.
Table 4. Likelihood ratio for different amounts of FVC for FVC<LLN alone.
FVCa % Sensitivity % Specificity % Likelihood ratio
60 19.1 11.4 1.67
65 39.3 14.9 2.63
70 57.3 14.9 3.84
75 75.3 23.9 3.15
80 97.8 31.0 3.10
85 100 3.33 3.00
aFVC: Forced vital capacity
Figure 2 shows the ROC curve for FVC<LLN along with FEV1/FVC≥LLN and Table 5 shows the likelihood ratio of different FVC values for FVC<LLN along with FEV1/FVC≥LLN. The best cut-off point for FVC considering this criterion was 70% predicted as well. Table 6 compares the results of the current study with those of other studies.
Table 5. Likelihood ratio for different amounts of FVC for FVC < LLN along with FEV1/FVC≥LLN.
FVC % Sensitivity % Specificity % Likelihood ratio
60 15.2 10.3 1.47
65 38.0 14.4 2.63
70 57.0 14.4 3.95
75 74.7 19.6 3.81
80 98.7 26.7 0.69
85 100 30.9 3.23
Table 6. Comparison of the results of different studies about the accuracy of spirometry for diagnosis of restrictive lung pattern
Name of Study year
Ref No. Population Criteria Sena Speb PPVc NPVd
Low Cut-off
High
Cut-off FVC AROCe
1f 97.75 73.04 73.72 97.67 70 85 0.835
Present study 2012 Consecutive Referred
Adults 2g 98.68 78.00 77.31 98.83 70 85 0.847
1 86 83 41 97.6 - - -
Aaron 199923 Consecutive Referred
Adults 2 68 93 58 94 - - -
1 88.6 56.8 39.9 93.9 - - 0.817
Venkateshiah 200815 Consecutive Referred
Adults 2 72.4 87.1 64.4 90.7 - - 0.584
Derivation 96 61 40 51 - 85
Glady 200324 Consecutive Referred
Adults Validation 94 61 43 97 - 85 0.90
1 32 95 81 69 - - 0.89
Scarlata 200917
Ambulatory and acute care hospital patients
aged 65 to 96 2 28 98 89 69 - - 0.92
Derivation 95 42 25 98 - - 0.81
Khalid 201125
Retrospective analysis of prospectively
collected data Validation 95 44 22 98 70 - 0.71
Boros 200426 Retrospective, cross
sectional 1 69.3 97.4 88.5 91.5 -
-Zielonka. 200633 Children with MGh FVCi<0.8 - - - - -
-FVC<0.6 Mj 30.5 96.3 90 - M60 -
D'Aquino 201034 Consecutive Referred
Adults FVC<0.5Fk 60.0 92.3 98 - F50
-0.793
ATS 97 85 55 99 - -
Glady 100 69 37 100 -
-Swanney 200435 Consecutive Referred
Adults
Swanney 97 81 49 99 -
-0.872-0.880
aSen: sensitivity, bSpe: specificity, cPPV: positive predictive value, dNPV: negative predictive value, eFVC AROC: FVC area under the Receiver Operating Curve, f1: FVC< LLN, g2: FVC<LLN along
DISCUSSION
Spirometry is used as a screening tool for restrictive lung pattern. Low FVC is a screening criterion for restrictive lung pattern, although in order to more accurately diagnose restrictive diseases, lung volumes should be measured. In this study, we assessed the accuracy of spirometry for detection of restrictive diseases in comparison with body plethysmography as a gold standard in an occupational setting.
This study showed that spirometry had acceptable sensitivity and NPV for detection of restrictive lung pattern, but low specificity and PPV, resulting in low false negative and high false positive results. Therefore, spirometry is a reliable tool to rule out restrictive lung patterns.
When FVC is within the normal range, measuring lung volumes is not necessary (the probability of restrictive disease is about 1.17-2.33%), but low FVC is not a good criterion for detection of restrictive lung pattern (the probability of restrictive lung pattern is about 73.72-77.31%); this finding is consistent with the results of some previous studies (15, 16, 23-26, 33-35). Therefore, considering the high NPV of spirometry, 690 lung volume measurements in our study population (out of 1,224 tests) were not necessary and should have not been performed. Considering the high cost and unavailability of body plethysmography in many centers, it is important for clinicians and pulmonary function lab technicians to avoid unnecessary lung volume measurements.
To the best of our knowledge, this study was the first to assess this issue in an occupational health setting and also among the Iranian population using the reference equations for the Iranian population described by Golshan et al. (31).
In this study, we considered two criteria for restrictive lung pattern (FVC<LLN alone and FVC<LLN along with FEV1/FVC ≥ LLN). The second criterion was more accurate than the first one with higher sensitivity and NPV, which was consistent with the study by Aaron et al. (23), but not
consistent with the study by Venkateshiah et al. (15). Aaron et al. found a low PPV for both criteria, which was much lower than the PPV obtained in our study (23). Venkateshiah et al. explained that the test results of the same individuals varied during the study period in such way that FEV1/FVC fell below the LLN, leading to unsatisfactory results for the combined criterion (15).
ROC curve analysis confirmed this finding and showed that FVC<LLN combined with FEV1/FVC≥LLN was a better predictor of restrictive disease than FVC<LLN alone. This analysis also showed the cut-off point of 70% predicted to be the best predictor of restrictive lung pattern in occupational health evaluations.
Different studies have assessed the accuracy of spirometry for detection of restrictive lung pattern with different results (Table 6).
The current study showed that FVC≥85% definitely ruled out restrictive lung pattern consistent with the study by Glady et al, (24).
Our study confirmed the results of some previous studies. Glady et al. proposed an algorithm for predicting restrictive lung pattern according to the results of spirometry and showed that application of their algorithm to the clinical practice may prevent unnecessary plethysmography in about 50% of patients (24). Boros et al. in another study found that measurement of vital capacity was not reliable for detecting restrictive pattern due to low sensitivity (69.3%) (26).
CONCLUSION
This study showed that spirometry is a useful tool for ruling out restrictive lung pattern with acceptable accuracy in occupational health evaluations; however it is not an accurate tool for detection of restrictive lung pattern.
REFERENCES
1. WHO Statistical Information System (WHOSIS) 2010.
2. Pellegrino R, Viegi G, Brusasco V, Crapo RO, Burgos F, Casaburi R, et al. Interpretative strategies for lung function
tests. Eur Respir J 2005; 26 (5): 948- 68.
3. Kowalski J. When Spirometry or Whole Body Pletysmography and Lung Function Test is Indicated? http://www.
ifp.kiev.ua/doc/journals/upj/05_dop /50_en.pdf. Accessed
January 15, 2012.
4. Hansen JE, Sun XG, Wasserman K. Should forced expiratory
volume in six seconds replace forced vital capacity to detect
airway obstruction? Eur Respir J 2006; 27 (6): 1244- 50.
5. Al-Ashkar F, Mehra R, Mazzone PJ. Interpreting pulmonary
function tests: recognize the pattern, and the diagnosis will
follow. Cleve Clin J Med 2003; 70 (10): 866, 868, 871-3, passim.
6. Lung function testing: selection of reference values and
interpretative strategies. American Thoracic Society. Am Rev
Respir Dis 1991; 144 (5): 1202- 18.
7. Hankinson JL, Wagner GR. Medical screening using periodic
spirometry for detection of chronic lung disease. Occup Med
1993; 8 (2): 353- 61.
8. Standardization of Spirometry, 1994 Update. American
Thoracic Society. Am J Respir Crit Care Med 1995; 152 (3):
1107-36.
9. Begg CB. Biases in the assessment of diagnostic tests. Stat Med
1987; 6 (4): 411- 23.
10. Swanney MP, Jensen RL, Crichton DA, Beckert LE, Cardno
LA, Crapo RO. FEV(6) is an acceptable surrogate for FVC in
the spirometric diagnosis of airway obstruction and
restriction. Am J Respir Crit Care Med 2000; 162 (3 Pt 1): 917-
9.
11. Vandevoorde J, Verbanck S, Schuermans D, Kartounian J,
Vincken W. FEV1/FEV6 and FEV6 as an alternative for FEV1/FVC and FVC in the spirometric detection of airway
obstruction and restriction. Chest 2005; 127 (5): 1560- 4.
12. Hankinson JL, Odencrantz JR, Fedan KB. Spirometric reference values from a sample of the general U.S. population.
Am J Respir Crit Care Med 1999; 159 (1): 179- 87.
13. Crapo RO. Pulmonary-function testing. N Engl J Med 1994; 331 (1): 25- 30.
14. Vandevoorde J, Verbanck S, Schuermans D, Broekaert L, Devroey D, Kartounian J, et al. Forced vital capacity and
forced expiratory volume in six seconds as predictors of reduced total lung capacity. Eur Respir J 2008; 31 (2): 391- 5. 15. Venkateshiah SB, Ioachimescu OC, McCarthy K, Stoller JK.
The utility of spirometry in diagnosing pulmonary restriction.
Lung 2008; 186 (1): 19- 25.
16. Rabe KF, Hurd S, Anzueto A, Barnes PJ, Buist SA, Calverley P, et al. Global strategy for the diagnosis, management, and
prevention of chronic obstructive pulmonary disease: GOLD executive summary. Am J Respir Crit Care Med 2007; 176 (6): 532- 55.
17. Scarlata S, Pedone C, Conte ME, Incalzi RA. Accuracy of
spirometry in diagnosing pulmonary restriction in elderly people. J Am Geriatr Soc 2009; 57 (11): 2107- 11.
18. GOLDMAN HI, BECKLAKE MR. Respiratory function tests; normal values at median altitudes and the prediction of
normal results. Am Rev Tuberc 1959; 79 (4): 457- 67.
19. Crapo RO, Morris AH, Clayton PD, Nixon CR. Lung volumes in healthy nonsmoking adults. Bull Eur Physiopathol Respir
1982; 18 (3): 419- 25.
20. Kilburn KH, Miller A, Warshaw RH. Measuring lung volumes in advanced asbestosis: comparability of plethysmographic and radiographic versus helium rebreathing and single breath methods. Respir Med 1993; 87 (2): 115-20.
21. Punjabi NM, Shade D, Wise RA. Correction of single-breath helium lung volumes in patients with airflow obstruction.
Chest 1998; 114 (3): 907- 18.
22. Clausen JL. Prediction of normal values in pulmonary
function testing. Clin Chest Med. 1989 Jun;10(2):135-43. 23. Aaron SD, Dales RE, Cardinal P. How accurate is spirometry
at predicting restrictive pulmonary impairment? Chest 1999; 115 (3): 869- 73.
24. Glady CA, Aaron SD, Lunau M, Clinch J, Dales RE. A spirometry-based algorithm to direct lung function testing in the pulmonary function laboratory. Chest 2003; 123 (6): 1939- 46.
25. Khalid I, Morris ZQ, Khalid TJ, Nisar A, Digiovine B. Using spirometry to rule out restriction in patients with concomitant low forced vital capacity and obstructive pattern. Open Respir Med J 2011; 5: 44- 50.
patients. Spirometry in interstitial lung diseases. Respiration
2004; 71 (4): 374- 9.
27. Miller MR, Hankinson J, Brusasco V, Burgos F, Casaburi R,
Coates A, et al. Standardisation of spirometry. Eur Respir J
2005; 26 (2): 319- 38.
28. Medical Section of the American Lung Association, American Thoracic Society Standardization of Spirometry, 1994 Update.
http://www.warrengoff.com/PFT-VIM/Standardization of Spirometry.pdf . Accessed April 19, 2012.
29. Miller MR, Crapo R, Hankinson J, Brusasco V, Burgos F, Casaburi R, et al. General considerations for lung function
testing. Eur Respir J 2005; 26 (1): 153- 61.
30. Wanger J, Clausen JL, Coates A, Pedersen OF, Brusasco V, Burgos F, et al. Standardisation of the measurement of lung volumes. Eur Respir J 2005; 26 (3): 511- 22.
31. Golshan M, Nemat-Bakhsh M. Prediction Equations Ventilatory Function in non-smoker adults in Isfahan, Iran. Iran J Med Sci. 2000; 25(3-4):125-8.
32. Golshan M, Amra B, Soltani F, Crapo RO, Reference Values for Lung Volumes in an Iranian Population: Introducing a New Equation Model. Arch Iranian Med. 2009;12(3):256 – 61.
33. Zielonka T, Kostera-Pruszczyk A, Ryniewicz B, Korczyński P, Szyluk B. How accurate is spirometry at predicting restrictive pulmonary impairment in children with myasthenia gravis. J Physiol Pharmacol 2006; 57 Suppl 4: 409- 16.
34. D'Aquino LC, Rodrigues SC, Barros JA, Rubin AS, Rosário Filho NA, Pereira CA. Predicting reduced TLC in patients with low FVC and a normal or elevated FEV1/FVC ratio. J Bras Pneumol 2010; 36 (4): 460- 7.
35. Swanney MP, Beckert LE, Frampton CM, Wallace LA, Jensen RL, Crapo RO. Validity of the American Thoracic Society and other spirometric algorithms using FVC and forced expiratory volume at 6 s for predicting a reduced total lung capacity.